For retail investors entering crypto or the stock market, understanding these differences makes trading charts easier to interpret. The goal isn't to predict future price movements with certainty. It's to build a small, reliable toolkit for evaluating market conditions, identifying possible entry and exit points, and managing risk.
Key Takeaways
-
Technical indicators use historical price data and trading volume to assess trends, momentum, volatility, and market participation.
-
Moving averages, RSI, and MACD are practical starting points for beginners.
-
Volume indicators help assess whether market participation supports a price move.
-
Combining a few complementary indicators is generally more useful than adding too many indicators.
-
No technical analysis indicator guarantees future price direction or profitable trades.
What Are Technical Indicators in Trading?
Technical indicators are mathematical calculations applied to historical prices, trading volume, and other market data. They help traders interpret market behaviour and build rules-based trading strategies.
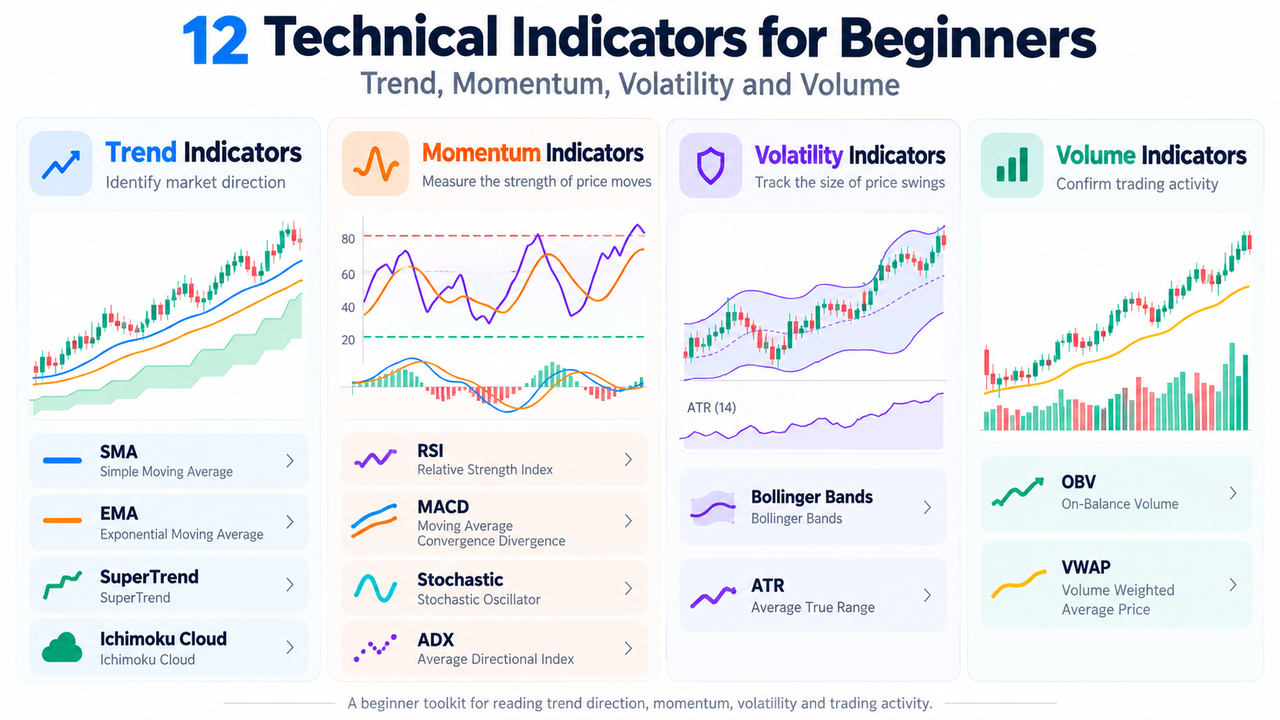
Most technical analysis indicators fall into four categories:
| Category |
Main Purpose |
Examples |
| Trend |
Identify price direction |
SMA, EMA, SuperTrend |
| Momentum |
Measure buying or selling pressure |
RSI, MACD, Stochastic |
| Volatility |
Assess size of price fluctuations |
Bollinger Bands, ATR |
| Volume |
Evaluate market participation |
OBV, Volume |
Indicators complement price action and market structure. They don't replace the need to examine support and resistance levels, chart patterns, or fundamental analysis.
12 Best Technical Indicators for Beginners
-
Simple Moving Average (SMA): Identifying Trends
The Simple Moving Average calculates the arithmetic average of closing prices over a specific period.
A 50-period SMA, for example, averages 50 closing price points. Price remaining above a rising SMA may suggest an upward trend, while trading below a declining SMA indicates weakness.
Moving averages can also act as dynamic support and resistance levels, although prices frequently cross them in sideways markets.
-
Exponential Moving Average (EMA): Tracking Recent Prices
The Exponential Moving Average assigns greater weight to recent prices, allowing it to respond faster than an SMA.
Traders often monitor 9-, 20-, and 50-period EMAs for different trend horizons. A shorter EMA crossing above a longer EMA may indicate improving momentum.
That responsiveness comes with a tradeoff: shorter EMAs can generate false signals during choppy markets.
-
Moving Average Convergence Divergence (MACD): Momentum Changes
Moving Average Convergence Divergence (MACD) compares two exponential moving averages, commonly the 12-period and 26-period EMAs.
The MACD line, nine-period signal line, and histogram help assess market momentum.
A MACD line crossing above its signal line may suggest bullish momentum. Crossing below can produce a potential sell signal. However, frequent crossovers in ranging markets can be misleading.
-
Relative Strength Index (RSI): Overbought and Oversold Conditions
The Relative Strength Index (RSI) is a momentum indicator ranging from 0 to 100.
Common interpretations include:
-
Above 70: potentially overbought.
-
Below 30: potentially oversold.
-
Around 50: relatively balanced momentum.
An RSI above 70 doesn't automatically mean traders should sell. Strong trending markets can remain overbought for extended periods.
-
Stochastic Oscillator: Short-Term Momentum
The Stochastic Oscillator compares a recent closing price with the asset's high-low range over a selected period.
Its readings also range from 0 to 100. Values above 80 suggest overbought conditions, while readings below 20 suggest oversold conditions.
Unlike RSI, which evaluates relative gains and losses, stochastic analysis emphasizes where price closes within its recent trading range.
Both can react to short-term price fluctuations without confirming a reversal.
-
Average Directional Index (ADX): Measuring Trend Strength
The Average Directional Index measures trend strength on a scale from 0 to 100.
Readings above approximately 25 commonly suggest a meaningful trend, while readings below 20 indicate relatively weak or range-bound conditions.
ADX doesn't determine trend direction. Its accompanying positive directional indicator (+DI) and negative directional indicator (-DI) help assess whether bullish or bearish pressure dominates.
-
Bollinger Bands: Understanding Market Volatility
Bollinger Bands place upper and lower bands around a moving average, commonly using two standard deviations.
Standard deviation measures the dispersion of price data. Widening bands suggest increasing market volatility; narrowing bands indicate contraction.
Prices reaching the upper band may reflect an extended move, but they don't necessarily signal an immediate reversal.
The relationship between Bollinger Bands and Keltner Channels also demonstrates how different volatility calculations affect channel boundaries.
-
Average True Range (ATR): Measuring Price Fluctuations
The Average True Range measures the average true trading range over a specified period, commonly 14 candles.
A rising ATR indicates expanding price movements, while a falling ATR suggests quieter conditions.
Unlike momentum indicators, ATR doesn't identify bullish or bearish direction. It's especially useful for assessing stop-loss distance and position sizing.
-
On-Balance Volume (OBV): Confirming Price Trends
On-Balance Volume tracks cumulative trading volume by adding volume on higher-closing periods and subtracting it on lower-closing periods.
Volume represents the quantity of an asset traded during a specific period.
If prices rise alongside OBV, increasing participation may support the move. A divergence between price and OBV can signal weakening confirmation, although neither guarantees a reversal.
-
Volume Weighted Average Price (VWAP): Intraday Trading
The Volume Weighted Average Price calculates the average traded price weighted by volume, typically resetting each session.
Price above VWAP may indicate buyers are paying more than the session's volume-weighted average price.
VWAP is particularly useful for intraday trading. On continuously traded crypto markets, session boundaries depend on the chart configuration.
-
SuperTrend: Following Trend Direction
The SuperTrend indicator combines ATR with a price-based trend line.
A SuperTrend line below price commonly indicates bullish trend conditions; a line above price signals bearish conditions.
Its visual simplicity makes it appealing to beginners. The catch is that repeated direction changes can produce unreliable signals during sideways trading.
-
Ichimoku Cloud: Trend and Resistance Levels
The Ichimoku Cloud combines multiple price-based lines and a shaded cloud to assess trend direction, momentum, and potential support and resistance.
Price above the cloud generally indicates bullish market structure, while price below suggests bearish conditions.
It looks complicated initially, but the cloud gives traders a useful view of prevailing trends. Its projected levels remain calculations based on historical prices, not guaranteed future price targets.
How to Use Trading Indicators for Entry and Exit Points
Beginners should combine indicators measuring different aspects of market conditions instead of stacking tools that produce nearly identical signals.
Consider a trader evaluating Bitcoin on the Gate.com BTC/USDT spot market.
A possible setup could involve:
-
Trend: Price remains above a rising 50-period EMA.
-
Momentum: RSI rises above 50 without showing exhaustion.
-
Volume: Trading volume increases during a breakout above resistance.
-
Risk: ATR helps estimate an appropriate stop-loss distance.
These observations provide a framework, not an automatic buying signal.
Chart patterns add context. Head and shoulders formations may indicate bearish reversals, while double tops and double bottoms suggest potential turning points. Fibonacci retracement levels identify possible support and resistance areas around price swings.
The CME Group's support and resistance framework also emphasizes previous price highs, lows, and trendlines. Those principles apply when evaluating stock prices, cryptocurrencies, or oil prices.
Common Mistakes When Using Technical Analysis Indicators
The biggest beginner mistake is indicator overload. Several momentum indicators may produce similar buy or sell signals because they're calculated from overlapping price data.
Other problems include treating overbought readings as guaranteed reversals, ignoring market volatility, and changing indicator settings after every unsuccessful trade.
For swing trading, slower indicators can help filter noise. Intraday trading often requires faster signals, although these increase sensitivity to short-lived market movements.
Backtesting, paper trading, position sizing, and predefined exit rules remain essential parts of risk management.
Conclusion
The best technical indicators for beginners are those that answer specific trading questions without overwhelming the price chart. SMA and EMA identify trends, RSI and MACD evaluate momentum, OBV examines market participation, and ATR measures volatility.
Start with two or three complementary tools. Technical indicators describe historical market behaviour; they can't reliably forecast every future price movement.
FAQs
Which technical indicator should beginners learn first?
SMA is among the easiest indicators to understand because it displays the average closing price over a selected number of periods. RSI is another practical starting point for understanding market momentum.
What are the three most useful trading indicators?
EMA, RSI, and volume form a simple combination for trend direction, momentum, and participation. Their usefulness depends on trading style and market conditions.
Which indicator is best for intraday trading?
VWAP and short-period EMAs are commonly used for intraday trading. VWAP provides a session-based price benchmark, while EMAs respond to changes in recent prices.
Can technical indicators predict stock market movements?
No indicator can reliably predict future prices. Technical analysis uses historical market data to identify possible patterns and scenarios, which may fail when conditions change.
Is MACD better than RSI for beginners?
Neither is universally better. MACD highlights changes in trend momentum through moving average relationships, while RSI provides a bounded momentum reading that is often easier to interpret.
Disclaimer
This content is for educational purposes only and does not constitute investment or financial advice. Technical indicators can generate false signals, and past market behaviour does not guarantee future results. Trading involves the risk of financial loss. Product availability and applicable trading rules vary by jurisdiction.







