The indicator is most useful for traders judging intraday price action, entry and exit points, and execution quality. It isn't a prediction tool. Because VWAP is calculated from prices and volume already traded, it works better as a reference point for current market conditions than as a standalone signal of where price will move next.
Key Takeaways
-
VWAP combines price and trading volume to estimate the volume-weighted average price from the start of a trading session.
-
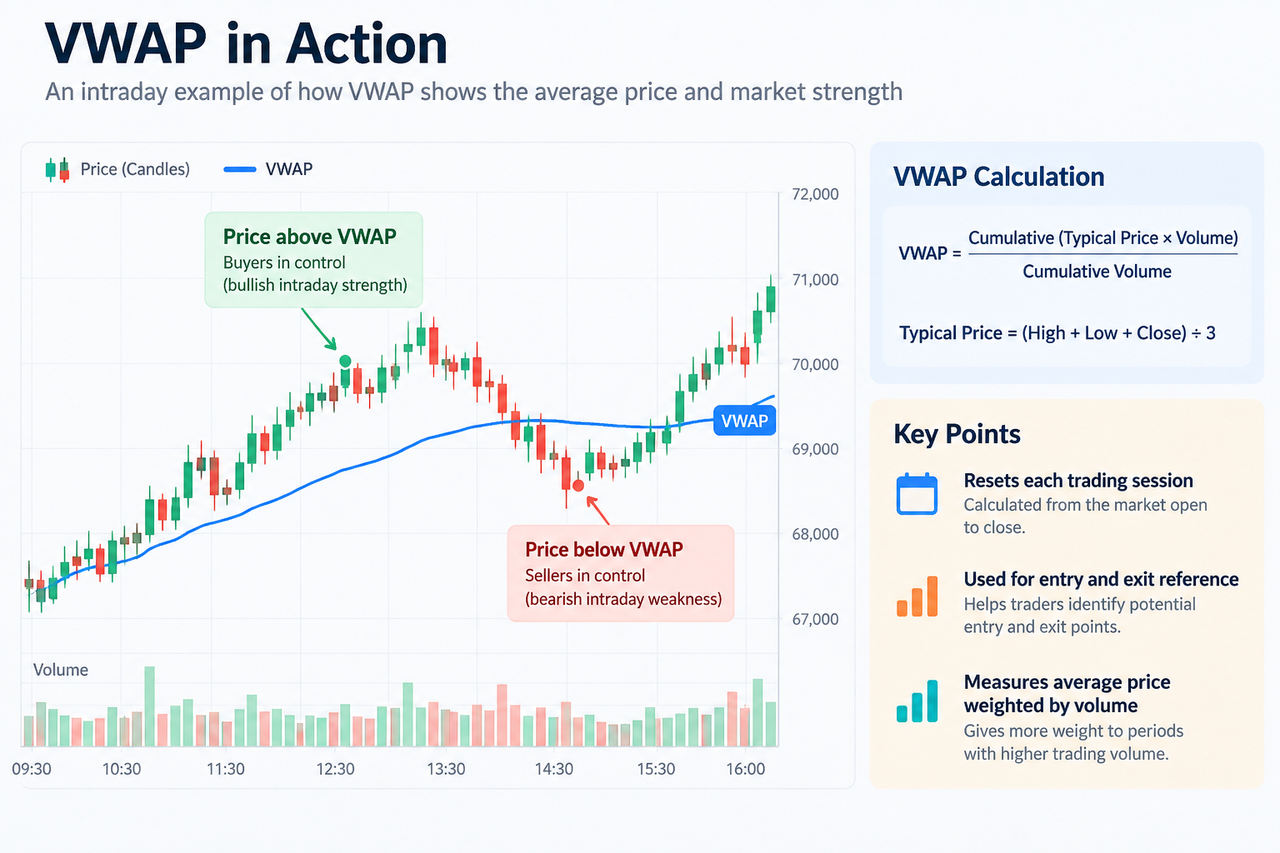
Price above VWAP is commonly interpreted as intraday strength, while price below VWAP suggests relative weakness.
-
VWAP can behave as dynamic support or resistance and help traders assess entry and exit points.
-
Institutional investors use VWAP as an execution benchmark, especially when large trades need to be spread across a session to reduce market impact.
-
VWAP resets for each trading session, unlike many moving averages that continue across days.
What Is VWAP Indicator and How Does It Show Average Price?
VWAP is a technical indicator that measures the average price paid for an asset, weighted by the amount of volume traded at each price. Instead of treating every observation equally, VWAP gives a larger influence to periods where more trading activity occurred.
That matters because a simple average may give the same importance to a quiet period and a period where a large share of the day's volume changed hands. VWAP reflects where more of the session's actual trading took place.
The basic calculation is:
VWAP = Cumulative (Typical Price × Period Volume) ÷ Cumulative Volume
Typical price is commonly calculated as:
Typical Price = (High + Low + Close) ÷ 3
Suppose a five-minute period has a typical price of $100 and volume of 1,000 units, while the next period has a typical price of $102 and volume of 4,000 units. The second period has four times the influence on VWAP because four times as much volume traded there.
VWAP is then recalculated as new intraday data arrives, so the line changes continuously throughout the trading day.
How VWAP Works in Intraday Trading
Traditional VWAP starts accumulating data at the beginning of a trading session and normally resets when the next session begins. For markets with defined opening and closing hours, that creates a clear daily reference.
Crypto trades 24/7, so charting platforms need a defined session boundary for calculating intraday VWAP. Traders should check the platform's session and timezone settings rather than assume every VWAP implementation resets at the same moment.
A useful interpretation framework is straightforward:
| Price Position |
Common Intraday Interpretation |
| Price above VWAP |
Buyers have maintained prices above the session's volume-weighted average |
| Price below VWAP |
Sellers have pushed price below the session's volume-weighted average |
| Price near VWAP |
Market is trading close to its session average |
| VWAP rising |
Volume-weighted average transaction price is increasing |
| Falling VWAP line |
Volume-weighted average transaction price is declining |
These are reference signals, not guarantees. Price can cross VWAP repeatedly during sideways or volatile trading.
Is VWAP a Measure of Intraday Market Value?
VWAP is often treated as an intraday fair-value reference because it shows the average price weighted by where actual volume occurred. It therefore gives traders more context than simply comparing the current price with the day's opening price.
For example, if BTC trades above VWAP for most of a session and pullbacks repeatedly stabilize around the VWAP line, traders may interpret the line as dynamic support. Below VWAP, the same area can act as dynamic resistance.
A trader using the BTC/USDT market on Gate.com can compare the current price chart with intraday volume rather than evaluating price movement in isolation. The goal isn't to assume every VWAP touch will reverse price, but to see whether trading activity supports the apparent market direction.
Volume can also be examined separately. On-Balance Volume accumulates volume according to whether price closes higher or lower, making it useful when a trader wants to compare VWAP's price-volume benchmark with broader buying or selling pressure.
How Traders Use VWAP for Entry and Exit Points
VWAP trading strategies generally revolve around the relationship between the current price and the VWAP line.
In a strong intraday uptrend, some traders look for price to remain above VWAP and treat a controlled pullback toward it as a possible reference point for a long position. A profit target or exit point still needs a separate basis, such as price structure, resistance, volatility, or risk-to-reward rules.
A bearish setup reverses that logic. If price remains below VWAP and rebounds toward the line before being rejected, traders may interpret VWAP as resistance. Short selling introduces additional risks and isn't appropriate simply because the price falls below one indicator.
VWAP can also be paired with volatility tools. Bollinger %B measures where price sits relative to the Bollinger Bands, while the Average True Range indicator measures volatility rather than direction. Those tools answer different questions from VWAP and can help prevent one price-line interaction from being treated as a complete trading strategy.
Why Institutional Investors Use VWAP
Institutional traders, hedge funds, and other large market participants often care about execution price because a large order can itself move the market. Breaking a large trade into smaller stock trades or crypto orders throughout a time period may reduce market impact compared with immediately demanding all available liquidity.
VWAP provides a reference point for evaluating that execution. If an institution buying throughout a session achieves an average price close to or below the relevant VWAP, the execution may compare favorably with the market's volume-weighted average during that period. For a seller, the interpretation is reversed.
VWAP's role as a market benchmark isn't limited to chart analysis. CME Group uses volume-weighted average prices in several fixing-price methodologies, while FINRA's trade-reporting guidance recognizes published end-of-day VWAP as one price that may determine transaction terms.
Execution quality itself involves more than VWAP. The U.S. Securities and Exchange Commission's execution-quality information discusses factors such as execution prices, public quotes, effective spreads, and price improvement.
VWAP vs. Moving Averages: Which Time Frame Matters?
VWAP and moving averages may look similar on a price chart, but their calculations answer different questions.
A Simple Moving Average gives equal weight to the selected price observations over a specified number of periods. VWAP weights prices according to period volume and normally accumulates from a session starting point.
That makes VWAP primarily an intraday indicator. An SMA can be used on five-minute, hourly, daily, or weekly charts and continue rolling from one period to another.
| Feature |
VWAP |
SMA |
| Main input |
Price + volume |
Price |
| Weighting |
Higher-volume periods matter more |
Each period has equal weight |
| Typical use |
Intraday trading |
Short- to long-term trend analysis |
| Reset |
Usually each session |
No daily reset |
| Main question |
Where has volume-weighted trading occurred? |
What is the average price over N periods? |
Neither is inherently more accurate. They measure different things.
Anchored VWAP vs. Standard Intraday VWAP
Anchored VWAP uses the same basic price-and-volume concept but starts the cumulative calculation from a selected event or date rather than automatically beginning with the current trading session.
A trader might anchor VWAP to a major swing high, swing low, breakout, earnings event in stocks, or another meaningful market event. Standard intraday VWAP, by contrast, is designed to describe the current session.
Anchored VWAP can therefore extend across several trading days. Its usefulness depends heavily on whether the chosen anchor actually matters to market participants.
Limitations of VWAP Trading Strategies
VWAP is backward-looking. Every value is calculated from price and total volume already recorded, so it cannot predict the next price movement.
Lag also increases as a session develops because more observations enter the cumulative total. A sharp late-session move may have less effect on VWAP than the same move shortly after the market opens.
Low liquidity is another problem. In thin markets, a small number of large trades can distort the weighted average price. VWAP tends to be more informative where trading volume and the asset's liquidity are sufficient to produce a representative sample of transactions.
Most importantly, trading above VWAP doesn't guarantee that price will continue rising, and trading below VWAP doesn't confirm that a decline will continue. Combining price structure with indicators such as Pivot Points can provide additional support and resistance context.
Conclusion
VWAP shows the average price at which trading activity has occurred during a session after weighting each period by its volume. For day trading, its strongest use is as an intraday reference point for market control, dynamic support and resistance, entry and exit planning, and execution quality.
The bottom line is that VWAP describes where the market has traded, not where it must go next. Day traders and institutional investors can use it to put the current price into context, but price action, liquidity, volatility, risk controls, and other indicators still matter.
FAQ
Is VWAP bullish or bearish?
VWAP itself isn't bullish or bearish. Price consistently above VWAP is commonly interpreted as stronger intraday buying conditions, while price below VWAP can indicate stronger selling conditions. Frequent crossings usually suggest a less decisive market.
Does VWAP reset every day?
Standard VWAP normally resets when a new trading session starts. Because crypto markets run continuously, the exact reset point depends on how the charting platform defines the trading day or session.
Is VWAP better than a moving average?
Neither is universally better. VWAP uses both price and volume and is mainly suited to intraday analysis, while moving averages such as SMA or EMA can measure price trends over many different time frames.
Can VWAP be used for entry and exit points?
Yes, traders often use VWAP as one reference for entries and exits, especially when price reacts around it as dynamic support or resistance. A VWAP signal should generally be evaluated alongside price structure, volume, volatility, and risk management.
What does a falling VWAP line mean?
A falling VWAP line means the session's cumulative volume-weighted average price is declining. It can support a bearish intraday interpretation, but it doesn't prove sellers will remain in control.
What is the difference between VWAP and anchored VWAP?
Standard intraday VWAP generally starts at the beginning of the current session and resets for the next one. Anchored VWAP starts from a trader-selected event, price point, or date and can continue across multiple sessions.
Disclaimer: This content is for educational purposes only and does not constitute financial or investment advice. Technical indicators use historical market data and cannot guarantee future price movements.







