











$XBRUSD $XTIUSD
#USIranMediationPressuresOil
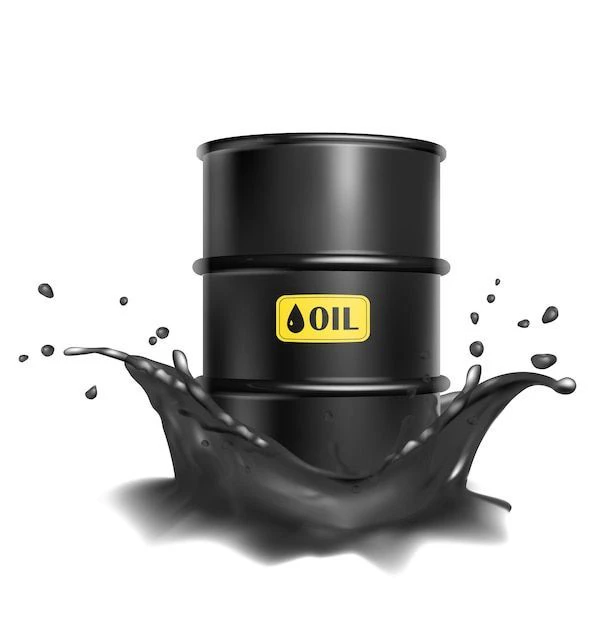
Oil markets are caught between supply concerns fueled by geopolitical tensions and weakening global demand. Brent crude recently approached the $112 mark—testing a five-month high—before pulling back. Meanwhile, West Texas Intermediate (WTI) is trading in the $100 range. This volatility suggests that the market is attempting to find a balance between two opposing forces.
The supply side: Sanctions and disruptions
A primary factor supporting upward price movement is the tightening of U.S. policy toward Iran. Following Iranian attacks on tankers in the Strait of Hormuz, the U.S. reimposed a blockade on Iranian oil exports, and the Treasury Department’s Office of Foreign Assets Control (OFAC) announced a new package of sanctions targeting Iran’s economy and oil interests. These measures are expected to constrain both Iran’s exports and its production.
The Energy Information Administration’s (EIA) October report quantifies this supply crunch. The EIA estimates that unplanned crude oil disruptions among OPEC nations rose to 8.80 million barrels per day in August 2026—a significant increase from the 6.90 million barrels per day recorded in July. While rising supply from non-OPEC producers has helped cap prices, these mounting disruptions are offsetting some of that downward pressure.
The demand side: Downward revisions to expectations
Despite this supply-side tightness, the global demand outlook is preventing a one-sided surge in prices. According to the EIA’s September forecasts, global liquid fuel consumption in 2026 is expected to reach 102.59 million barrels per day. This figure represents a decline of approximately 1.69 million barrels per day compared to 2025. Consumption forecasts for both OECD and non-OECD countries have been revised downward. Weaker demand growth is exerting pressure on medium-term prices, setting the stage for the market to fluctuate within the $105–$115 range.
Geopolitical diplomacy and market response
Another factor influencing prices is the indirect negotiations between the U.S. and Iran. A proposal—mediated by Pakistan and granted preliminary approval by Iran—includes provisions regarding interest on frozen Iranian funds. This diplomatic activity sparked expectations that the risk of supply disruptions might ease, leading to a brief pullback in prices. However, as uncertainty surrounding the negotiations persists, this effect has not proven lasting.
Technical indicators and price levels
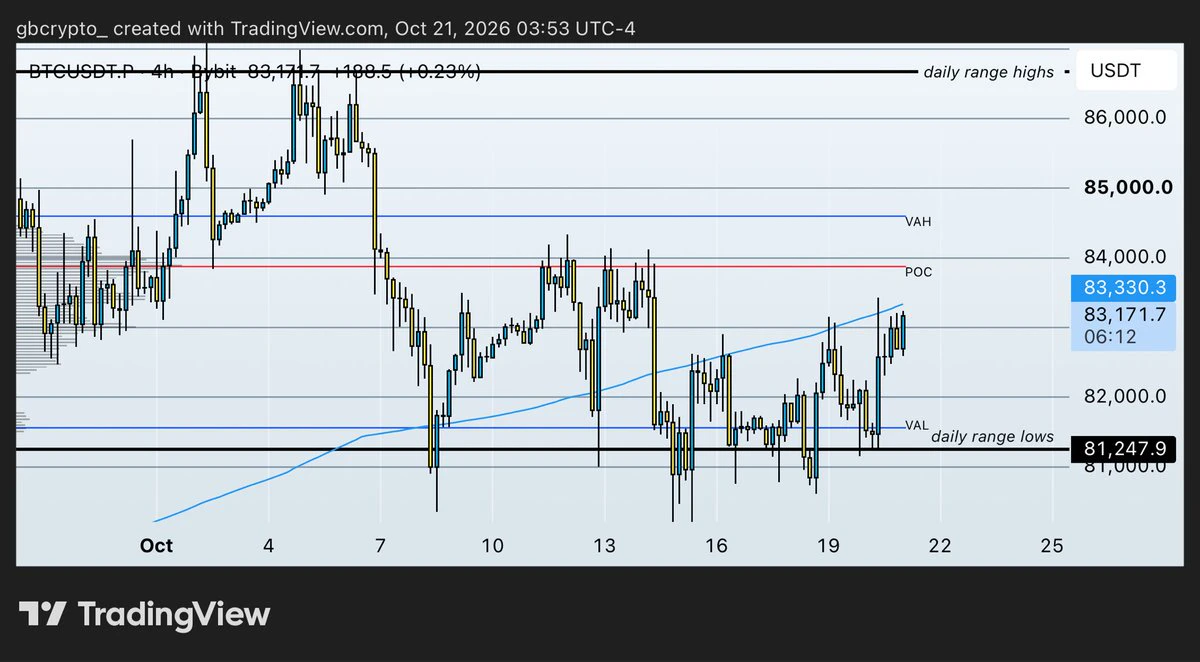
Looking at the charts, Brent crude has encountered resistance at the $113.52 level. A breakout above this point could accelerate upward momentum. On the downside, the $107.72 level serves as the first significant support. For WTI, the $102.49 level acts as resistance, while $96.93 serves as support. Both indicators confirm that prices are confined to a narrow range, struggling to establish a clear direction. Risks and factors to monitor
The current balance of risk in the market hinges on whether the sanctions will effectively lead to a decline in Iranian crude oil shipments. Should the sanctions prove ineffective, or should the risks surrounding the Strait of Hormuz subside, the risk premium currently embedded in prices could rapidly dissipate. Conversely, an upward revision to supply-disruption forecasts—such as those seen in the EIA’s October report—or robust import data from major consuming nations could help alleviate downward pressure stemming from demand-side concerns. Key developments to watch in the coming days include the efficacy with which the sanctions are implemented, the progression of diplomatic efforts, and any new data released regarding demand.
This text does not constitute investment advice.
#USIranMediationPressuresOil
Oil markets are caught between supply concerns fueled by geopolitical tensions and weakening global demand. Brent crude recently approached the $112 mark—testing a five-month high—before pulling back. Meanwhile, West Texas Intermediate (WTI) is trading in the $100 range. This volatility suggests that the market is attempting to find a balance between two opposing forces.
The supply side: Sanctions and disruptions
A primary factor supporting upward price movement is the tightening of U.S. policy toward Iran. Following Iranian attacks on tankers in the Strait of Hormuz, the U.S. reimposed a blockade on Iranian oil exports, and the Treasury Department’s Office of Foreign Assets Control (OFAC) announced a new package of sanctions targeting Iran’s economy and oil interests. These measures are expected to constrain both Iran’s exports and its production.
The Energy Information Administration’s (EIA) October report quantifies this supply crunch. The EIA estimates that unplanned crude oil disruptions among OPEC nations rose to 8.80 million barrels per day in August 2026—a significant increase from the 6.90 million barrels per day recorded in July. While rising supply from non-OPEC producers has helped cap prices, these mounting disruptions are offsetting some of that downward pressure.
The demand side: Downward revisions to expectations
Despite this supply-side tightness, the global demand outlook is preventing a one-sided surge in prices. According to the EIA’s September forecasts, global liquid fuel consumption in 2026 is expected to reach 102.59 million barrels per day. This figure represents a decline of approximately 1.69 million barrels per day compared to 2025. Consumption forecasts for both OECD and non-OECD countries have been revised downward. Weaker demand growth is exerting pressure on medium-term prices, setting the stage for the market to fluctuate within the $105–$115 range.
Geopolitical diplomacy and market response
Another factor influencing prices is the indirect negotiations between the U.S. and Iran. A proposal—mediated by Pakistan and granted preliminary approval by Iran—includes provisions regarding interest on frozen Iranian funds. This diplomatic activity sparked expectations that the risk of supply disruptions might ease, leading to a brief pullback in prices. However, as uncertainty surrounding the negotiations persists, this effect has not proven lasting.
Technical indicators and price levels
Looking at the charts, Brent crude has encountered resistance at the $113.52 level. A breakout above this point could accelerate upward momentum. On the downside, the $107.72 level serves as the first significant support. For WTI, the $102.49 level acts as resistance, while $96.93 serves as support. Both indicators confirm that prices are confined to a narrow range, struggling to establish a clear direction. Risks and factors to monitor
The current balance of risk in the market hinges on whether the sanctions will effectively lead to a decline in Iranian crude oil shipments. Should the sanctions prove ineffective, or should the risks surrounding the Strait of Hormuz subside, the risk premium currently embedded in prices could rapidly dissipate. Conversely, an upward revision to supply-disruption forecasts—such as those seen in the EIA’s October report—or robust import data from major consuming nations could help alleviate downward pressure stemming from demand-side concerns. Key developments to watch in the coming days include the efficacy with which the sanctions are implemented, the progression of diplomatic efforts, and any new data released regarding demand.
This text does not constitute investment advice.