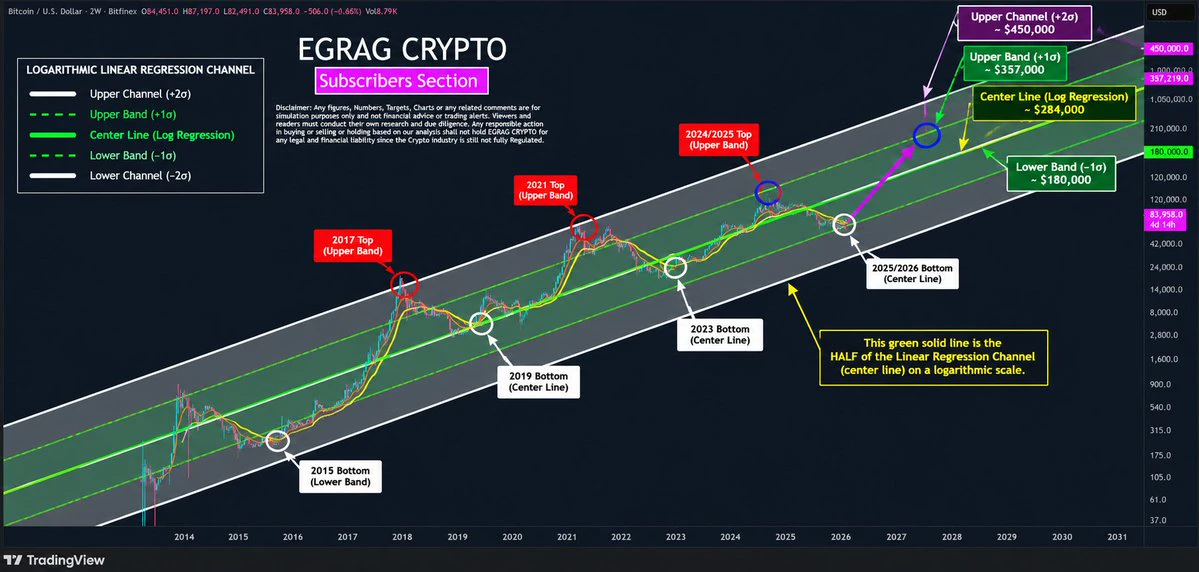
EGRAGCRYPTO

vip
Active for: 1.3y
Peak Tier 0
No content yet
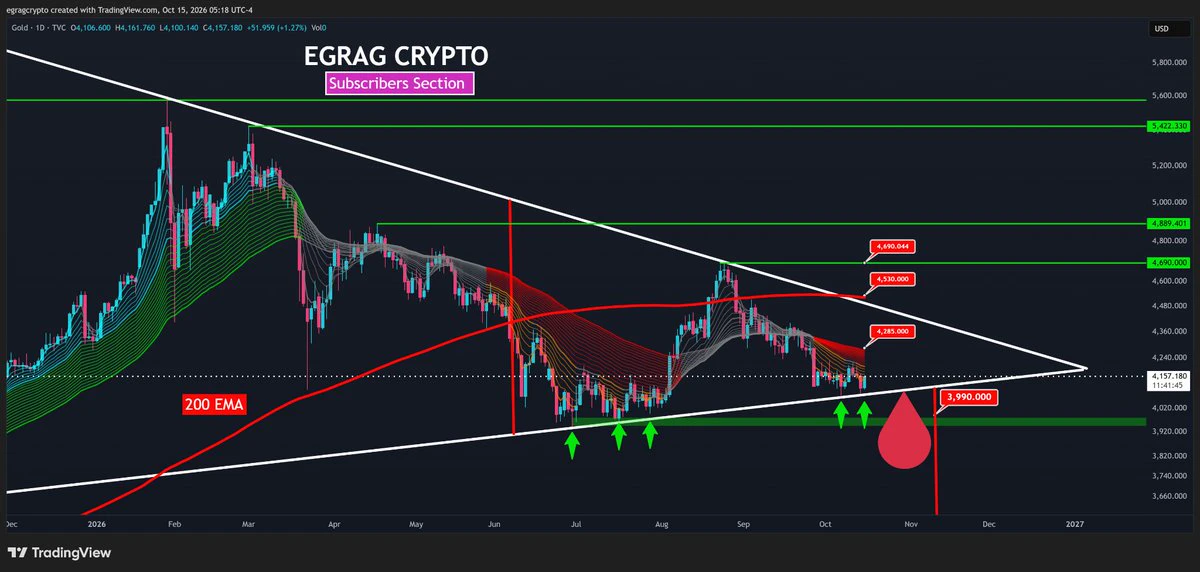
$GOLD - MY MACRO TRADE HAS FLIPPED 🥇:
I’m not trading $Gold day-to-day. This is a MACRO setup.
🪙My roadmap: $4,380–$4,550 → potential Wave 2 top.
🪙But remember this number: $4,550
🪙A decisive monthly close above $4,550 invalidates my bearish thesis and tells me something much bigger is happening, potentially deeper financial instability and serious pressure on risk-on assets.
🪙If $4,550 rejects:
🥇$3,850 → $3,455 → EMA ribbon near $3,400 → eventually $2,500–$2,000.
🥇Many Moons Back , when $Gold was near $1,600, I was calling for $3,500–$4,000.
🥇Now I’m out. I will look to accumulate ag
post-image
  • Reward
  • 1
  • Repost
  • Share
lisaXrex:
The combination of workload-weighted issuance and a rollback mechanism is much more solid than a pure airdrop narrative.
#BTC – The Bearish Cross Marks the Bottoming Window ⚔️
On the 2-Month timeframe, $BTC has repeated the same behavior across multiple cycles.
The Bearish Cross has never marked the exact bottom, it has consistently defined the bottoming window, with the final low arriving 60–180 days later.
📍 Key Levels:
🟥 $51K–$42K → Macro bottom range
🟨 $74K → The most important reclaim level
⬜️ Above $74K → Strong probability the bottom is already in
🟩 Above $96K → Opens the path toward $180K–$216K (Fib 1.414–1.618)
📍My focus remains simple:
▫️The Bearish Cross signals timing, not the exact price bottom
BTC0.52%
post-image
  • Reward
  • Comment
  • 1
  • Share
#XRP 3-Day - Symmetrical Triangle Chart - Do you still remembered it:
💡As you can see that the bearish roadmap has largely played out in this Chart:
👉Multiple gravestone doji rejections
👉Breakdown below the triangle structure
👉Continued compression near $1.05
👉A developing base rather than a confirmed reversal
At this stage, $1.05 is support, but not confirmation.
The key sequence is:
▫️Above $1.11 → first sign of strength
▫️Above $1.21 → momentum improves
▫️Above $1.28–$1.30 → structure begins to shift
▫️Above $1.38 → stronger recovery signal
▫️Full-body 3-day close above $1.50–$1.51
XRP-2.10%
post-image
  • Reward
  • Comment
  • Repost
  • Share
#GOLD – Relief Rally Before the Real Damage? ⚠️:
$Gold has not retested its 21-month EMA since the 2024 breakout.
After four bearish monthly candles, the current rebound may be Wave 2 relief, not a new bullish impulse.
📍 Key upside zone:
🟡 $4,380–$4,550
🟠 Extension: $4,885–$5,030
A rejection there could trigger Wave 3, potentially breaking $3,455 and targeting roughly $2,390.
The projected roadmap:
▫️Wave 2 rally → Wave 3 toward $2,390 → Wave 4 near $3,500 → Wave 5 toward $2,000–$2,150
▫️A monthly breakout above $5,030–$5,570 would weaken this bearish count.
▫️This would not necessarily end
post-image
  • Reward
  • Comment
  • Repost
  • Share
$Oil Monthly Analysis - $70 War or Deal ⁉️:
$Oil is retesting a major long-term trend line near $70–$76, making this a critical macro pivot.
🐂Bullish scenario:
A strong monthly hold above the trend line could trigger a large measured move toward $110–$160. Such a move would likely require a major supply shock, geopolitical escalation, or renewed inflationary pressure.
🐻Bearish scenario:
A decisive monthly close below $70 would confirm structural weakness and could open the path toward:
▫️$55
▫️$39
▫️Potential measured target near $33
💡The RSI bounce shows short-term momentum has improved
post-image
  • Reward
  • Comment
  • Repost
  • Share
#GOLD – The Breakdown That Could Ignite Risk Assets 🔥
$Gold respected its rising channel from 2024 until July 2026 but that structure has now broken.
Two scenarios:
🟡 Reclaim the channel + close above the 21 EMA → False breakdown and another push toward $4,800
🔻 Fail to reclaim → Opens the door toward $3,900, then the $3,455 gap
💡The bigger picture matters more.
💡 $Gold may be starting a 1–2 year macro retest of the major 2020–2024 breakout zone.
💡That would not necessarily end gold’s long-term bull market.
💡It could signal something bigger:
👉Capital rotating from risk-off assets into
XAU2.13%
post-image
  • Reward
  • 10
  • 3
  • Share
ReX:
could signal something bigger:
👉Capital rotating from risk-off assets
View More
#XRP 3-Day Analysis - Wave 3 Setup Is Developing:
🟣The chart is showing a potentially important bullish divergence:
▫️Price is forming a lower low
▫️RSI is forming a higher low
🟣That suggests downside momentum is weakening, even while price remains under pressure.
🟣From an Elliott Wave perspective, the cleaner interpretation is that $XRP may be finishing Wave 2.
🟣Wave 3 becomes confirmed only after price breaks the corrective structure and reclaims the major resistance cluster.
🟣Key levels: The chart highlights a major support region around:
▫️$1.00–$0.95
▫️$0.75
▫️$0.60–$0.52 as deeper
XRP-2.10%
post-image
  • Reward
  • Comment
  • Repost
  • Share
#BTC 3-Day Analysis - The Bullish Divergence Is the Key:
🟠 $BTC is showing a strong bullish divergence on the 3-day chart.
🟠Price is forming a lower or similar low, while the RSI is producing a higher low.
🟠That suggests Bullish momentum is strengthening even if price makes one more dip toward the yellow trend line.
🟠The next confirmation sequence is:
🔸 $RSI reclaims its moving average → $BTC holds the divergence → Price breaks $83K
🔸A sustained move above $83K would confirm a higher high in price and strengthen the case that the bottom is already behind us.
🔸The major structural leve
BTC0.52%
post-image
  • Reward
  • Comment
  • Repost
  • Share
🧠 AI + Open Finance: Powerful Synergy, Serious Trade-Offs
Open Finance gives AI the data infrastructure to deliver hyper-personalized financial services. AI, in return, unlocks the value of shared financial data driving innovation, inclusion, and lower costs.
But the combination also amplifies major risks:
📌 Bias and discrimination
📌 Weak transparency
📌 Loss of consumer control over data
📌 Dependence on Big Tech
📌 Over-reliance on autonomous AI agents
Agentic AI could eventually manage finances 24/7, improve retail investor access, and reduce costs but without strong governance, it may a
  • Reward
  • Comment
  • Repost
  • Share
#XRP – The Diamond Is Closing 💎:
The monthly Diamond Pattern is approaching its decision point.
📍 The 33 EMA and 50 SMA are converging right at the apex—just like previous cycle bottoms.
A confirmed breakout could ignite the next macro expansion, while a rejection keeps XRP inside the final accumulation phase.
The Diamond is closing... and so is the window for this cycle's biggest move. 🚀
Structure> Noise > Opinion. ONLY FEW
XRP-2.10%
  • Reward
  • Comment
  • Repost
  • Share
#BTC – Support Ladder Is Under Pressure ⚠️:
#BTC is now testing one of its most important macro zones.
The monthly structure is defined by three major averages:
🟢 33 EMA: Momentum confirmation
🔵 50 SMA: Current battlefield
🟣 77 SMA: Final macro defense
⚪️ $BTC is trading below the 33 EMA and testing the 50 SMA.
🐂The bullish path is clear:
▫️Hold the 50 SMA → Reclaim the 33 EMA → Confirm the macro reversal
▫️But a decisive monthly close below the 50 SMA could send BTC toward the 77 SMA near $51K.
▫️For now, this is not a confirmed bottom.
▫️It is a macro support test.
💡The 50 SMA decides
BTC0.52%
post-image
  • Reward
  • Comment
  • Repost
  • Share
🇺🇸 (24 July) U.S. Department of State📖 Generative AI Playbook
📌 Establish clear foundational data and AI strategies first.
Ensure alignment of priorities and principles, providing a shared direction that enables coordinated and safe adoption across a large Department of State without constraining mission-specific execution.
📌 Build the right organizational structures.
A dedicated innovation hub, like DT/CfA, and a cross-functional implementation model, like the “campaign” model, enable teams to develop technology and policy in parallel while learning through experimentation.
📌 Start smal
post-image
  • Reward
  • Comment
  • Repost
  • Share
#XRP – The $1.05 Battlefield ⚔️:
$XRP is defending the $1.048–$1.05 support zone on the 4H chart, but the structure remains bearish with a sequence of lower highs.
The confirmation path is simple:
Hold $1.05 → Reclaim $1.083 → Break and retest $1.10
A 4H close above $1.10 opens the door toward:
🎯 $1.14
🎯 $1.183
🎯 $1.20
🎯 $1.30-Major Price Target Make it or major rejection.
But losing $1.048 could send $XRP toward the major liquidity zone around $1.008–$1.00.
For now, $1.05 is the battlefield and $1.10 is the confirmation.
XRP-2.10%
  • Reward
  • Comment
  • Repost
  • Share
#BTC - The Four-Year Cycle or the “Box of Hell”? 🔥:
This monthly chart presents two major macro scenarios:
1⃣If the white moving average near $51K holds as the cycle bottom, Bitcoin’s four-year cycle remains crystal clear.
▫️Buy the cycle bottom.
▫️Sell the cycle top.
▫️Ignore the noise.
2⃣But if $BTC loses the white MA and bottoms around the light-blue MA, that would create what I call a minor structural fracture.
That fracture could lead to:
➡️ A powerful rally toward $200K
➡️ An irregular or expanded ABC correction
➡️ A future collapse into the “Box of Hell” near $29K
➡️ A dot-com-style re
BTC0.52%
post-image
  • Reward
  • Comment
  • Repost
  • Share
#XRP - 5 Color Code ( 🟢🔴🟡⚪️🔵):
Structure > Noise. ONLY FEW 🧠
XRP-2.10%
post-image
  • Reward
  • Comment
  • Repost
  • Share
#Crypto The Most Beautiful Strong Bearish Divergence:
This is USDT Dominance + USDC Dominance on the weekly timeframe.
Price is pushing higher, while momentum is forming a clear strong bearish divergence. If confirmed, stablecoin dominance could begin declining, meaning capital may rotate back into $BTC and $altcoins.
The 9.3% zone remains the key support. Lose it, and the crypto market could accelerate sharply.
💡If you know, you know.
💡If you do not, keep learning and studying.
💡We are waiting for crypto to pump. Wait for it.
USDC-0.01%
BTC0.52%
post-image
  • Reward
  • Comment
  • Repost
  • Share
#TOTAL - Bottom One vs Bottom Two 🧠:
The macro sequence remains consistent:
🔻 9 EMA crosses below the 21 EMA
🔻 Price retraces toward or closes below the 50 EMA
1️⃣ Bottom One forms
2️⃣ Bottom Two follows
3⃣ Then the major expansion begins
Previous cycles gave us:
🏳️Cycle 1: Higher low
🏳️ Cycle 2: Equal low
🏳️Current cycle: Lower low so far
🏳️Can we move slightly lower? Absolutely.
🏳️But that does not destroy the bullish structure, it may complete it.
💡The bottom is not one candle. The bottom is a process.
📒 The bearish cross already happened.
📒Now we may simply be waiting for Bott
post-image
  • Reward
  • 5
  • Repost
  • Share
Boss_Yadi:
Carefully observe 🔍
View More
#BTC - “This Time Is Different” Is the Most Dangerous Phrase ⏳:
$BTC previous macro bottoms arrived roughly 800–1,000 days after each halving:
1⃣2012 → 1,003 days
2⃣2016 → 973 days
3⃣2020 → 914 days
If history rhymes again, late 2026 remains a major bottoming window.
$BTC is also approaching the monthly 50 SMA–88 SMA zone, where previous cycle bottoms developed.
Many will say: “This time is different.” Maybe.
But until price and time prove otherwise, I will respect the cycle, not the narrative.
Price shows us where. Time shows us when. 📊
STRUCTURE > NOISE > OPINIONS > IDEAS. ONLY FEW 🧠
BTC0.52%
post-image
  • Reward
  • Comment
  • Repost
  • Share
  • Pinned