Square
Following
Hot
News
Profile

GB

vip
Active for: 1.4y
Peak Tier 0
No content yet
0
Following
40
Followers
148
Liked
Looking at a potential entry here on $CASHCAT - trading into support + trend-line support. Clean Invals being a loss of both levels.
post-image
CASHCAT-1.60%
$BONK
259 days respecting this trend-line as resistance but now on the weekly it looks like price is breaking out. A weekly close here could begin the breakout + shift in market structure.
post-image
BONK+11.38%
So, where next for $BTC now that we’ve finally reached my yearly open target?
If Bitcoin follows a similar path to the previous cycle, when price reclaimed and closed above the weekly 50 MA after a prolonged downtrend, I’d expect further upside in the short term, although potentially at a less aggressive pace than the most recent move.
From there, I’d be watching for the first meaningful pullback towards the weekly 12/21 EMA before potentially entering the next expansion phase to the upside.
The weekly 12/21 EMA currently sits around 73.8K–75.2K, although this range will naturally continue to
post-image
BTC-0.56%
Close eyes on $BONK here. Very early signs of a potential breakout from this higher time frame trend line resistance.
post-image
BONK+11.38%
$BTC is now just 7 hours away from closing above the final major resistance level before we can more or less confirm a significant shift in market structure.
The Weekly 50 MA remains one of the most important levels of confluence when determining whether we’re operating within a broader bear or bull market structure.
The last time BTC spent a significant period trading below this level was during the previous bear market. Price reclaimed it with a weekly close in March 2023 and the rest is history.
We’re now approaching a very similar inflection point.
Things are starting to look good. Very go
BTC-0.56%
Some $ALTS I’m watching for potential continuation setups:
$CAKE
$UNI
$HYPE
$NEAR
All four are showing significant strength with little indication of a meaningful slowdown in upside momentum.
These aren’t necessarily the type of setups I typically look to trade (I prefer trading ranges), but if $BTC is preparing for another leg higher, these could offer some of the stronger percentage moves.
That said, invalidations will need to be strict and tight as there is a lot of air locally under these charts.
I’ll be sharing the charts later with the specific levels and potential setups I’m watching.
CAKE+3.88%
UNI+11.76%
HYPE-0.18%
BTC-0.56%
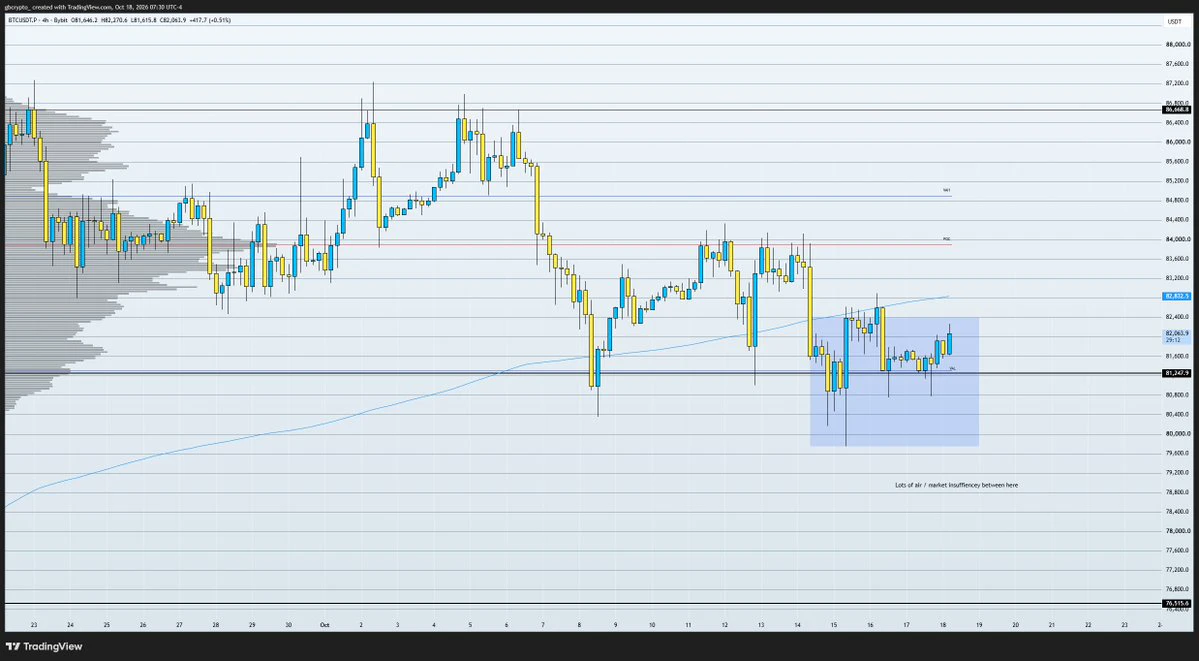
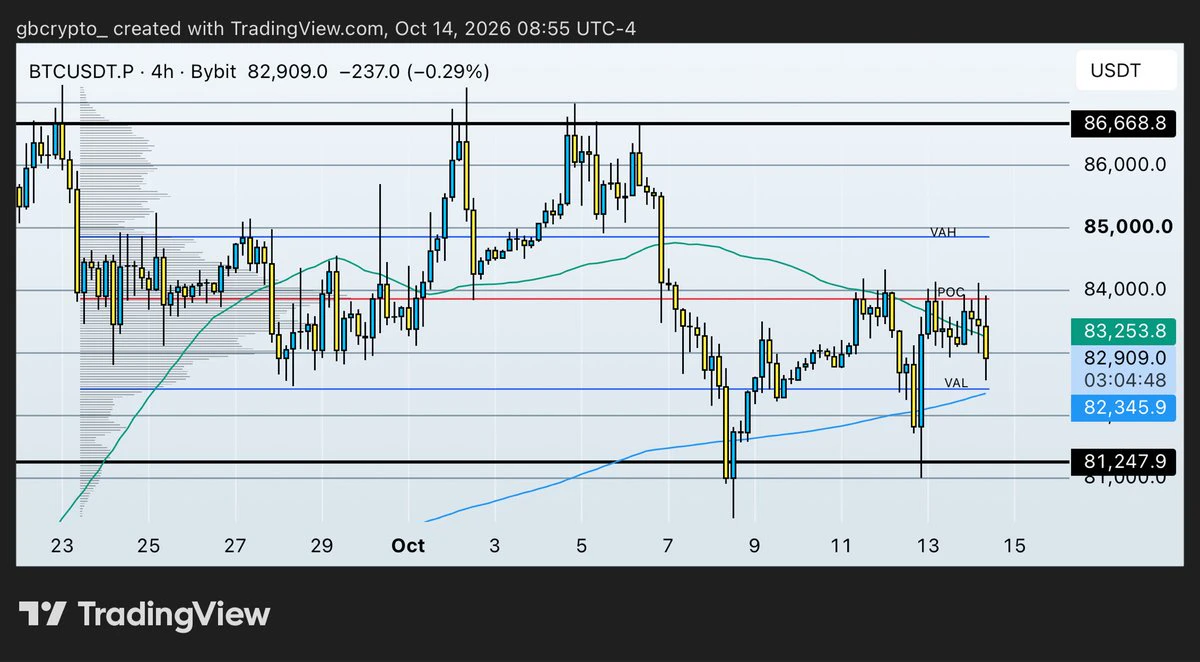
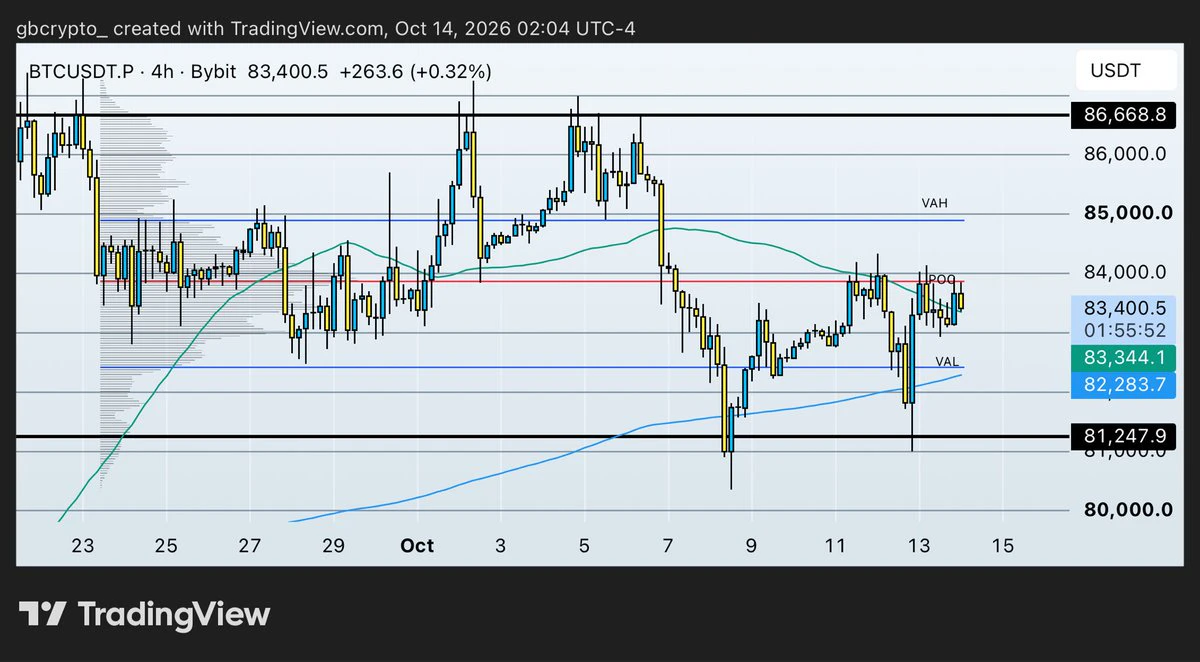
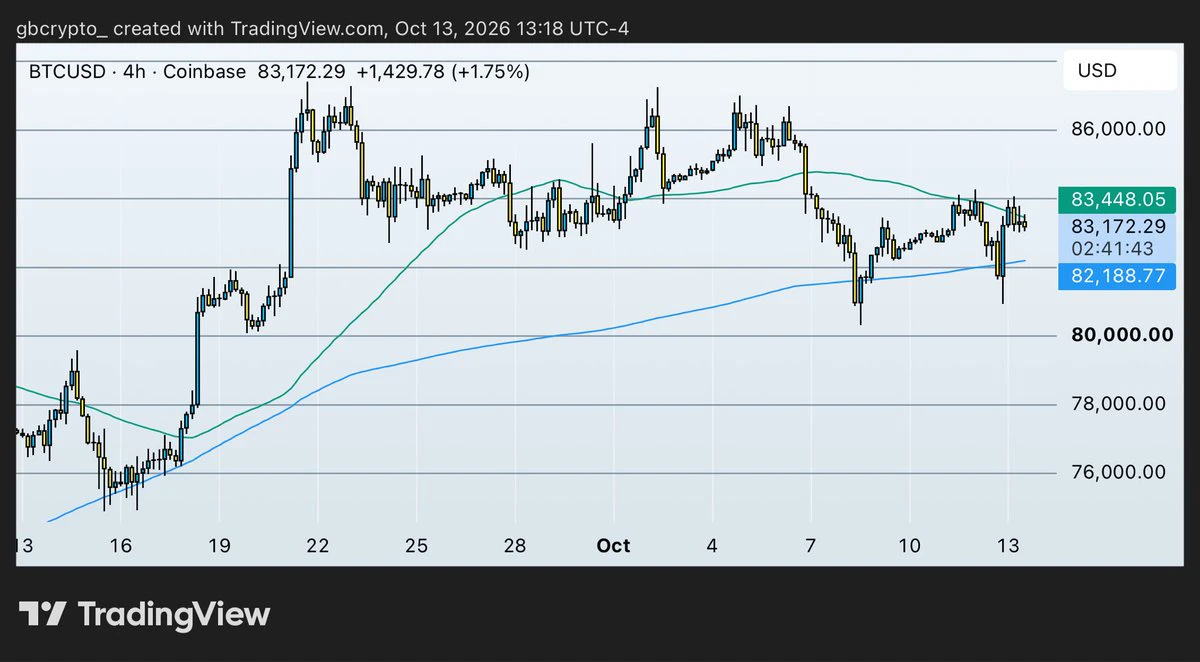
$BTC H4
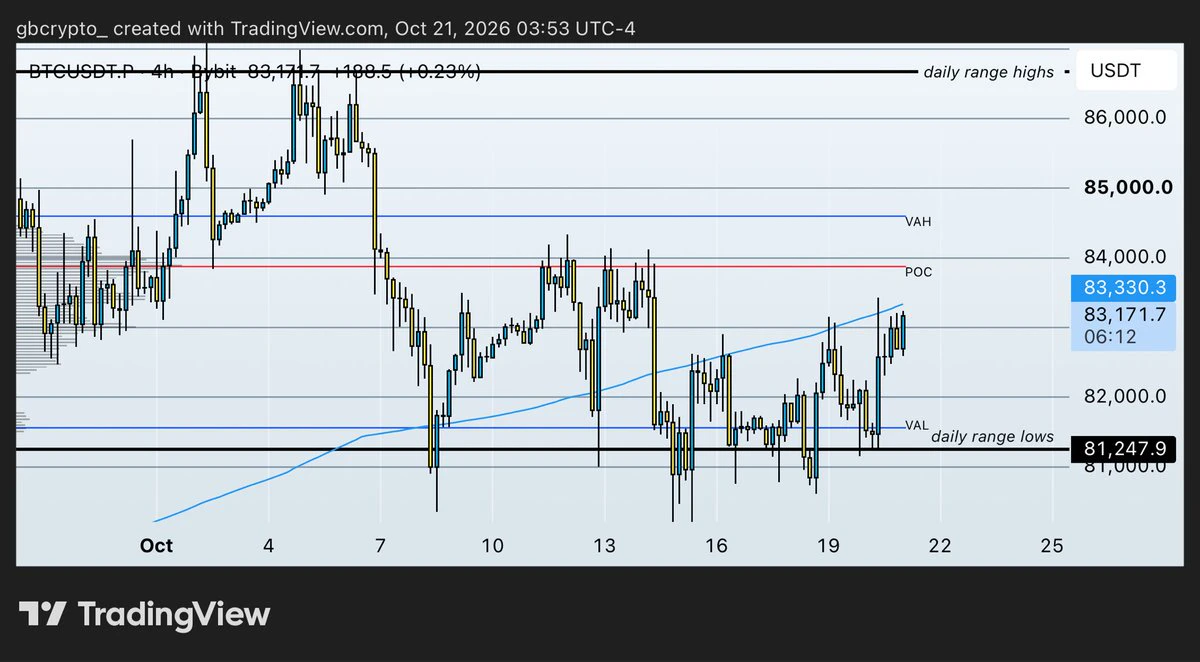
Each time price has rallied into this local supply zone, we’ve subsequently seen a move back towards the Value Area Low.
This time, however, the structure could be different.
The H4 200 MA has proven to be a respected support/resistance level, and it now sits above the value area lows and within the current Value Area.
Therefore, if price loses the value area highs at 79.9K, our next downside target would be the H4 200 MA, currently around 77.3K. A move into this area could potentially present some dip-buying opportunities across $ALTS.
That said, the key factor will be acceptance. If
BTC-0.56%
$BTC
Basically, buy the H4 200MA dip until that level is lost (if it even loses it)
Price hasn’t closed under there since the first half of August.
post-image
BTC-0.56%
We’ve been performing well across mid- and large-cap alts, identifying and capturing some strong moves.
Where we’ve fallen short is the micro-cap space. We’ve missed a number of opportunities due to poor execution and timing.
That needs to change.
The focus now is on improving execution, being more proactive with high-conviction setups, and making sure we’re positioned when the next opportunities emerge.
$BTC
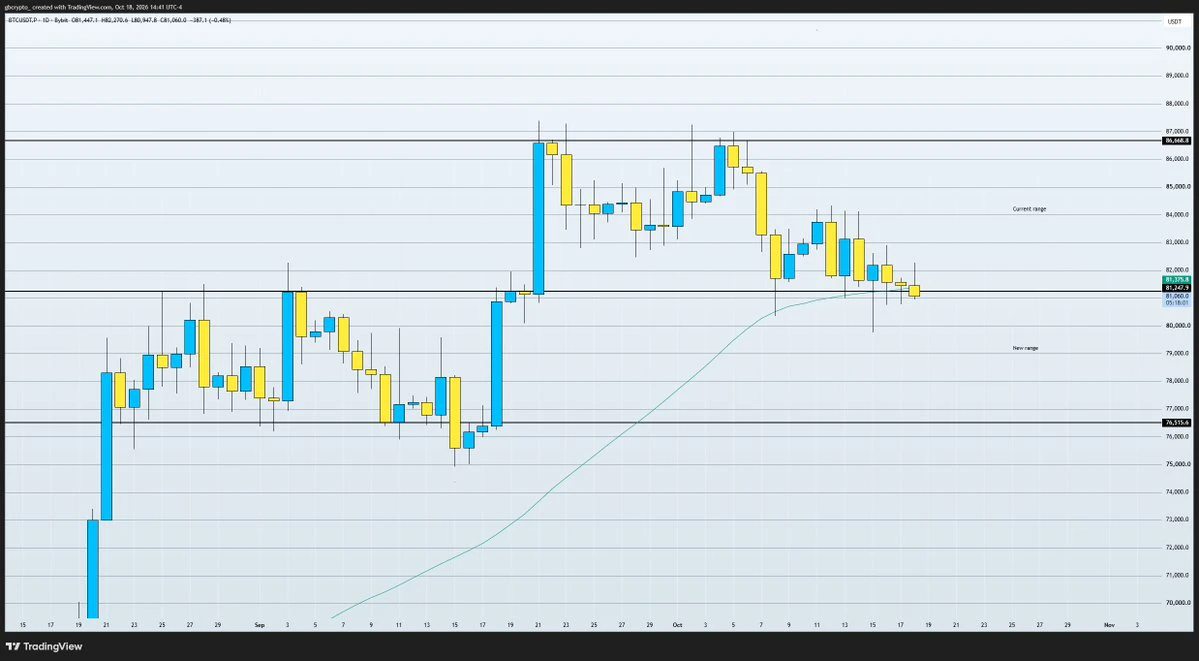
I believe Bitcoin is preparing for its next leg higher.
Despite several bearish catalysts and negative headlines recently, BTC has remained relatively resilient and continues to hold its structure.
The consolidation may continue for longer than expected before the next major move, or we could see a sudden upside impulse.
Either way, the Yearly Open remains my next major higher timeframe target level (87.6k)
post-image
BTC-0.56%
Nice Sunday pullback into local support.
Polymarket is now pricing an 80% probability of a 25bps rate hike, adding another layer of uncertainty heading into the week.
It should be an interesting week, with plenty of potential dip-buying opportunities provided our bottom thesis remains intact and key invalidation levels continue to hold.
post-image
POLYMARKET+10.04%
$ETH
The EMA bands need to hold to maintain the current structure. If these levels are lost, I’d expect a deeper pullback as the market potentially moves to fill some of the existing inefficiency.
A sustained acceptance below 2.4K would open the door to further downside, with 2.2K (D1 200 EMA) and 1981 standing out as key potential targets.
1981 also carries higher-timeframe support confluence alongside the potential for the remaining market inefficiency to be filled.
post-image
ETH-0.73%
Some dip-buying guidance:
The first level I’d look at is the yearly anchored VWAP. If price has consistently respected this level throughout the move, I’ll look to place bids around it.
Another option is to use the 12/21 EMA bands and look for entries when price retraces into them, provided they have previously acted as meaningful support during the upside move.
If these levels also align with additional confluence such as Fibonacci levels, POC, or the 200 EMA that can provide greater conviction and justify increasing position size.
If price loses those levels, the 50 MA becomes the next area
New Youtube Video is LIVE!!
Going over why I think Bitcoin may have bottomed and looking at previous fractals to see what we can expect from price action for the next weeks.
BTC-0.56%
$LAPTOP The inevitable is happening. I hope no one here bought. Instead there is plenty of cheap AI Infra on Base.
post-image
INFRA+2.64%
$PUMP
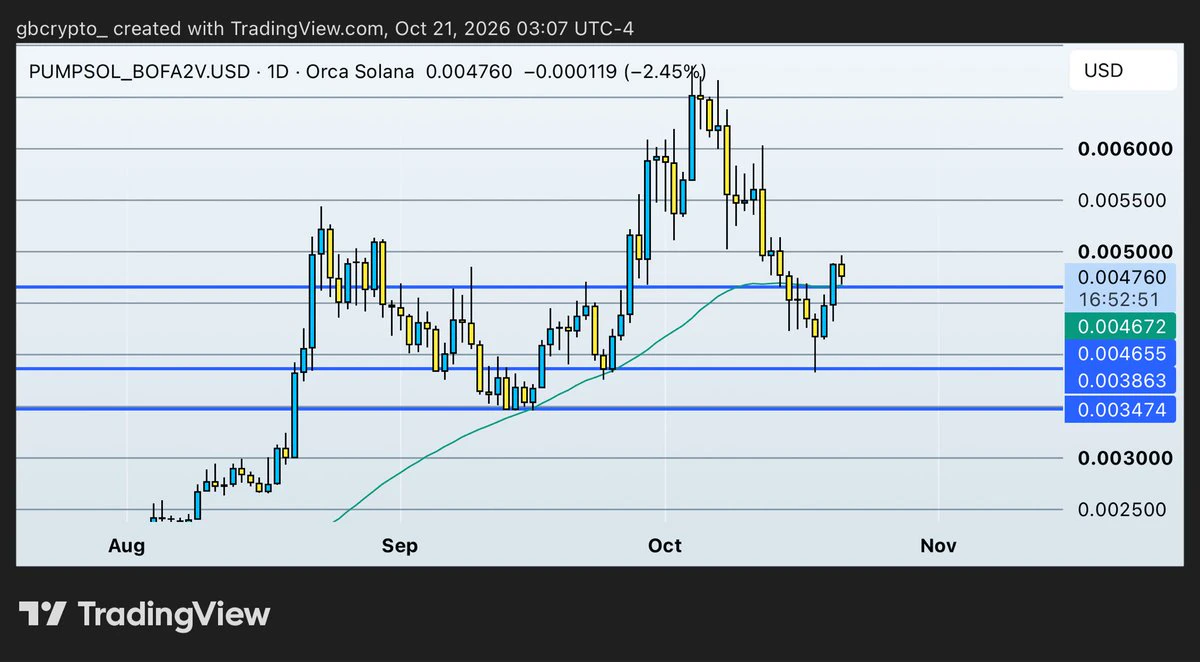
Deviated above range highs now trading in a downward channel back towards the range lows. If we get a positive reaction around that level this is where I will look to scale in. This will be a midterm hold I’ll be looking to trade into price discovery next bull.
PUMP-8.50%
  • 1
  • 1
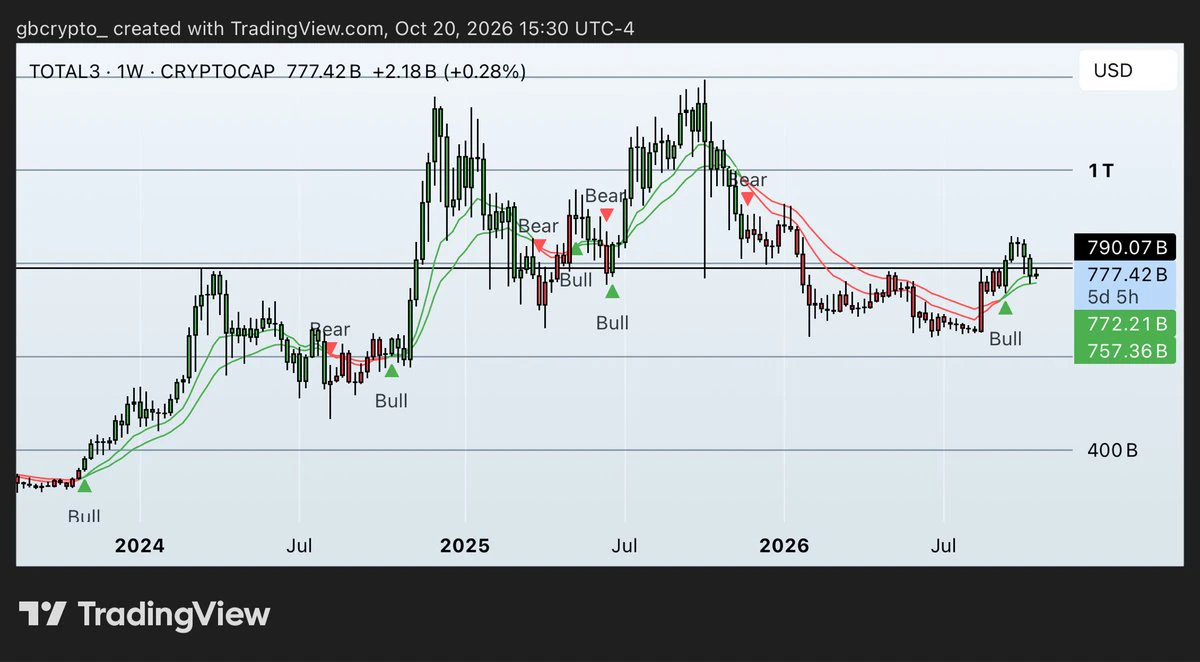
$BTC the weekly 12/21 EMA crossover has officially flipped bullish. 📈
The last time this crossover turned bullish following a major downtrend was in February 2023, shortly after BTC rejected the weekly 50 MA. Price then pulled back into the 12/21 EMA before entering a parabolic expansion that ultimately led to new all-time highs.
From here, 72k are the key downside levels to hold. Maintaining this range would preserve the current bullish structure, momentum, and, most importantly, protect the recent lows.
As long as these levels remain intact, the higher-timeframe setup continues to favour f
post-image
BTC-0.56%