












🚀 BTC Technical Deep Dive: Consolidating Near $82,000 — Bullish Continuation or Key Retest?
Bitcoin ($BTC ) is hovering right around the $81,900 – $82,000 mark, maintaining a steady posture after rebounding strongly from its recent local swing low.
Let's break down the technical outlook across multiple timeframes to map out potential trade setups and crucial levels to watch.
📊 Multi-Timeframe Technical Breakdown
1️⃣ 1-Hour Timeframe (Short-Term Momentum)
Price Range: Floating near $81,964.
Support & Resistance:
Immediate support held firmly at $79,795, where aggressive buyers stepped in.
Local resistance sits near $83,148 (24h High) and $84,142.
Moving Averages: MA5 ($82,060) and MA10 ($82,324) are flattening out alongside EMA lines, indicating a temporary period of equilibrium and consolidation.
MACD: The histogram shows mild bearish momentum fading, preparing for a potential crossover above the zero line.
2️⃣ 4-Hour Timeframe (Mid-Term Trend)
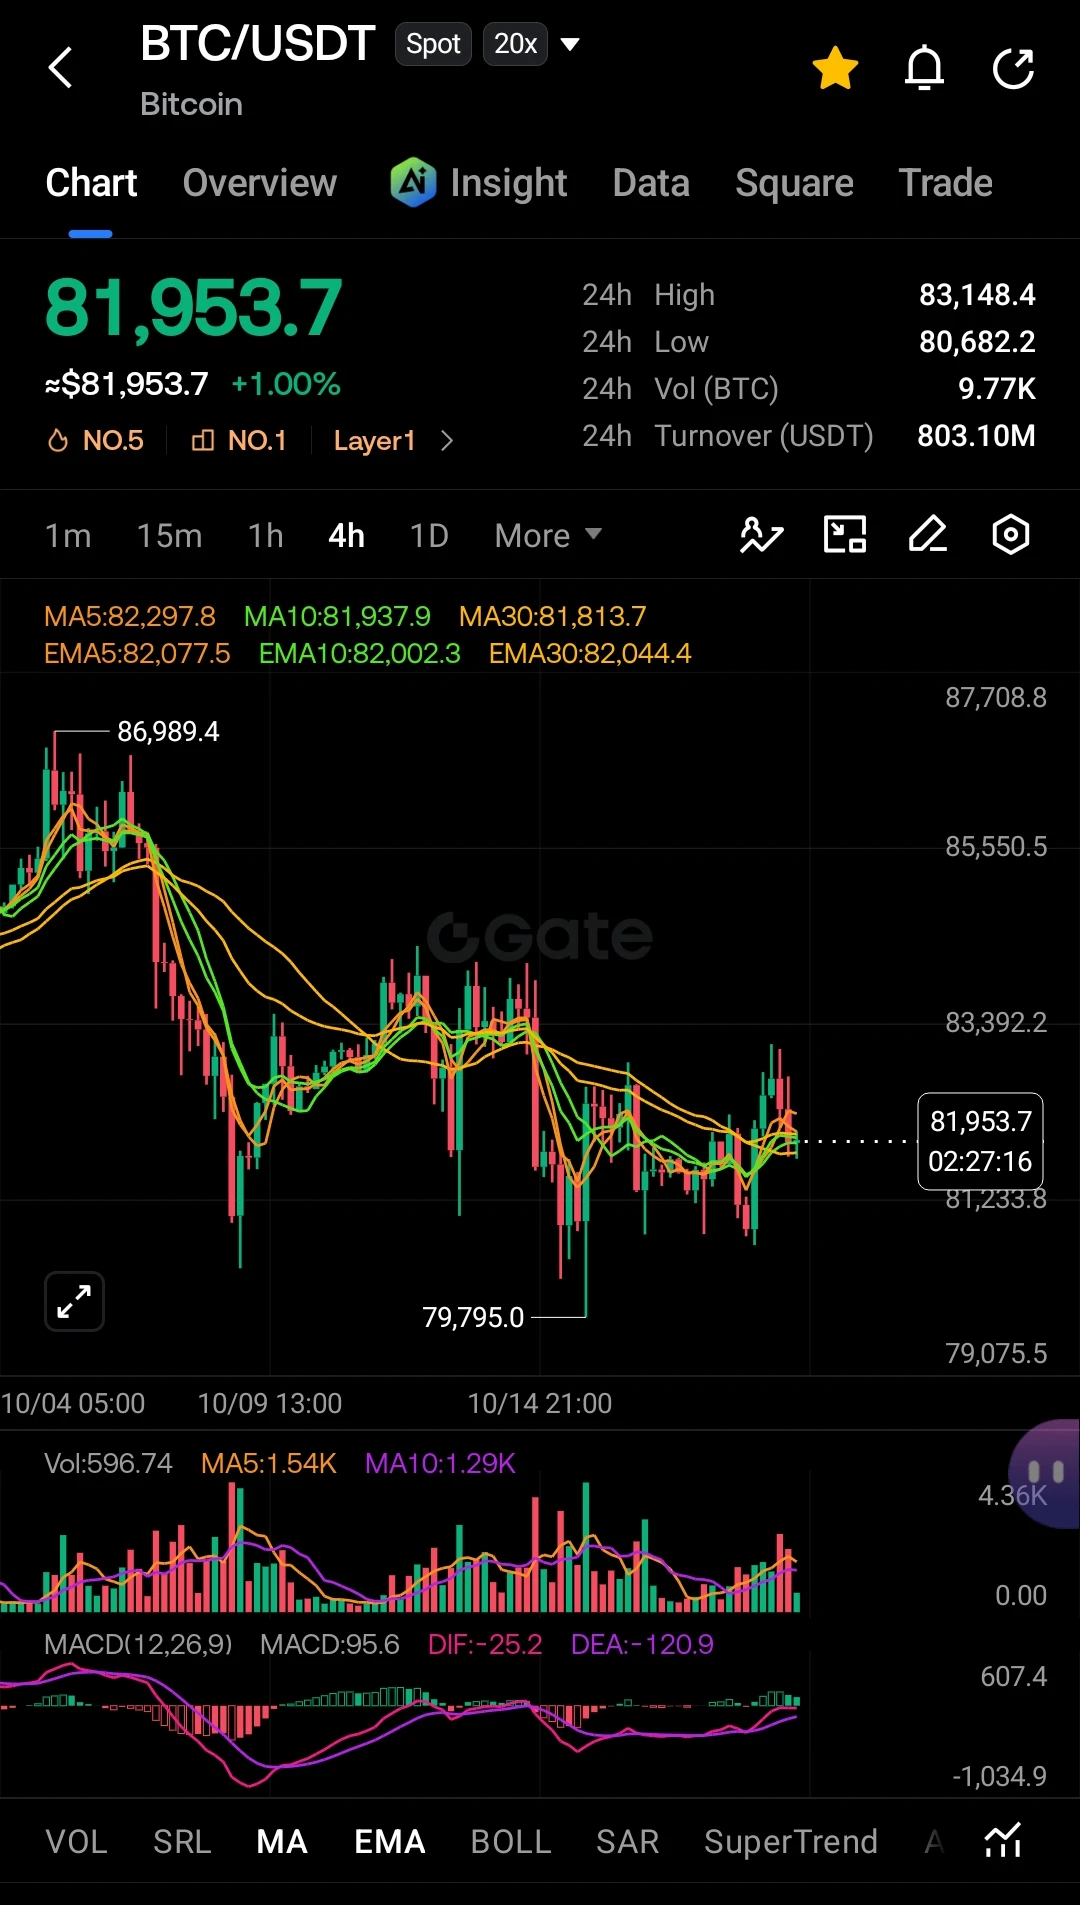
Price Action: Following a pullback from $86,989 down to $79,795, price action is forming a higher low base.
Structure: MA30 ($81,813) is acting as dynamic support, providing a floor for the current recovery phase.
Key Indicators: MACD line (DIF: -25.2, DEA: -120.9) is curling upward, suggesting selling pressure is drying up on intermediate timeframes.
3️⃣ Daily Timeframe (Macro Picture)
Macro Trend: The broader daily chart remains structural and strong, moving upwards from $62,538 up toward the peak near $87,401.
Moving Averages: MA5 ($81,873) and MA10 ($82,281) remain cluster-packed around current spot prices, while the longer-term MA30 ($83,637) serves as the primary hurdle for macro bulls to reclaim.
Volume Profile: Daily volume has normalized, pointing toward market accumulation rather than distribution.
🎯 Key Levels to Watch
Metric / Level Price Point Significance
Immediate Resistance
$83,150 – $84,150
Breakout zone for continuation toward $87,000+.
Current Pivot Zone
$81,900 – $82,000
Equilibrium point across MA5/EMA5 indicators.
Key Support Zone
$79,795 – $80,680
Crucial demand zone to maintain bullish market structure.
💡 Trading Strategy & Outlook
Bullish Scenario: A clean hourly close above $83,150 on rising volume could spark a rally back toward $85,500 and potentially retest the $87,400 highs.
Bearish / Defensive Scenario: If $81,800 fails to hold, expect a sweep of liquidity down toward $80,600, with major invalidation below the key low of $79,795.
Trading Insight: High volatility often follows tight consolidation around key moving averages. Keep tight risk management controls and monitor volume spikes for direction confirmation! 📉📈
👇 What’s your take on BTC’s next move? Are we breaking $85,000 this week, or testing sub-$80k support first? Share your thoughts below!
#Bitcoin #BTC #Gateio
#BitcoinTops$82K
$BTC
Bitcoin ($BTC ) is hovering right around the $81,900 – $82,000 mark, maintaining a steady posture after rebounding strongly from its recent local swing low.
Let's break down the technical outlook across multiple timeframes to map out potential trade setups and crucial levels to watch.
📊 Multi-Timeframe Technical Breakdown
1️⃣ 1-Hour Timeframe (Short-Term Momentum)
Price Range: Floating near $81,964.
Support & Resistance:
Immediate support held firmly at $79,795, where aggressive buyers stepped in.
Local resistance sits near $83,148 (24h High) and $84,142.
Moving Averages: MA5 ($82,060) and MA10 ($82,324) are flattening out alongside EMA lines, indicating a temporary period of equilibrium and consolidation.
MACD: The histogram shows mild bearish momentum fading, preparing for a potential crossover above the zero line.
2️⃣ 4-Hour Timeframe (Mid-Term Trend)
Price Action: Following a pullback from $86,989 down to $79,795, price action is forming a higher low base.
Structure: MA30 ($81,813) is acting as dynamic support, providing a floor for the current recovery phase.
Key Indicators: MACD line (DIF: -25.2, DEA: -120.9) is curling upward, suggesting selling pressure is drying up on intermediate timeframes.
3️⃣ Daily Timeframe (Macro Picture)
Macro Trend: The broader daily chart remains structural and strong, moving upwards from $62,538 up toward the peak near $87,401.
Moving Averages: MA5 ($81,873) and MA10 ($82,281) remain cluster-packed around current spot prices, while the longer-term MA30 ($83,637) serves as the primary hurdle for macro bulls to reclaim.
Volume Profile: Daily volume has normalized, pointing toward market accumulation rather than distribution.
🎯 Key Levels to Watch
Metric / Level Price Point Significance
Immediate Resistance
$83,150 – $84,150
Breakout zone for continuation toward $87,000+.
Current Pivot Zone
$81,900 – $82,000
Equilibrium point across MA5/EMA5 indicators.
Key Support Zone
$79,795 – $80,680
Crucial demand zone to maintain bullish market structure.
💡 Trading Strategy & Outlook
Bullish Scenario: A clean hourly close above $83,150 on rising volume could spark a rally back toward $85,500 and potentially retest the $87,400 highs.
Bearish / Defensive Scenario: If $81,800 fails to hold, expect a sweep of liquidity down toward $80,600, with major invalidation below the key low of $79,795.
Trading Insight: High volatility often follows tight consolidation around key moving averages. Keep tight risk management controls and monitor volume spikes for direction confirmation! 📉📈
👇 What’s your take on BTC’s next move? Are we breaking $85,000 this week, or testing sub-$80k support first? Share your thoughts below!
#Bitcoin #BTC #Gateio
#BitcoinTops$82K
$BTC