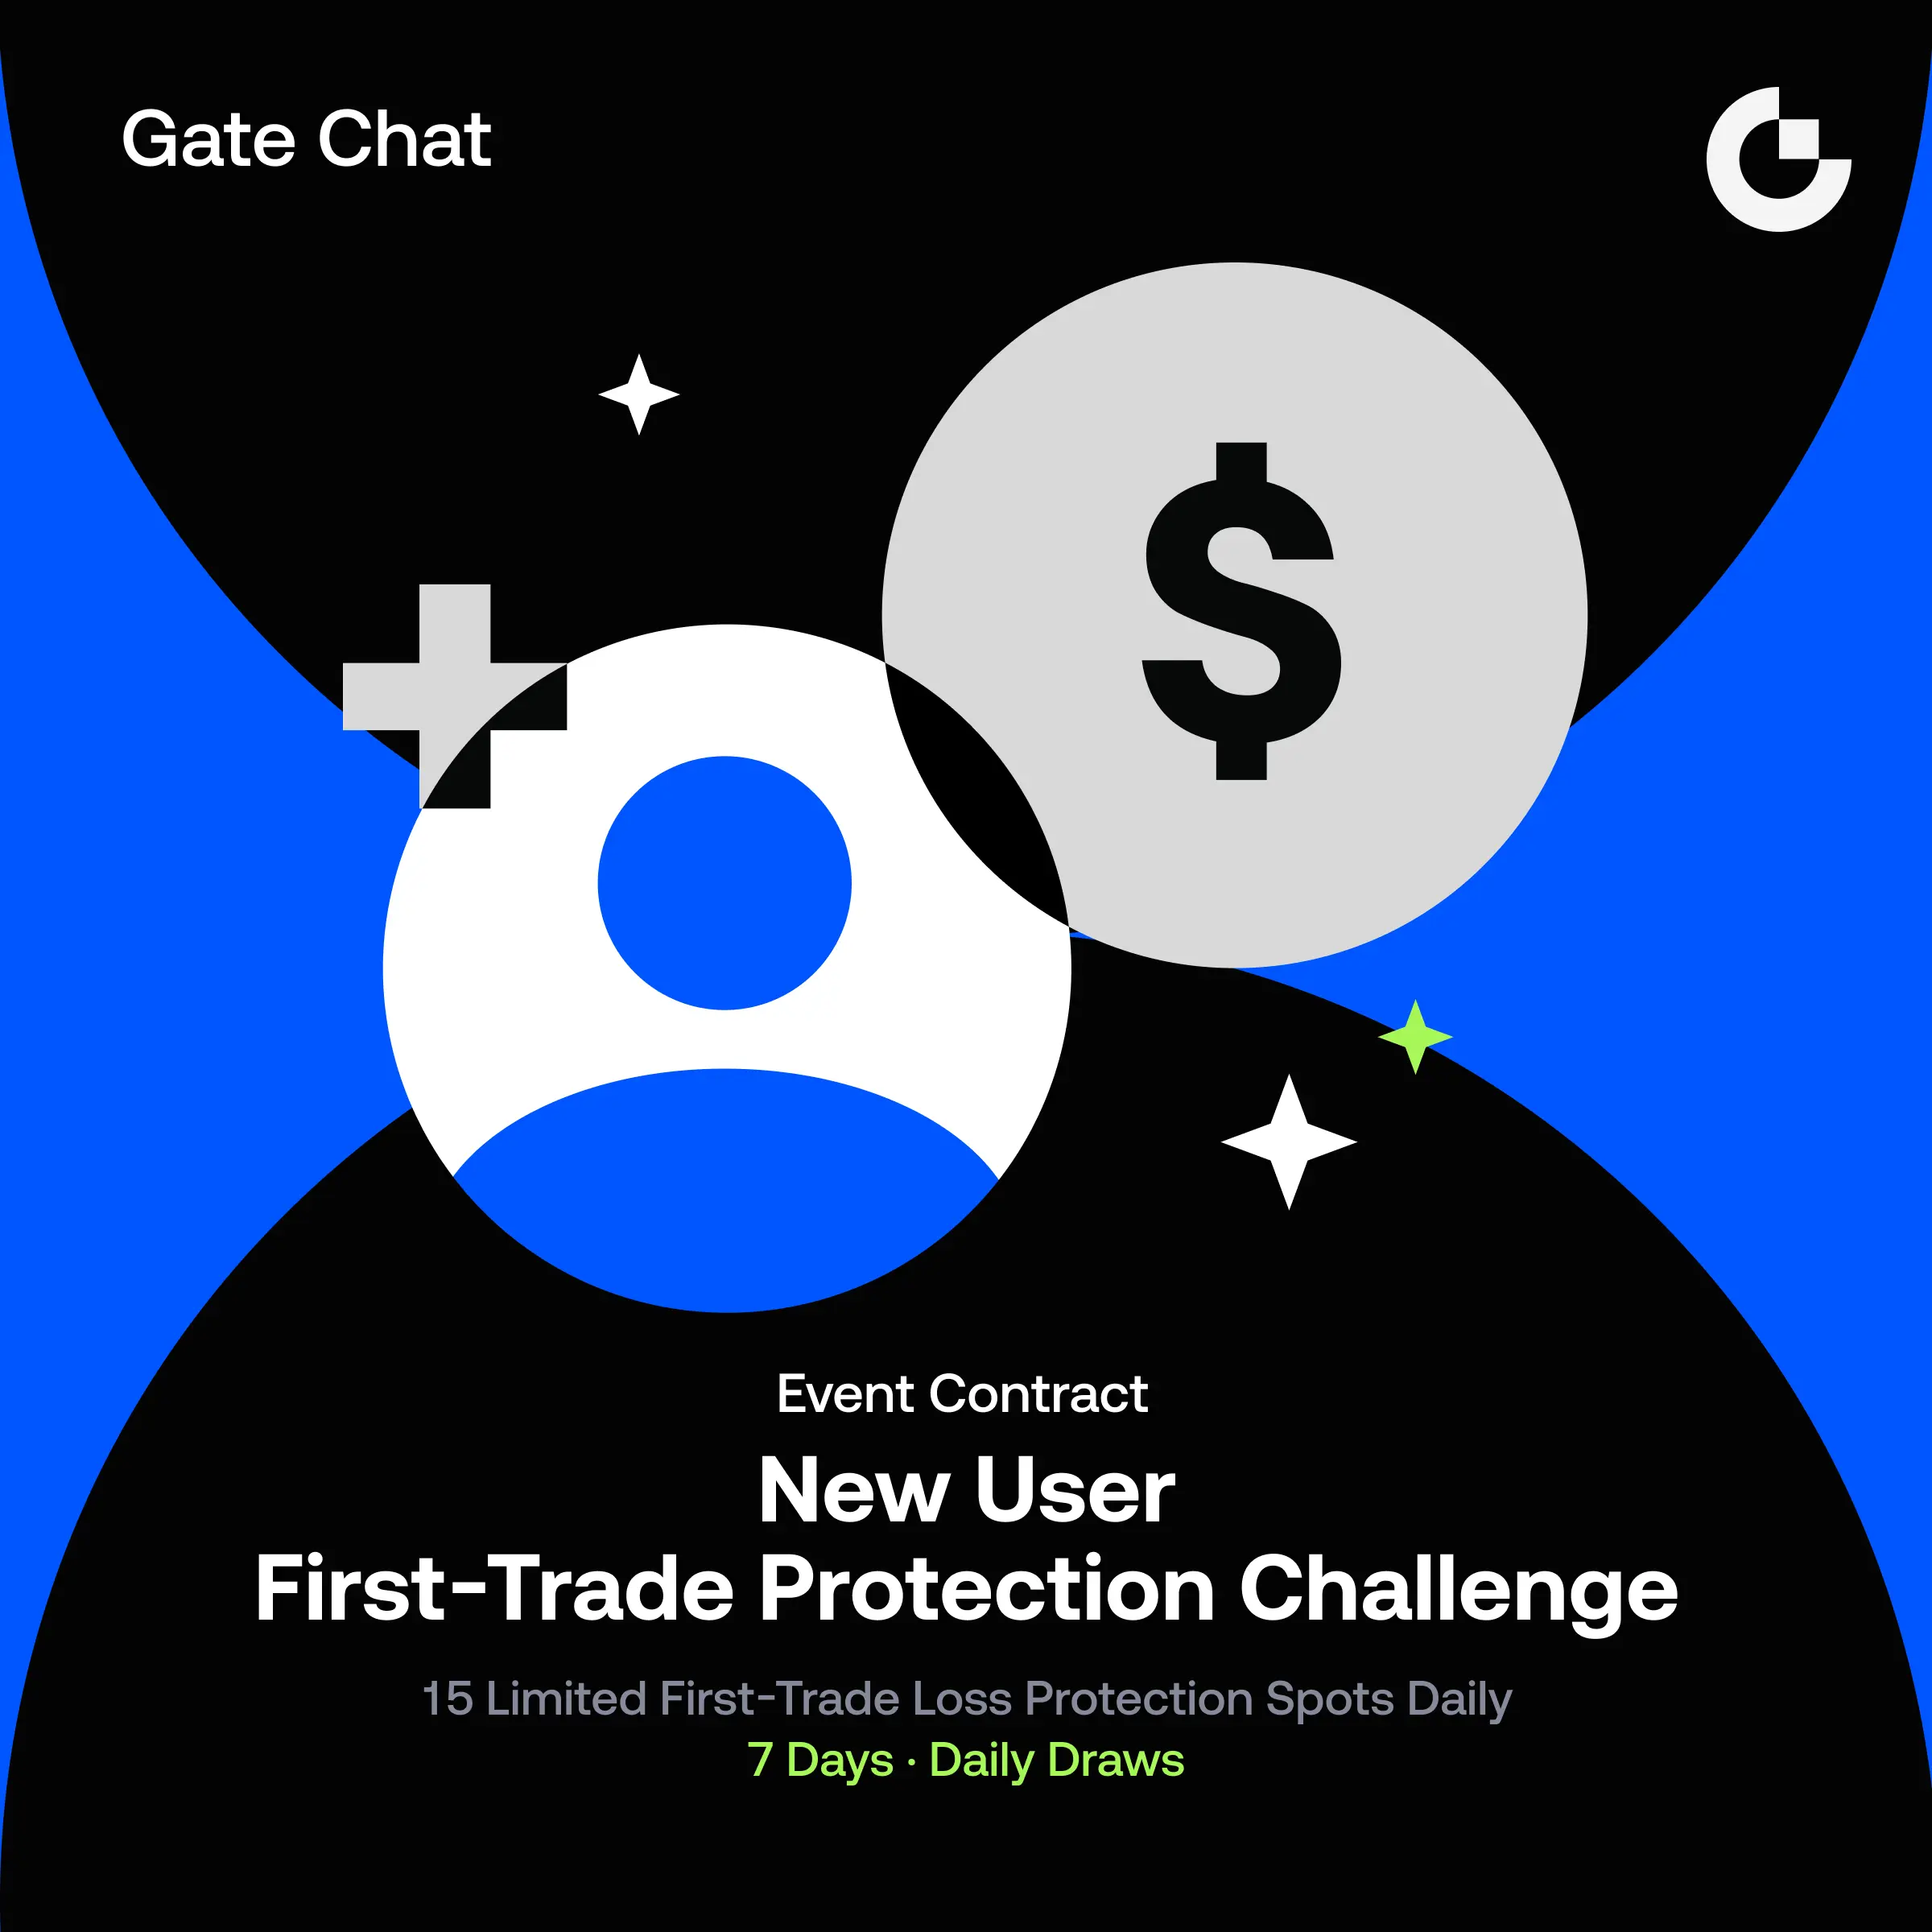
Share crypto content and earn up to 60% commissions through content mining.
placeholder
gatefun
#TradfiTradingChallenge
═══════════════════════════════════════════════════════════════════
TRADFI TRADING CHALLENGE
WHERE TRADITIONAL FINANCE MEETS CRYPTO AGILITY
═══════════════════════════════════════════════════════════════════
INTRODUCTION: THE EVOLUTION OF MODERN MARKETS
The TradFi Trading Challenge represents a new phase in financial market evolution where traditional finance instruments and crypto-native trading systems converge into a single accessible ecosystem. It reflects a broader shift in global trading behavior where accessibility, speed, and technology now define participation
SPX500-0.3%
EURUSD-0.15%
GBPUSD0.19%
JPN225-2.22%
post-image
  • Reward
  • Comment
  • Repost
  • Share
IF YOU HOLD 0.1 BITCOIN:
– GUARANTEED TOP 2.63% GLOBALLY (21,000,000 COINS)
– TOP 2.13% AFTER SUBTRACTING ~4M LOST COINS
– ONLY 4.5M ADDRESSES HOLD >0.1 BTC → TOP 0.56%
YOU’RE AHEAD OF 99.4% OF THE WORLD.
SCARCITY IS REAL.
LET THAT SINK IN 🚀
BTC-0.98%
post-image
post-image
  • Reward
  • Comment
  • Repost
  • Share
Gm friends 🤝
Which crypto card💳 are you using currently?
And for what's best feature you'll recommend it to be used by others? 👇
post-image
  • Reward
  • Comment
  • Repost
  • Share
Liquidity Sits at $75,400. Strategy Holds $75,537. The Trap Is Set.
$BTC
$657 million in longs got liquidated yesterday. The heatmap's brightest pool at $75,400 remains untouched. Strategy's average cost basis sits at $75,537. These numbers are not random. The market hunts the level that causes maximum pain.
🔹 The Heatmap Tells The Story
The largest liquidity cluster on the 24-hour heatmap sits at $75,400. Despite a brutal leverage flush that wiped 106,371 accounts, this pool has not been swept. The market dropped below $77,000, liquidated over-leveraged bulls, and still did not fill the b
BTC-0.98%
ETH-1.54%
post-image
User_any
$BTC Leverage Flushed. BTC Holds $77,000.
Bitcoin dipped 0.87% in 24 hours, a quiet move on the surface. Beneath it, $4.48 billion fled BlackRock's IBIT in a single day, contract open interest collapsed over 10%, and Strategy bought another 24,869 BTC. The market is not drifting. It is violently repositioning.
🔹 The Technical Contradiction
The 4-hour and daily moving averages show a bearish death cross and bearish alignment. This is the trend signal. The 15-minute and daily CCI and WR indicators sit deep in oversold territory. This is the bounce signal .
When short-term oscillators scream oversold inside a larger bearish structure, the result is typically a sharp relief rally that fades unless volume confirms a reversal. MACD is printing a bottom divergence on multiple timeframes. The spring is coiling. The question is which direction it releases.
🔹 The Leverage Purge
Contract open interest dropped 10.11% in 24 hours, one of the sharpest leverage resets in months . Over-leveraged longs got liquidated. Weak hands got shaken out. This is the cleansing phase that historically precedes a stabilization, not a collapse.
The last time open interest dropped this fast, Bitcoin built a base and rallied within days. The reset creates healthier market structure. The excess is gone. The question is whether fresh capital enters to replace it.
🔹 The Institutional Split
Strategy bought 24,869 BTC for approximately $2.01 billion, raising total holdings to 843,304 BTC . This is not a hedge. This is conviction buying at scale.
BlackRock's IBIT recorded a $448 million single-day outflow . One giant buys. Another giant's clients sell. The institutional picture is bifurcated, not uniformly bearish.
The divergence tells a clearer story: long-term strategic accumulators are adding. Short-term ETF traders are reducing risk. The former has a multi-year time horizon. The latter reacts to weekly headlines.
🔹 The Fear Is Extreme
The Fear and Greed Index sits at 25, deep in extreme fear territory . Social media discussion exploded 7.15x in three days, with 48% bullish against 36% bearish . The crowd is terrified and arguing loudly about what comes next.
Historically, extreme fear readings below 30 have marked local bottoms more often than not. Fear is not a precise timing signal, but it is a reliable zone signal. This is the zone where sellers exhaust and buyers begin absorbing.
🔹 The Key Levels
Support holds at $76,000, the 24-hour low tested and defended. Below that, $74,917 is the 61.8% Fibonacci retracement and the line between a correction and a trend breakdown.
Resistance sits at $78,800, the 24-hour high. A break above reclaims $80,000 and opens the path toward the 200-day moving average near $82,200. A close above $82,200 with volume shifts the structure from corrective to bullish.
Bottom Line
Bitcoin held $77,000 while leverage got purged and Strategy bought $2 billion. BlackRock clients sold $448 million. The Fear Index sits at 25. Technicals show oversold bounces competing with bearish trend structure. The leverage reset is complete. The institutional split is real. The next move depends on whether macro fear eases or deepens.
Friends, does the extreme fear and leverage reset make you a buyer here, or do the institutional outflows keep you cautious?
#CryptoMarketDrops150KLiquidated
#DailyPolymarketHotspot
repost-content-media
  • Reward
  • 1
  • Repost
  • Share
FenerliBaba:
2026 GOGOGO 👊
$LDO As a leader in the Ethereum staking sector, it now appears it can no longer hold on. If you have this coin, old friends should be cautious.
After June 15, Swellchain will permanently close, and any remaining wstETH may not be recoverable.
LDO-0.62%
ETH-1.56%
View Original
post-image
  • Reward
  • Comment
  • Repost
  • Share
Just having an idea, I think it's really amazing;
But as soon as I learn a little more, I immediately realize it's naive.
This creates a cycle:
Inspiration appears
Excitement: I seem to understand something
Learn more
Find flaws
Deny myself
Reconstruct
A more complex new understanding
Discover flaws again
And so I keep spinning in the cycle, what the hell am I even doing?
Forget it, let's give the kitten a kiss first.
View Original
post-image
  • Reward
  • Comment
  • Repost
  • Share
$DOGE currently trading near $0.1041. DOGE is moving calmly, but buyers need to reclaim the upper range for stronger momentum. A clean hold above support can bring a short term bounce.
Trade Setup, Long:
Entry Zone: $0.103 to $0.1045
Stop Loss: $0.101
Targets:
$0.106
$0.110
$DOGE ‌
DOGE-1.76%
post-image
  • Reward
  • Comment
  • Repost
  • Share
MemeCore holding a major demand zone after a huge rally.
As long as this support stays intact, the structure still favors continuation higher 🚀
A strong bounce from this area could send price back toward the previous highs 📈
#MEMECORE
M9.44%
post-image
  • Reward
  • Comment
  • Repost
  • Share
The first meme on @base; verify it
$MOONBASE catching bids at $136k (what a joke lol) MC
One of these blast offs it's not going to look back; & Base is heating right the fuck up 😈🔥
MEME-0.81%
BLAST-1.35%
  • Reward
  • Comment
  • Repost
  • Share
$BILL is already in the distribution stage—how low will the slow bleed fall?
Sister Mei has been calling for shorts at the 0.22 level for a long time. It has kept drifting downward all the way to 0.11. And there are still people fantasizing that it will surge hard—choosing to buy the dip and enter.
The top 10 addresses together hold as many as 850 million tokens, with the profit-taking positions extremely concentrated. As the unlock time gets closer and closer, large funds may concentrate their distribution at any moment. Once they begin to smash the price, it will directly break through the
View Original
post-image
post-image
  • Reward
  • Comment
  • Repost
  • Share
👀 Over $30 million was spent on the Kentucky primary between Rep. Thomas Massie and Ed Gallrein. It is officially the most expensive congressional race in history. #crypto
post-image
  • Reward
  • Comment
  • Repost
  • Share
I’m planning to follow a diet for a few weeks to get back on track.
My mom remembered how much I love this, so she brought one back as a souvenir for me 🥹
post-image
  • Reward
  • Comment
  • Repost
  • Share
#TradfiTradingChallenge
NZD/JPY Market Analysis
1. Current Market Situation
NZD/JPY is currently trading near the 92.95 level while remaining under moderate selling pressure after declining around 0.40% during the latest trading session, and this movement reflects increasing uncertainty across global financial markets where traders are balancing central-bank expectations, geopolitical tensions, bond-yield volatility, and changing carry-trade conditions simultaneously. Although the pair has declined approximately 0.86% over the past month, the broader yearly structure still remains relatively
post-image
  • Reward
  • Comment
  • Repost
  • Share
Apart from the fact that we now have dozens of chains competing for the same developers, users and liquidity, the cumulative REV across all of them is down more than -95% from the 2021 mania. And still down around -90% even from the early 2024 memecoin bubble.
So whenever I see massively overfunded tOp TiEr VCs still investing in new chains just so they can deploy larger checks and rerun the old infra premium playbook, I honestly can’t help but laugh at this point.
The infra circle jerk was fun while it lasted, but I’m glad we’re finally reaching the stage where the industry is focused on buil
MEME-0.81%
INFRA1.06%
post-image
  • Reward
  • Comment
  • Repost
  • Share
Expect High Volatility
Geopolitical news like this can cause sudden spikes in crypto, oil, and gold. Avoid over-leveraging during unstable conditions.
Focus on Safe Assets
In uncertainty, investors often move toward gold and USD. Watch these for potential momentum trades.
Use Tight Risk Management
Set stop-losses carefully. News-driven markets can reverse quickly without warning.
Avoid Emotional Trading
Don’t enter trades based on fear or hype. Wait for confirmation after the initial market reaction.
Watch Oil & Bitcoin Closely
Oil reacts directly to Iran-related tensions, while Bitcoin often
XAU-0.71%
BTC-0.98%
  • Reward
  • Comment
  • Repost
  • Share
$BTC price action make grown man cry
BTC-0.98%
post-image
post-image
  • Reward
  • Comment
  • Repost
  • Share
#GateSquarePizzaDay
═══════════════════════════════════════════════════════════════════
GATE SQUARE PIZZA DAY
"THE MOST EXPENSIVE MEAL IN HISTORY"
═══════════════════════════════════════════════════════════════════
CHAPTER 1: THE HUNGER
May 22, 2010. Jacksonville, Florida.
Laszlo Hanyecz is hungry.
Not philosophical hunger. Not metaphorical hunger.
Actual, stomach-growling, "I need pizza now" hunger.
He has 10,000 Bitcoin.
In 2010, that's worth about $41.
Enough for two large pizzas from Papa John's.
He posts on a forum:
"I'll pay 10,000 bitcoins for a couple of pizzas.
Like maybe 2 large
BTC-0.98%
post-image
post-image
  • Reward
  • 1
  • Repost
  • Share
FenerliBaba:
LFG 🔥
$Bitcoin has officially broken down from its ascending channel on the daily chart. 📉
The support failed around $79k, and we are currently sitting at $76.8k. Are we looking at a deeper correction, or is this a liquidity hunt before the next leg up?
BTC-0.98%
post-image
  • Reward
  • Comment
  • Repost
  • Share
$FHE Signal】Multiple callbacks, wait for support confirmation after 1H MACD death cross
$FHE 4H RSI 64.96, 1H MACD death cross at high level with decreasing volume, price breaks below 0.46. Depth deviation -28% indicates selling pressure, but there are dense orders in the 0.435-0.458 range, revealing capital support intentions. Current risk-reward ratio is about 1:0.9, wait for price to retrace near 0.458 before considering entry.
🎯Direction: Long (place order)
⚡Entry/Order: 0.45837
🛑Stop loss: 0.41432
🚀Target 1: 0.47717
🚀Target 2: 0.49812
🛡️Trade management:
- Execution strategy: Redu
FHE-5.32%
PYTH-4.95%
BTC-0.98%
ETH-1.56%
View Original
post-image
  • Reward
  • Comment
  • Repost
  • Share
1. Start as nonprofit - "just an experiment!"
2. Pivot to for profit - "wow this works!"
3. Donors get zero equity - "enjoy your memecoins!"
Tech is learning the crypto playbook
post-image
  • Reward
  • Comment
  • Repost
  • Share
Load More