Share your thoughts
placeholder
Article
$907,000 A certain trader made two FOMO trades i, resulting in a total loss of $907,000
live-cover
LIVE1,315
Gold’s 4h chart is screaming short at 4438—but the daily range says don’t trust it yet.

$XAU /USDT - SHORT

Trade Plan:
Entry: 4436.95 – 4439.87
SL: 4452.40
TP1: 4427.92
TP2: 4420.92
TP3: 4410.43

Why this setup?
- RSI 15m at 52.4 = no momentum fuel, just a lazy drift into resistance.
- ATR 1h at 5.83 means a 10 move is nothing—our TP1 at 4427 is a 0.24% scalp, not a trend.
- Daily range kills the conviction: 55% confidence is a coin flip, so we’re selling the 4h rejection, not the macro.
- Why now? Entry zone 4436.95–4439.87 is a tight 0.07% box—wait for a 15m close below 4438 to tr
XAU+0.06%
Move to Hawaii they said.
It’s paradise they said.
So far, wild fires, tsunami, and now this.
Stay safe everyone.
post-image
【$B Signal】Long | 1H pullback to Bollinger midline + bid support
$B 1H pullback to the Bollinger midline, bid-side depth imbalance at 12.02%, current price 0.1733 holding just above the midline.
🎯Direction: Long
⚡Entry/Limit order: 0.172780 - 0.173300
🛑Stop-loss: 0.171567
🚀Target 1: 0.175900
🚀Target 2: 0.177199
🛡️Trading management:
- Execution strategy: After reaching Target 1, reduce the position by 50% and move the stop-loss up to breakeven. If the price falls back to the entry level, exit automatically to protect the principal.
Depth logic: The 4H MACD is above the zero line; the hist
post-image
BTC+0.21%
ETH+1.08%
SOL+1.27%
#Bots I'm trading MEMECOINUSDT with the Futures Grid bot on Gate. Join me!
post-image
Japanese and South Korean stock markets suddenly launch a broad comeback! SoftBank surges, is the AI rally back?
After the pullback in recent days, Japanese and South Korean stocks quickly staged a “deep V-shaped rebound.” On September 4, the Nikkei 225 rose 1.26%, the KOSPI rose 1.64%, and SoftBank became the market’s main focus.
The core keywords behind this rally remain technology and AI. After Federal Reserve officials sent relatively dovish signals, U.S. Treasury yields fell and sentiment toward U.S. tech stocks recovered, naturally giving Asian semiconductor and AI supply chains a “recha
JPN225-0.05%
  • 27
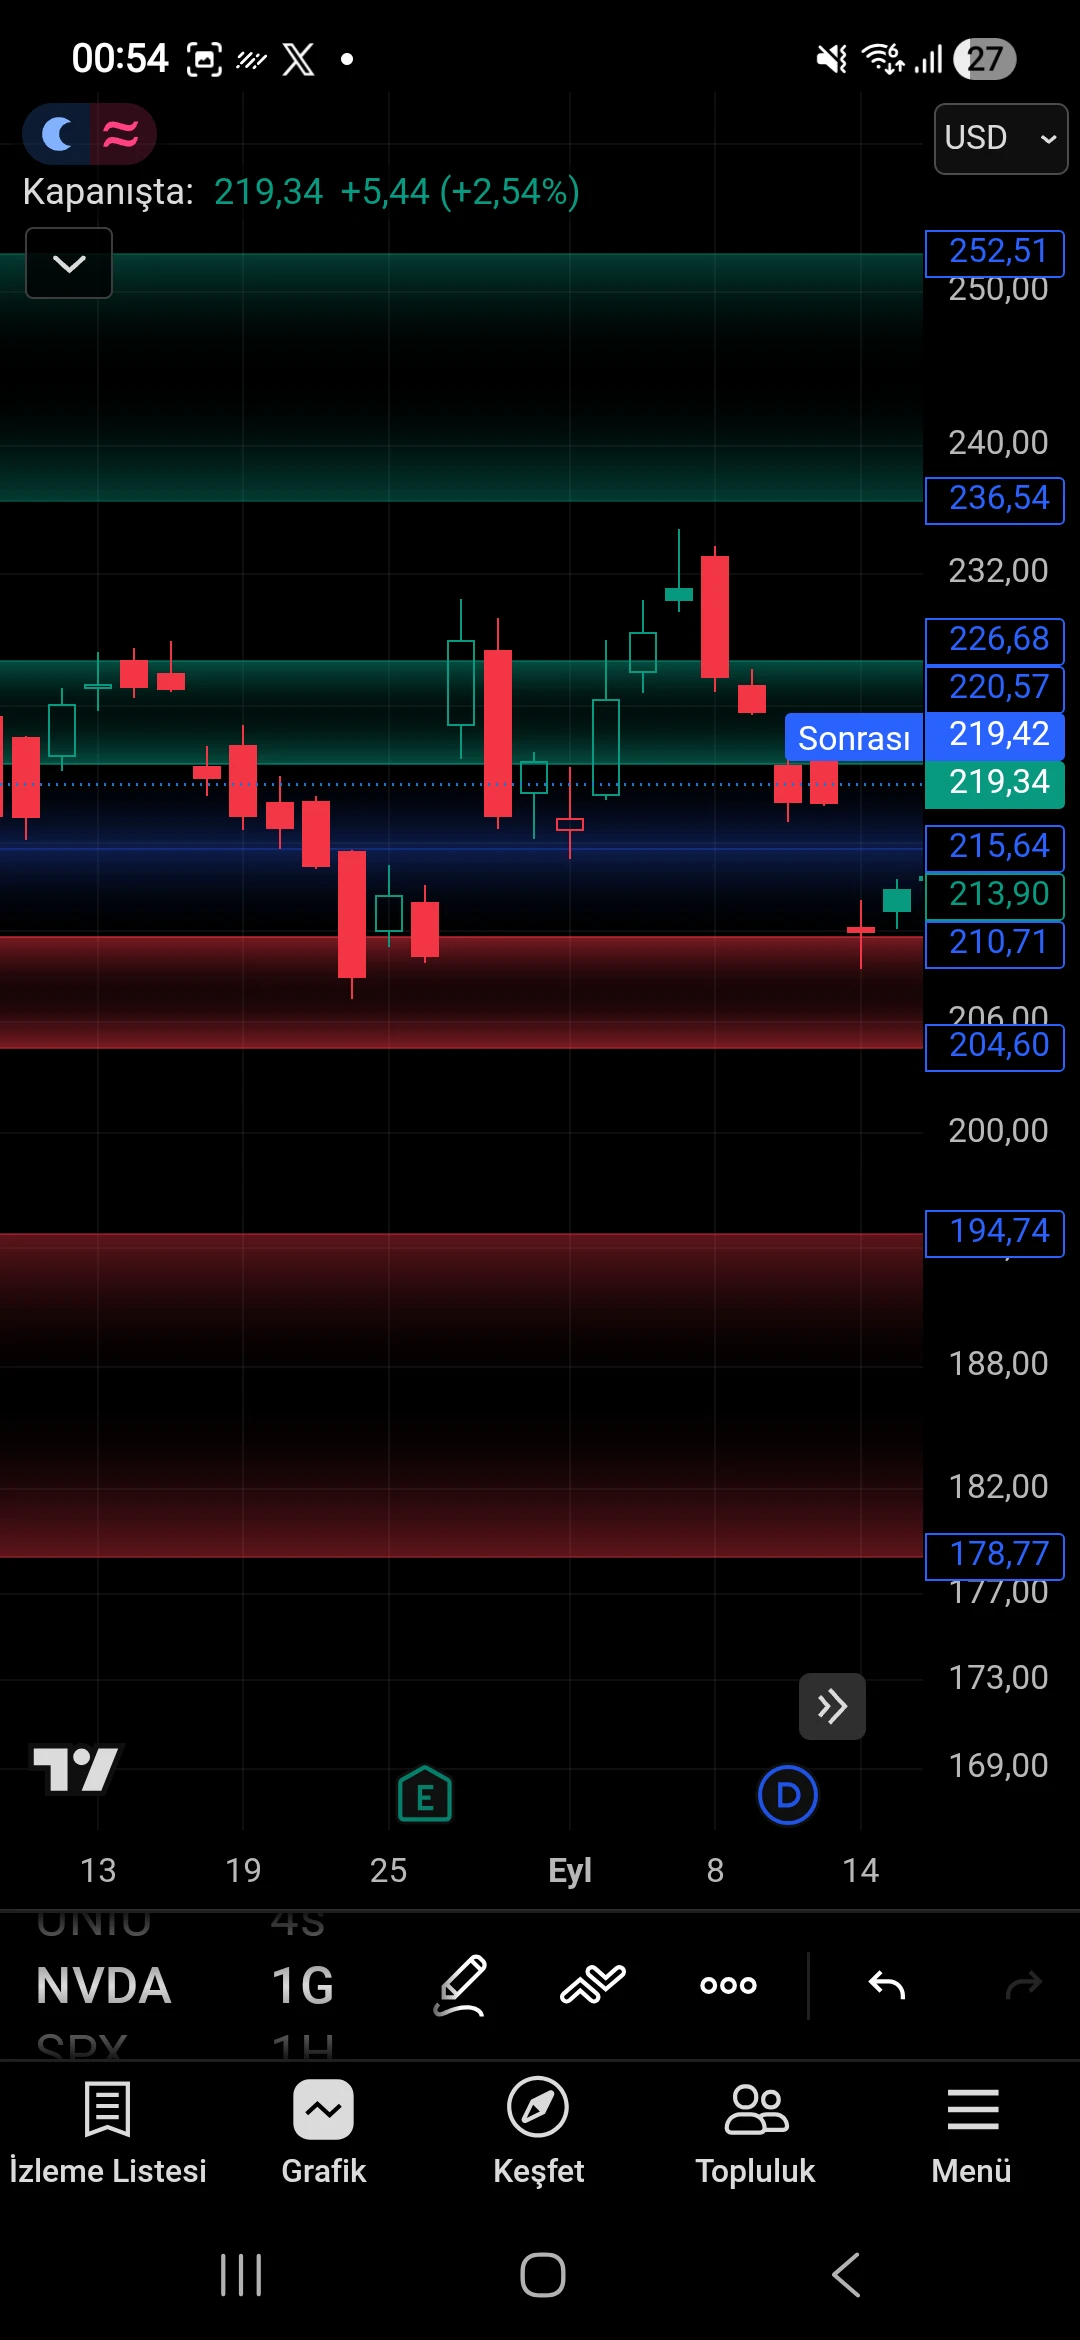
$TSM
It may have survived the worst! The green zone was my entry/add zone
post-image
TSM+2.76%
Most traders will fade this silver short at 66.22—that's exactly why it works.

$XAG /USDT - SHORT

Trade Plan:
Entry: 66.19 – 66.25
SL: 66.49
TP1: 66.02
TP2: 65.88
TP3: 65.68

Why this setup?
Why now? The 4h frame is screaming exhaustion while the daily sits dead-center in a range. RSI on the 15m is already at 34.69—momentum is bleeding, not bouncing. The setup is armed with tight risk: entry 66.22, invalidation just 0.57 above at 66.79. That's a 1:3+ reward-to-risk to TP2 at 65.88. The range top is rejected; the path of least resistance is down.

Debate:
If silver closes back above 66.49
XAG-0.11%
#Gate用户突破6000万,来
60 Million Users — 60 Million Stories, One Incredible Journey
Gate has officially surpassed 60 million users worldwide!
This is not just another number. 60 million users represent 60 million journeys — millions of people who entered the crypto world with dreams, curiosity, excitement, and sometimes a little bit of fear.
For some, it started with their very first Bitcoin purchase.
For others, it was their first futures trade, first profit, first loss, or the first time they experienced the unforgettable volatility of the crypto market.
And honestly, who can forget their fi
post-image
BTC+0.21%
$BTC 's Recent bear market trend has seen a -54% drawdown top to bottom.
This was while all other markets were rallying hard, which is a good argument as to why it was "just" -54% this time around. Arguably, price would see a much larger drawdown if stocks and everything were down a lot too during this time.
This was a very isolated bear trend this time around.
#Gate60MillionUsers #BTCReclaims80K
post-image
BTC+0.21%
  • 7
This trend is so obvious I don’t even need to think—the account is dancing by itself 😂 I had just finished reading the bearish news, and the market slid another notch, with the short side starting to perform on its own.
Before the market had fully kicked off, I already felt that the rebound was off. Several consecutive rebound attempts were all pushed back down, with what felt like an iron plate covering the upside; price and volume completely failed to keep up. This kind of low-volume rebound is the easiest way to trick people into taking the other side. I went short directly around 0.00787,
post-image
BTC+0.21%
XRP+1.02%
$ETH Signal】Long + 1H MACD histogram widening / 4H golden cross
$ETH The 1H MACD histogram widened to 3.81, with the price holding just below the upper Bollinger Band. The 4H golden cross continues, and the previous 4H bullish candle had a volume of 464,000. The 1H RSI is 65.24, and the funding rate is 0.0078%, so longs are not overheated. The order book depth ratio is 0.20, with sell orders placed deeper, creating slippage costs for short-term chasing. The risk-reward ratio is 1.5, the direction is clear, and execution should follow the specified levels.
🎯Direction: Long
⚡Entry/Limit order:
post-image
ETH+1.07%
BTC+0.21%
SOL+1.27%
Don’t just show your profits! What’s really interesting is why you dared to bet on this side.
Recently, after taking part in Gate’s event contract P&L-sharing challenge, I found that the most interesting part of this format isn’t simply showing how much you made, but laying out your full market judgment.
The biggest appeal of event contracts is that every choice is based on a clear question: up or down? Breakout or pullback? Will a certain event ultimately happen?
My approach has always been fairly simple: look at the macro picture first, then price, and finally market sentiment. For example,
BTC+0.21%
Everyone’s watching SUI’s 0.80 level—but the 4h chart is whispering a different secret.

$SUI /USDT - SHORT

Trade Plan:
Entry: 0.7976 – 0.8028
SL: 0.8247
TP1: 0.7818
TP2: 0.7696
TP3: 0.7512

Why this setup?
- RSI on the 15m is at 51.8, not overbought, not oversold—just dead air before a move.
- ATR 1h at 0.0102 means volatility is compressed; breakouts here are violent.
- Entry at 0.8002 with TP1 at 0.7818 is a 2.3% scalp, but the real target is TP3 at 0.7512 if the range floor cracks.
- Why now? The 1D trend is “range”—but price is hugging the upper rail, and short setups from resis
SUI+5.48%
Everyone’s chasing the bounce—but the 4h chart just whispered a name: LAB/USDT.

LAB/USDT - SHORT

Trade Plan:
Entry: 0.07411 – 0.07457
SL: 0.07651
TP1: 0.07271
TP2: 0.07163
TP3: 0.07000

Why this setup?
The data isn’t debating you; it’s daring you.
- 1D trend: bearish—no fakeout, just gravity.
- 95% confidence on SHORT while RSI 15m sits at 42 (weak relief, not reversal).
- ATR 1h (0.0009) says volatility is coiling—breakouts here are violent.
Why now? Entry ref 0.07434 is the line in the sand; invalidation sits a hair below at 0.07429. The trap is set for late longs.

Debate:
If
LAB+0.58%
THIS IS INSANE. 🤯
$Nike is getting removed from the S&P 100. After nearly 18 years.
It joined the index in December 2008. It's leaving September 21.
$230 billion in market cap evaporated to get here. An 80% crash from peak. One of the most recognizable brands on the planet, quietly falling out of one of the most exclusive stock indexes in the world.
Here's the part that makes this worse than just a bad stock chart. When a company gets removed from an index like the S&P 100, every index fund tracking it is forced to sell automatically. Not because they want to. Because their mandate requires i
post-image
NKE-0.86%
SPX-0.53%
I did nothing—just went to the restroom, and when I came back, the candlestick chart had already done the work for me.🚽

Right after seeing the bearish news, I was watching the order book for $PROM . Each rebound was lower than the last, and volume was also shrinking—a clear sign that funds were pulling out while pushing the price up. I didn’t overthink it and entered a short at 7.149. After setting my stop-loss, I went to do my own thing instead of falling in love with the market.

When I came back, the price had already dropped to 5.094, securing +1384.31%. This trade was indeed hassle-fr
post-image
PROM-0.88%
ZEC+0.17%
BNB+6.21%
Is this even a rebound? It’s CPR for my account, isn’t it? $ZKC It just touched 0.0497, with +12.88% secured. I stared at the screen for several seconds to make sure I had the right account.

When I opened the charts this morning, buying pressure had clearly strengthened, and each pullback was getting smaller and smaller. This was obviously not an ordinary dead-cat bounce. Around 0.04953, I put it plainly: the risk-reward at this level was good enough; if wrong, take the loss, and if right, it’s a big payday.

Looking back now, the timing was spot-on. As for the position management: I took 7
post-image
ZKC+1.06%
XRP+1.02%
BTC+0.21%
$GT is showing strong bullish momentum on the daily chart.
Price is up over 10% around $9.28 after breaking out from the recent $8.00 area.
Key levels I’m watching:
• Resistance: $9.67–$10.00
• First support: $8.80–$9.00
• Major support: $8.00–$8.20
If $GT can hold above $9.00 and break the recent $9.67 high, the next leg higher could open up.
For now, buyers clearly have momentum, but after such a strong move, a retest would be normal.
#GT #GateToken #Crypto
GT+10.23%
  • 6
  • 1
Load More

Join 40 M users in our growing community

⚡️ Join 40 M users in the crypto craze discussion

💬 Engage with your favorite top creators

👍 See what interests you

View More