Square
Following
Hot
News
Notifications
Profile
Share your thoughts
placeholder
Article
Crypto Market Latest Update
live-cover
LIVE3,650
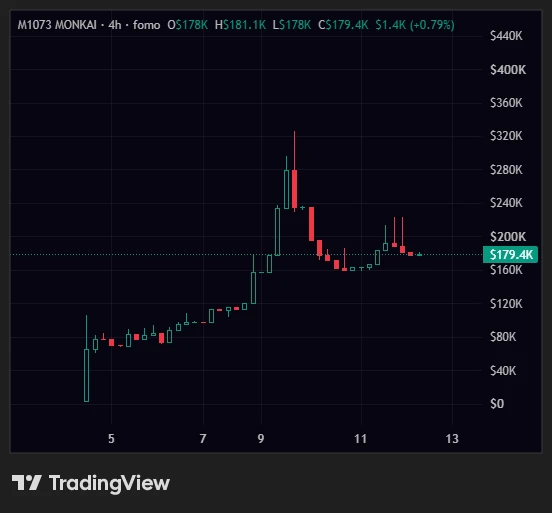
$MONKAI is dipping right now and I know it
But I'm still buying more because I believe this thing is getting ready for a bounce back
Not every dip scares me, sometimes it's exactly where I want to be adding
I'm staying positioned. Don't sleep on this one
post-image
Trenches
Max
M
bade
b
Max
5qaP...pump
Market Cap
$.
Change
.
24h Vol
$.
Holders
.
mihao
m
bade
b
mihao
4Cxj...pump
Market Cap
$.
Change
.
24h Vol
$.
Holders
AGT
A
bade
b
AGT
0x5d...e274
Market Cap
$.
Change
.
24h Vol
$.
Holders
.
IDOL
I
bade
b
IDOL
0x3b...ab07
Market Cap
$.
Change
.
24h Vol
$.
Holders
.
DacityCoin
D
bade
b
DacityCoin
DKYc...pump
Market Cap
$.
Change
.
24h Vol
$.
Holders
.
5 Mistakes Investors Are Most Likely to Make After a Crash—Have You Fallen Into Any of Them?

After a sharp market downturn, what truly tests investors is often not their analytical ability, but their ability to make decisions in the face of panic. Many people have solid investment plans, but a bout of extreme volatility can lead them to do the exact opposite.

The following five mistakes are especially worth watching out for.

First, blindly buying the dip. Seeing BTC continue to fall, some assume the price is already cheap enough. But a steep drop does not mean the market has bottomed. Rushi
post-image
BTC-0.67%
🚨 Breaking | 🔴 A major blow to Strategy
MSCI is moving to exclude Michael Saylor-owned Strategy ($MSTR ) from its indexes at the end of November
⚠️ The decision could trigger selling pressure from investment funds that track MSCI indexes and put the company’s stock under additional pressure
The key question: Will the decision’s impact extend to the Bitcoin market $BTC because of the massive size of Strategy’s holdings?
MSCI+0.71%
MSTR+1.10%
BTC-0.67%
  • 1
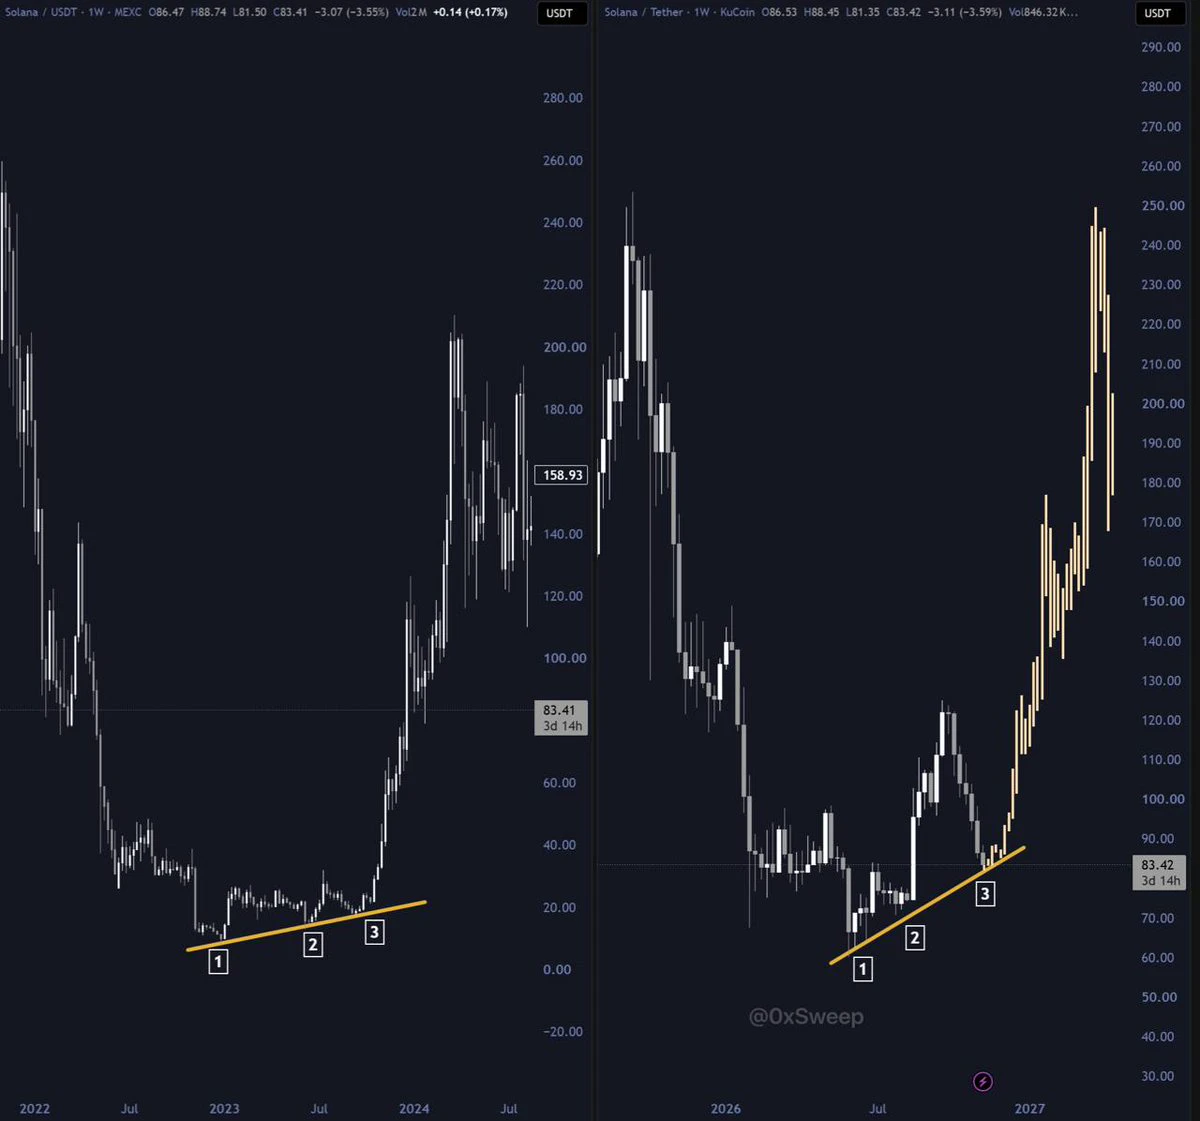
$SOL has tapped its bull run uptrend
Hold this, and it'll run higher
Lose this, and we'll go for new jobs together
post-image
SOL-0.77%
GM gents.
The ones still here will make it.
What should I ape?
post-image
BTC is stuck at 73,000 awaiting initial jobless claims, ETFs are bleeding, and tonight’s drop may not be a fakeout

BTC is in a very awkward spot right now. After the CPI shock, its price has been churning in a narrow range between $72,700 and $73,500. The $74,000 level above has turned from support into strong resistance, while spot ETFs continue to see outflows.

Macro factors now have an overwhelming influence on BTC’s price. Tonight’s initial jobless claims data will be the key catalyst determining its direction.

Let’s map out tonight’s possible scenarios. If initial claims come in below
BTC-0.65%
What Is Layer 2? Why Can It Make On-Chain Transactions Cheaper?

In the Web3 world, high transaction fees and network congestion have long been concerns for users. Layer 2 networks are a technical solution developed to ease these problems. But why can they lower costs? Does using Layer 2 mean transactions are always cheaper and safer?

First, what is Layer 2?

Taking Ethereum as an example, Layer 1 is the Ethereum mainnet, responsible for basic transaction validation and security. Layer 2 processes large numbers of transactions outside the mainnet and, depending on its design, submits transact
post-image
ETH-1.26%
No night-session update, since the daytime one is still usable and the levels haven’t changed.
Everyday mindset of crypto retail investors:
Most people can’t hold on to their profits because, subconsciously, they think unrealized gains are already money in their pockets, so a pullback in those gains feels like money being taken out. They can withstand losses because they think unrealized losses aren’t real losses. This counterintuitive design is ingenious. I’ll be teaching in the livestream at 9 tonight, so come early
  • 7
Dancin with BERRS has been fun
Soon dance with bulls
post-image
U.S. Stocks Rebound, but Rumors of Jensen Huangs Ouster Trigger After-Hours Selling
live-cover
LIVE1,940
The real question if Jensen is ousted:
Does Nvidia continue its big push with open source models?
post-image
NVDA+2.99%
Crypto Market Plunges: What Are Institutions Doing? Where Is Capital Flowing?

Whenever the cryptocurrency market takes a sharp downturn, ordinary investors are most concerned with when prices will rebound, but professional investors often focus on another question: where is capital flowing?

That’s because prices reflect the outcome of market trading, while capital flows can help us understand investors’ real behavior.

First, watch Bitcoin ETF flows. Daily net inflows and outflows from spot ETFs can help us understand the allocation demand of some institutional investors. If there are consec
post-image
BTC+1.22%
Intraday $XAUUSD second trade 🤝
3926 long
TP:3954
SL:3913.74
Target 🎯 2.16x (2R)
TP hit perfectly
XAUUSD-1.10%
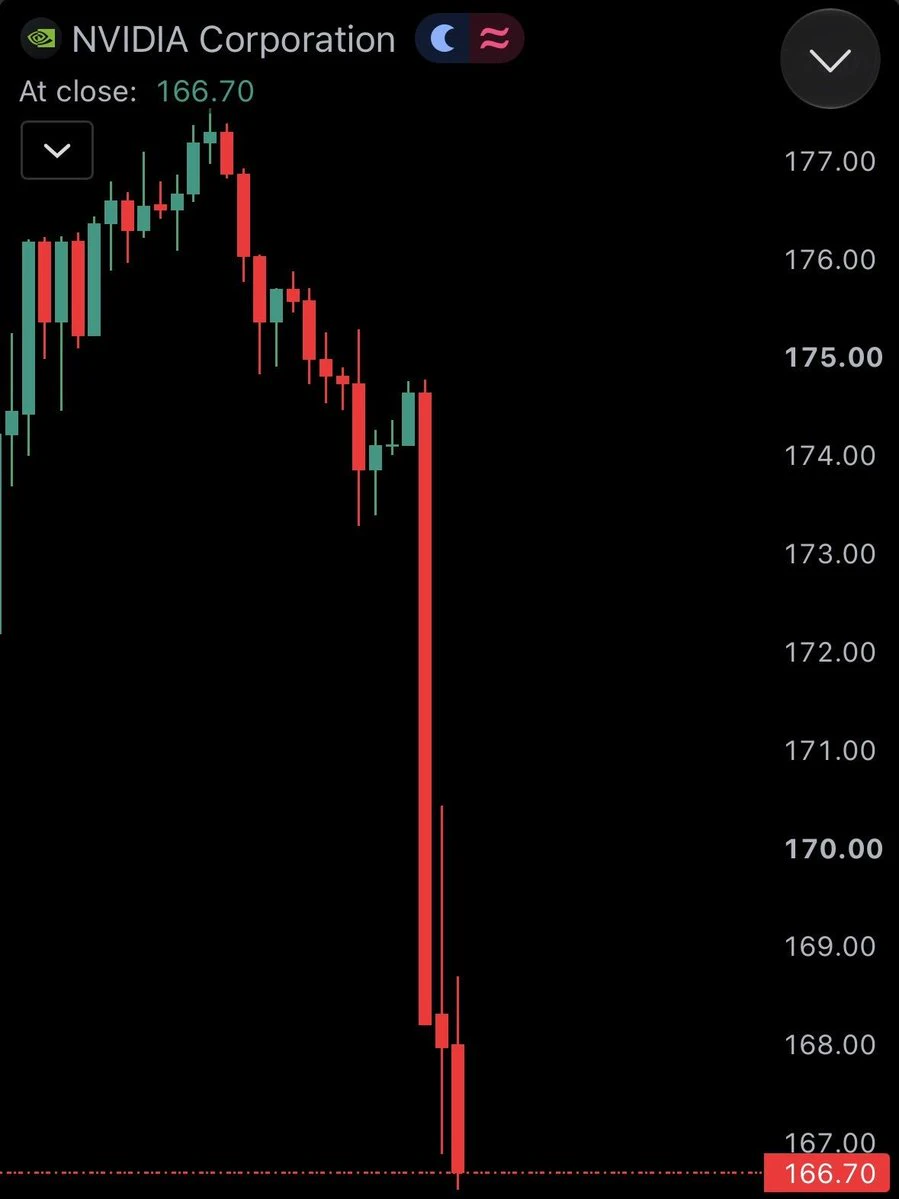
$NVDA has now lost roughly $600 billion in market value since the Jensen Huang saga began.
And things are getting worse.
After reports that its board was preparing to remove Huang as CEO, the stock dropped another 8% in after-hours trading, taking its valuation towards $3.6 trillion.
Huang is taking a massive hit personally too.
He owns roughly 3.6% of Nvidia, worth well over $130 billion at recent prices.
With $600 billion wiped off the company's market value, the value of his stake has fallen by approximately $21.6 billion.
And investors could be looking at an even bigger dip.
Wedbush analy
post-image
NVDA+2.99%
A bank is reportedly moving into stablecoins; $ENA is down 6.188%, and I’m bullish
Well, the news 9 hours ago: UK bank Griffin is reportedly raising $20 million in a Series B round and plans to issue cards and launch a stablecoin. $ENA isn’t buying it at all. It’s currently at 0.1425, down 6.188% over 24 hours and hovering near 0.1408. The bullish news can’t move the price, so I’m leaning bullish here. While others sell at a loss, I’ll buy the dip.

The price really is low—the 30-day range position is just 0.02, down 31.98% over 30 days, and the Fear & Greed Index is only 28. Deep in the extre
ENA+8.04%
The downtrend is pretty brutal. I wouldn’t add to my position at all; averaging down as it keeps falling can easily lead to big trouble.

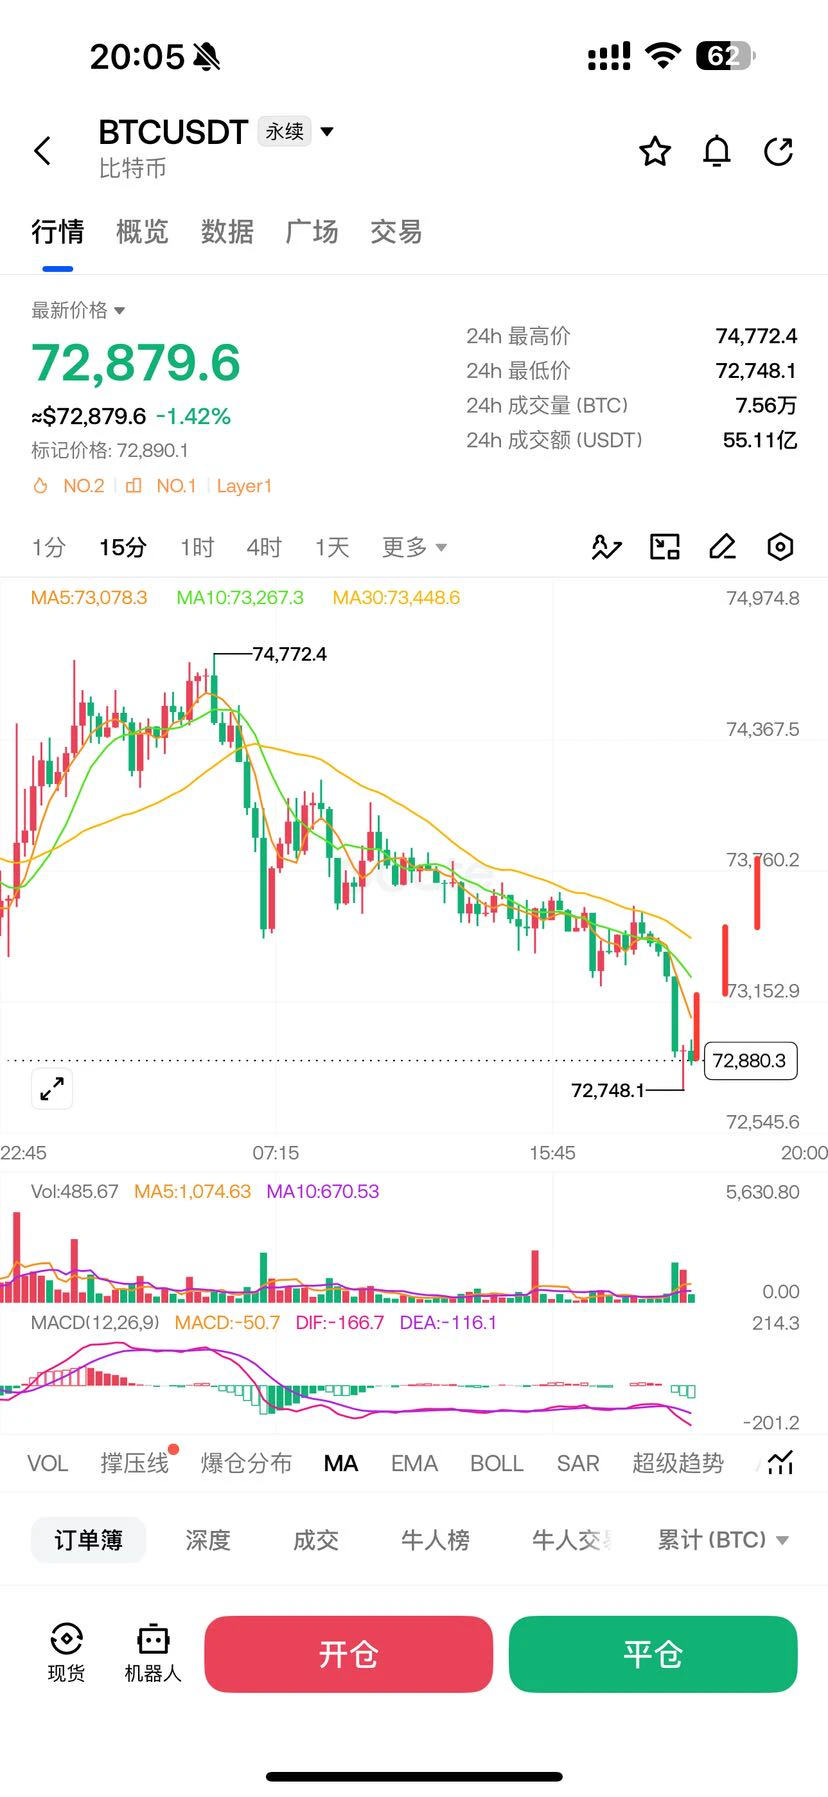
I was betting on a short-term long, but that has failed, so I need to change my approach. If it rebounds to my entry price, I should reverse and open a short. At the latest, I should reverse at 73700 or 73600.

I urgently need a big bullish candle like this. I opened the long at 73500 in too much of a hurry$BTC
post-image
BTC-0.65%
Imagine you are walking down the street and suddenly spot something unusual
Maybe a dog wearing sunglasses a funny sign or even a sofa sitting at a bus stop 😂
Normally, you would just take a photo and keep walking
But with @onlystreetsfun that little moment can become a coin
Just open the app, snap a picture, give it a name and ticker, and launch it right there
No uploads, no complicated steps. Just real moments from real streets turning into something the internet can share
I like this idea. You never know what you might find on your next walk
post-image
BTC Falls Below $100,000, 150,000 Liquidated — The Market Voted Before the Data Was Released

During the Asia-Pacific session on November 12, BTC fell below $103,000 and briefly lost the $100,000 level, down nearly 4% on the day. CoinGlass data showed 153,000 liquidations across the market over 24 hours, totaling $479 million, including $382 million in long liquidations and $118 million in short liquidations.

The long-to-short liquidation ratio exceeded 3:1. This is a very clear signal: leveraged positions were heavily skewed long ahead of the data release, and the market cleaned itself out w
AMD+7.27%
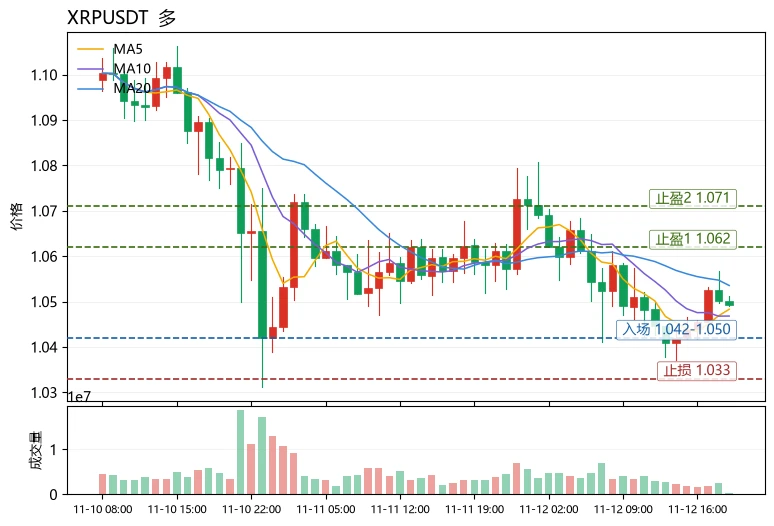
Many people treat funding rates as a “long/short sentiment gauge” to buy bottoms and sell tops, but this is a misconception. Funding rates only reflect the cost of holding positions; what really matters is the long/short turnover near moving averages and the location of liquidation bands. $XRP The current price is 1.0492. The +0.0100% funding rate indicates that longs are still paying to hold positions, but MA5=1.0483 remains below MA20=1.05355, so a trend reversal is not confirmed; RSI=45.2 is neutral to weak, while the MACD histogram at +0.0003738 has turned positive, a typical phase of “fad
post-image
XRP-1.12%
ENA+8.04%
UNI+3.05%
Load More

Join 40 M users in our growing community

⚡️ Join 40 M users in the crypto craze discussion

💬 Engage with your favorite top creators

👍 See what interests you

Trending Topics

GateIPOAccessAnthropic

254.8K Views2.4K Discussing

Gate IPO Access Phase 3 features Anthropic (ANT), with USDT subscription interest starting from 100 USDT. Successful allocations will be delivered as real shares to Gate Stock Accounts. Indicative price: $70–$78/share Subscription: Nov 12–17 (UTC+8) Allocation is not guaranteed. Please manage risk accordingly.

USJoblessClaimsTonight

169.8K Views33K Discussing

GateOctoberTransparencyReport

240.2K Views1.9K Discussing

View More