Square
Following
Hot
News
Profile

CryptoAngle

vip
Active for: 0.2y
Peak Tier 0
No content yet
6
Following
264
Followers
860
Liked
[ NEW STREAMER ] TODAY MARKET TALK
live-cover
LIVE1,993
[ NEWSTREAMER ] STREAMER PREDICTION
live-replay-cover
163 views10-07 07:13
00:30:48
[ NEW STREAMER ] MARKET PREDICTION
live-replay-cover
182 views10-07 06:31
00:30:41
[NEW STREAMER ] BTC MARKET UPDATE
live-replay-cover
168 views10-07 05:48
00:31:49
[ NEW STREAMER ]MARKET UPDATES
live-replay-cover
137 views10-07 04:59
00:30:06
[ NEW STREAMER ] NEW MARKET UPDATE
live-replay-cover
114 views10-07 03:41
00:11:47
[ NEW STREAMER ] TODAY MARKET TALK
live-replay-cover
257 views10-07 02:29
01:00:59
#ShareWeekly #PlanYourTradesThisWeek
RLC (iExec RLC) has been the most interesting small-cap move on my watchlist this week. It is now trading around $0.72, while the 24-hour high touched $0.79 and the low held $0.3704 — meaning the token pumped nearly 100% in a single day, taking the 7-day total gain to roughly 109%. With a market cap of only about $63 million, this kind of move feels sharp and explosive.
Why did it rise so fast? My read points toward a short squeeze. Open interest surged over 1,175% in 24 hours and funding has been running negative, both signs of heavy short positioning. O
CryptoMishu
#ShareWeekly #PlanYourTradesThisWeek
RLC (iExec RLC) has been the most interesting small-cap move on my watchlist this week. It is now trading around $0.72, while the 24-hour high touched $0.79 and the low held $0.3704 — meaning the token pumped nearly 100% in a single day, taking the 7-day total gain to roughly 109%. With a market cap of only about $63 million, this kind of move feels sharp and explosive.
Why did it rise so fast? My read points toward a short squeeze. Open interest surged over 1,175% in 24 hours and funding has been running negative, both signs of heavy short positioning. Once price broke out of its old $0.39 range and pushed higher, shorts were forced to cover and that fuel fed the squeeze. Before this, RLC had been quietly ranging between $0.35 and $0.39 for a week, which is why the breakout felt so sudden.
The real question is how high it can go. The trend is still intact — the daily MACD has printed a golden cross and ADX is elevated, which shows strong momentum. But the daily RSI has climbed near 90, deep into overbought territory, and price is trading well above its upper Bollinger band. That raises the risk of a short-term pullback, and blind chasing at this level is not part of my strategy.
My plan is simple. If price breaks above the $0.79 high and holds $0.80 on volume, the next target zone opens up around $0.85 to $1.00. If $0.70 breaks instead, the first support sits near $0.55, followed by the old breakout zone at $0.39 to $0.40. For momentum traders there are two clean setups — either wait for a confirmed break of $0.79, or look for a dip-buy near the $0.55 to $0.60 area. Both are better than entering blindly at $0.72.
Risk management is everything here. Low-cap pumps like this have thin liquidity, and what goes up fast can come back down just as quickly. Keep position sizes small, always set a stop loss, and lock in profits as they build. This is my technical read, not financial advice — do your own research and only risk what you can afford to lose.#OneGateWitnessProgram
repost-content-media
RLC+37.05%
#BTCBreaksThrough$86,000
Bitcoin at $86,000: Breakout Confirmation or Just Another Test?
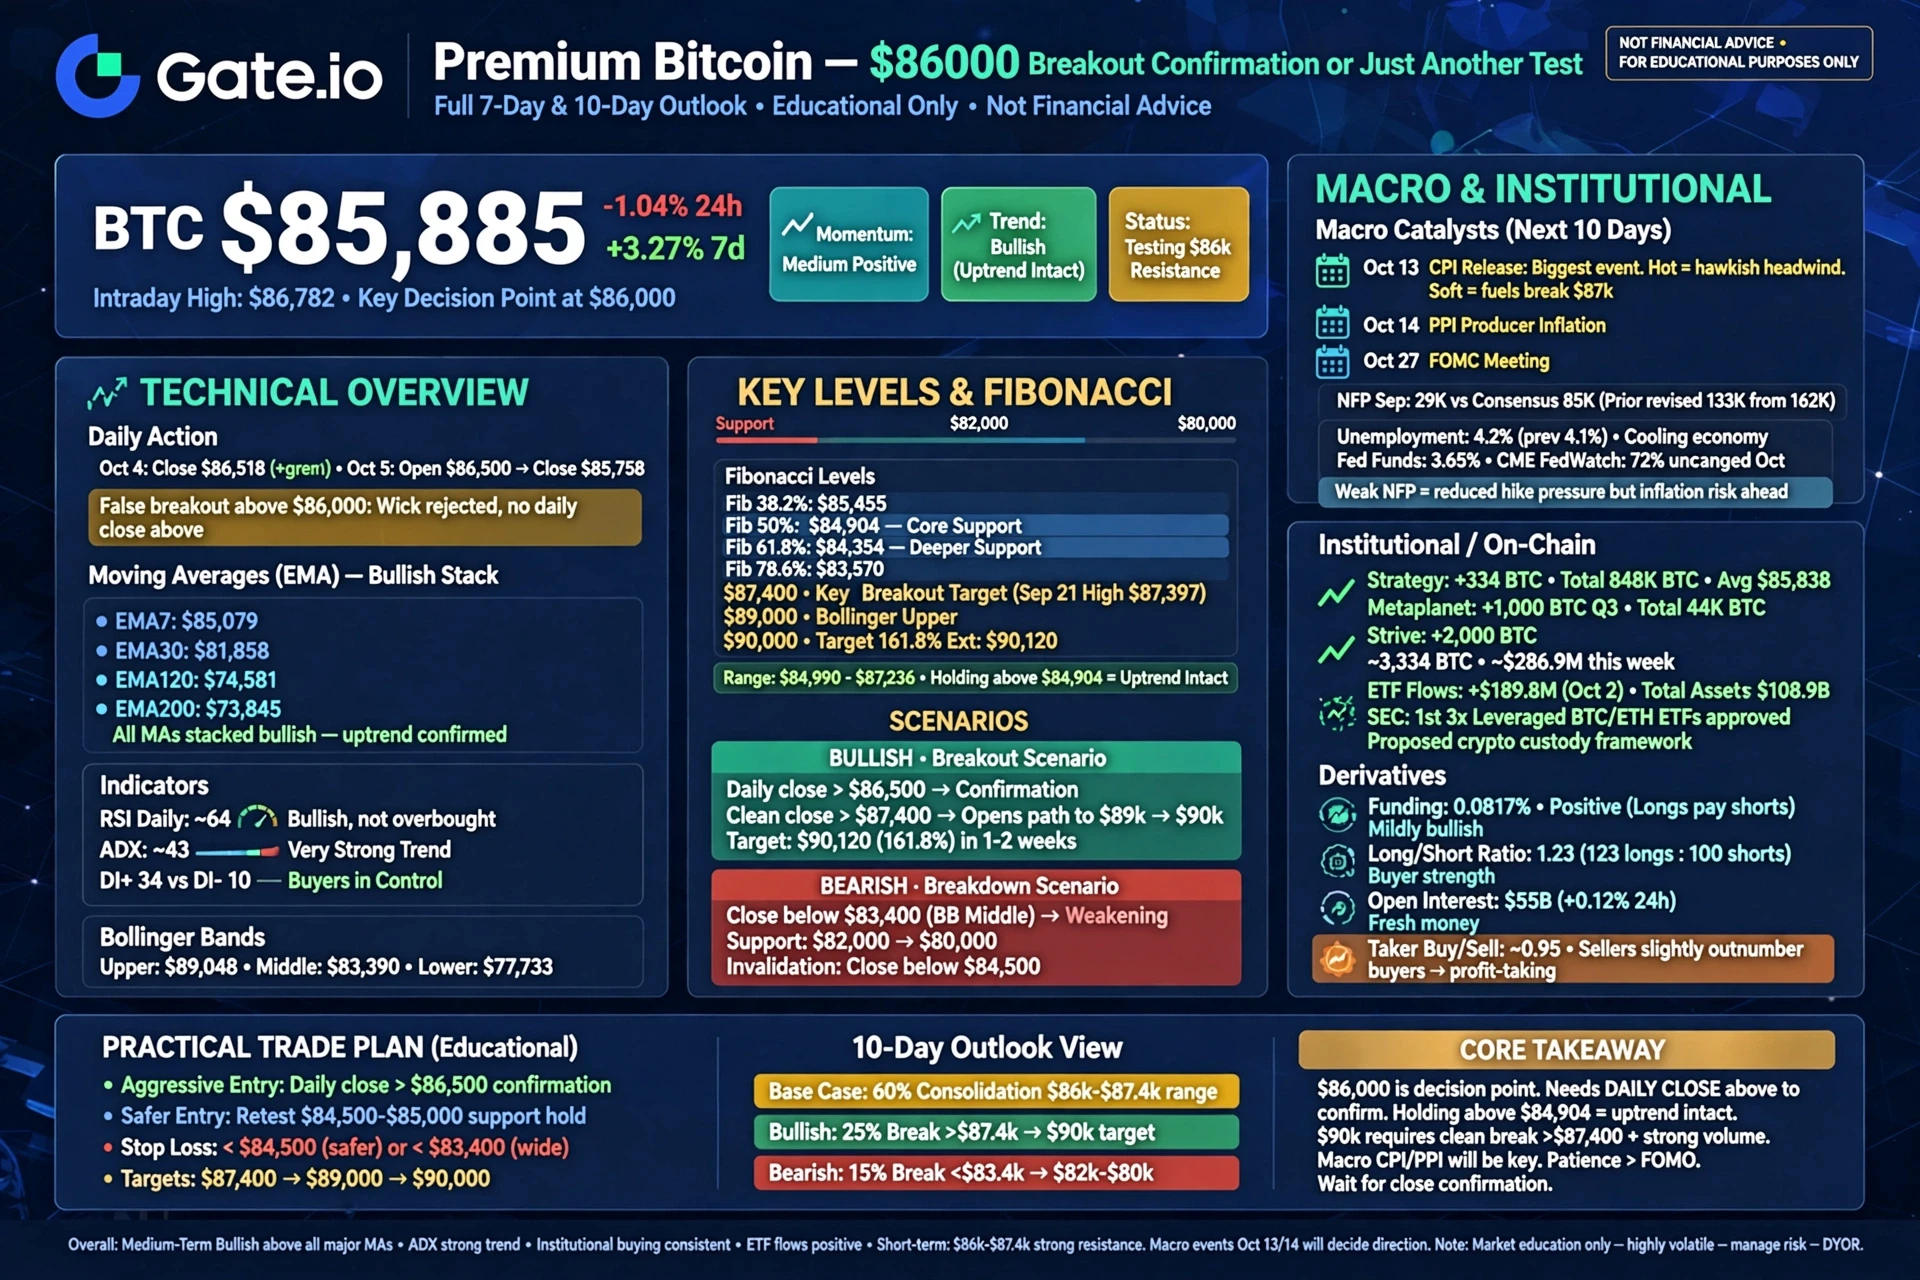
Bitcoin touched the $86,000 level again over the last 24 hours, spiking to an intraday high of $86,782, but it is now trading around $85,885, down about 1.04% over 24 hours. Over the last seven days Bitcoin is still up about 3.27%, so medium-term momentum stays positive even though the short-term picture is mixed. The most important point here is not just that price moved above $86,000; it is whether price can hold and close above that level. Looking at the daily candles, on October 4 Bitcoin closed at $
CryptoMishu
#BTCBreaksThrough$86,000
Bitcoin at $86,000: Breakout Confirmation or Just Another Test?
Bitcoin touched the $86,000 level again over the last 24 hours, spiking to an intraday high of $86,782, but it is now trading around $85,885, down about 1.04% over 24 hours. Over the last seven days Bitcoin is still up about 3.27%, so medium-term momentum stays positive even though the short-term picture is mixed. The most important point here is not just that price moved above $86,000; it is whether price can hold and close above that level. Looking at the daily candles, on October 4 Bitcoin closed at $86,518, a positive close, but on October 5 it opened at $86,505 and closed at $85,758. The market tried to break $86,000 but has not yet sustained a daily close above it. This is the scenario every trader knows: a breakout only counts when it holds, and a move that fails to hold is false breakout or just a wick.
If we look at the seven-day chart, Bitcoin is in a clear uptrend structure. Price is trading above all of its major moving averages: the seven-day exponential moving average (EMA7) sits at $85,079, the thirty-day average (EMA30) at $81,858, the 120-day average (EMA120) at $74,581, and the 200-day average (EMA200) at $73,845. When price trades this far above its EMA200 with all moving averages stacked in proper order, that is a strong bullish signal. The daily Relative Strength Index (RSI) is around 64, which is bullish territory but not yet overbought, meaning there is still room to the upside. The Average Directional Index (ADX) is near 43, which signals a very strong trend, and the positive directional indicator is around 34 while the negative directional indicator is only about 10. This tells us that buyers are clearly in control of the market right now. The daily Bollinger Bands sit at $89,048 (upper), $83,390 (middle), and $77,733 (lower), giving strong resistance near $89,000 and important support around $83,400.
However, there is an important nuance most people ignore. Bitcoin did not just break $86,000 this week; it also made a high of $87,237 on October 2 before pulling back. On October 4 it made a high of $86,788, and on October 5 it made a high of $86,989. A clear pattern is forming: every time price enters the $86,500 to $87,000 zone, selling pressure appears and price slips back toward $85,000. Technically this is building a consolidation range between the recent low of $84,990 and the recent high of $87,236. As long as price does not close above $87,400 on a daily basis, this range will persist, and the journey to $90,000 will only begin after a clean break of $87,400. So touching $86,000 is not enough; holding and closing above $86,000 is what really matters.
Now about the $90,000 target and when Bitcoin can touch it. From a technical perspective, to reach $90,000 price first needs to clear the $87,397 resistance, which was also the high from September 21. After that comes the $89,000 Bollinger upper band, and only then the $90,000 psychological milestone. This is not a one-day job. If Bitcoin delivers a daily close above $86,500 in the coming days, momentum can push toward $87,400, and from there the path to $90,000 can open up. But the realistic view is that this week's macro events, CPI and PPI, could stall price, so I view $90,000 on a weeks-based timeframe, not days, unless a very large positive catalyst appears.
On the macro side, the recent Non-Farm Payrolls (NFP) report was a clear negative surprise. The September jobs report added only 29,000 jobs versus a consensus estimate of 85,000, with the prior reading revised down to 133,000 from 162,000. The unemployment rate ticked up to 4.2% from 4.1%. This is a weak jobs number that signals the economy is cooling. But for crypto the impact is double-edged: on one hand weak data means the economy is slowing, which can be negative for risk assets, but on the other hand it also means the Federal Reserve is less likely to rush into further rate hikes, which is positive for liquidity. The Fed funds rate is currently held at 3.65%, and according to the CME FedWatch tool there is about a 72% chance rates stay unchanged at the October meeting. This is an environment of uncertainty, and that is exactly why Bitcoin is hovering around $86,000 rather than confidently pushing higher.
For the next ten days, keep an eye on the events that will affect Bitcoin. On October 13 the CPI report arrives, and this is the single biggest event because if inflation comes in hot, the Fed's hawks could grow stronger, which is a headwind for crypto, while a softer inflation print could give Bitcoin the fuel to break $87,000. On October 14 the PPI report arrives, which shows producer-level inflation. After that, focus shifts to the FOMC meeting on October 27. In addition, oil is trading above $100 a barrel and the ten-year Treasury yield is around 5.17%, and both of these factors pull capital away from risk assets toward bonds and commodities, which creates negative pressure for Bitcoin. So the macro picture is neutral to slightly cautious right now, and that is precisely why a decisive close above $86,000 has not arrived.
On the institutional and on-chain side, however, the story is quite positive. Michael Saylor's Strategy just bought another 334 Bitcoin, bringing its total holdings to 848,000 Bitcoin, with an average purchase price of $85,838, meaning the company is accumulating right around these levels. Japan's Metaplanet added a net 1,000 Bitcoin in the third quarter, bringing its total to 44,000 Bitcoin. Strive bought 2,000 Bitcoin. Combined, these players added roughly 3,334 Bitcoin, worth about $286.9 million, in just this week alone. When large players are buying at these levels, that is a strong support signal. ETF flows are also positive, with a net inflow of about $189.8 million on October 2, and total Bitcoin ETF assets near $108.9 billion. On the regulatory side there is positive news as well: the SEC approved the first-ever 3x leveraged Bitcoin and Ethereum ETFs, and it proposed a new framework for crypto custody. All of these are long-term bullish signals.
Now let us move to the practical part: entry, exit, and stop-loss levels. I am not giving personalized financial advice here; these are technical levels that become visible when reading the chart. For an aggressive entry, the best confirmation is a daily candle close above $86,500, because that is the genuine breakout confirmation. For a safer entry, a retest of the $84,500 to $85,000 support zone is better, because price has repeatedly bounced from there. For a stop loss, it can be placed below $84,500, or below $83,400 (the Bollinger middle band) if you want more room. For targets, the first target is $87,400, the second is $89,000, and after that $90,000. But also remember: if Bitcoin delivers a daily close below $83,400, that would be a sign of weakening bullish momentum, and from there the risk of a slide toward $82,000 and then $80,000 can build.
Looking at the derivatives data adds more texture. The funding rate is currently about 0.0817%, which is positive, meaning long traders are paying short traders and the market has a mildly bullish bias. The long/short ratio is 1.23, so for every 100 short positions there are about 123 long positions, showing growing buyer strength. Open interest is around $55 billion and rose about 0.12% over 24 hours, meaning fresh money is entering the market. But there is also a warning signal: the taker buy/sell ratio is about 0.95, meaning in immediate market orders sellers are slightly outnumbering buyers. This tells us that profit-taking is still happening at these levels, which is exactly why price keeps slipping back after moving above $86,000.
The Fibonacci levels, which I calculated from fresh daily data, give us a useful map. Over the last ten days the swing low is $82,572 and the swing high is $87,237. Based on this range, the 38.2% retracement is $85,455, the 50% retracement is $84,904, and the 61.8% retracement is $84,354. These three levels are important support zones if price pulls back. On the upside, the Fibonacci extensions show the 127.2% extension at $88,505 and the 161.8% extension at $90,120. This is very interesting because the 161.8% extension lands right around $90,000, which means Fibonacci is essentially confirming that $90,000 is Bitcoin's natural next major target. The 78.6% retracement sits at $83,570, which is a deeper support zone if the market corrects more aggressively.
The real point about market structure is that Bitcoin has built an uptrend from $82,572 to $87,237 over the past ten days, a move of roughly 5.60%. Within this uptrend, price is currently around $85,885, which is about 71% of the way up the range, meaning price is still in the upper half, which is a bullish sign. As long as price holds above $84,900 (the 50% retracement), the uptrend remains intact. The daily RSI at 64 is in healthy bullish territory, and the MACD is showing positive momentum. Institutional support reinforces this: Strategy's average buy price is $85,838, so the company buys right around these levels, and ETF flows show positive daily inflows.
The trading setup's core meaning is that $86,000 is not just a number; it is a decision point. If this level holds with a daily close, buyer confidence will grow further and the path to $87,400 and then $90,000 will open. If this level keeps getting rejected, as is happening right now, that is a warning sign of a false breakout and price can come back to test the $84,500 to $85,000 support. That is why entering immediately above $86,000 on FOMO is risky; it is better to wait for a close confirmation. Touching $86,000 is not enough; closing and sustaining above $86,000 is what truly matters.
My overall view is that Bitcoin's medium-term trend is bullish because price is above all its major moving averages, the ADX is strong, institutional buying is consistent, and ETF flows are positive. But in the short term, the $86,000 to $87,400 resistance zone is quite strong, and the macro events on October 13 (CPI) and October 14 (PPI) will decide the direction this week. The weak NFP reading has reduced the pressure on the Fed to hike rates, which is supportive, but the inflation data is still ahead of us. My view is that until a daily close above $86,000 arrives, the market will consolidate in this range, and the next big move will come only after a clean break of $87,400 or a clean breakdown below $83,400. $90,000 is a realistic target, but to get there Bitcoin first needs a strong break of $87,400 and a clear move through $89,000, and this is likely a matter of weeks rather than a single week.
#OneGateWitnessProgram #ShareWeekly #PlanYourTradesThisWeek
repost-content-media
#BitmineAddsMoreETH,HoldingsTop6.01M
BITMINE NOW HOLDS 6 MILLION ETH — IS ETH READY FOR THE NEXT BIG MOVE?
Bitmine Immersion Technologies has crossed one of the most important Ethereum treasury milestones ever recorded: more than 6 million ETH.
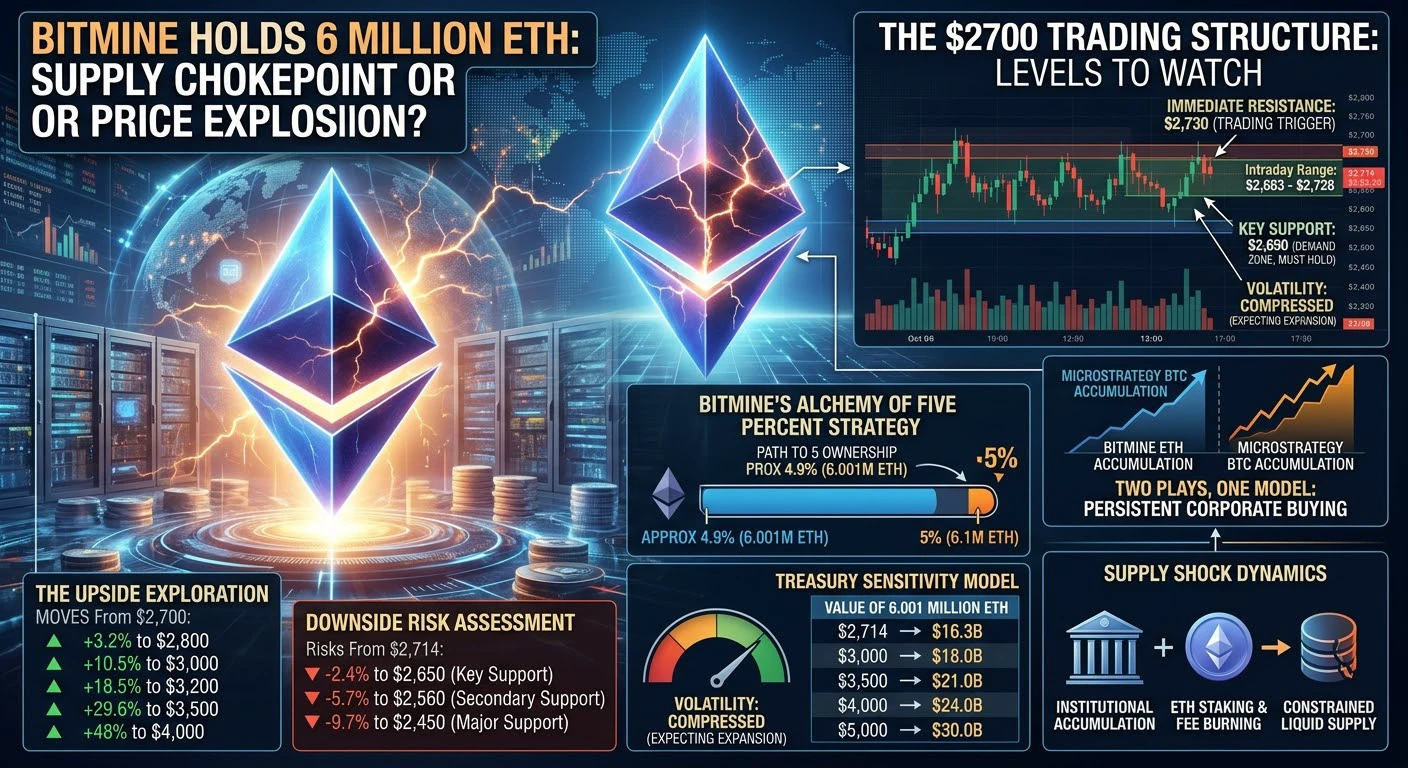
The company now holds approximately 6.001 million ETH, turning Bitmine into one of the most aggressive institutional Ethereum accumulators in the world. At an ETH price around $2,700, that treasury represents roughly $16.2 billion in market value.
But the real story is not simply the $16 billion number.
The real story is what happens when one public co
CryptoMishu
#BitmineAddsMoreETH,HoldingsTop6.01M
BITMINE NOW HOLDS 6 MILLION ETH — IS ETH READY FOR THE NEXT BIG MOVE?
Bitmine Immersion Technologies has crossed one of the most important Ethereum treasury milestones ever recorded: more than 6 million ETH.
The company now holds approximately 6.001 million ETH, turning Bitmine into one of the most aggressive institutional Ethereum accumulators in the world. At an ETH price around $2,700, that treasury represents roughly $16.2 billion in market value.
But the real story is not simply the $16 billion number.
The real story is what happens when one public company continues removing millions of ETH from the liquid market while Ethereum itself remains one of the most important settlement networks in crypto.
Bitmine is now holding close to 4.9% of Ethereum’s total supply. Its long-term objective is even more aggressive: the Alchemy of Five Percent strategy, targeting ownership of approximately 5% of all ETH.
That means Bitmine is now extremely close to a target that once looked almost impossible.
And this is where the numbers become interesting.
If ETH is worth $2,700, every additional 100,000 ETH represents approximately $270 million of exposure.
If ETH reaches $3,000, the same 100,000 ETH becomes $300 million.
At $3,500, it becomes $350 million.
At $4,000, it becomes $400 million.
So when Bitmine adds another 100,000 ETH, it is not simply adding tokens to a wallet. It is increasing its exposure to ETH by hundreds of millions of dollars at different market valuations.
That is the scale of this strategy.
And there is another important factor.
Bitmine is not simply buying ETH and waiting.
Its strategy also involves staking through its institutional validator infrastructure. This creates the possibility of earning staking yield while maintaining exposure to Ethereum’s long-term price appreciation.
That gives the treasury model two potential engines:
ETH price appreciation + staking income.
This is one reason the Bitmine strategy is increasingly being compared with Strategy’s Bitcoin accumulation model.
Strategy showed the market what persistent corporate accumulation can do for Bitcoin.
Now Bitmine is attempting something similar with Ethereum.
But Ethereum has a different investment story.
Bitcoin is primarily a scarce digital monetary asset.
Ethereum is both an asset and a blockchain infrastructure layer.
ETH is used throughout decentralized finance, stablecoins, tokenized real-world assets, smart contracts and a growing institutional settlement ecosystem.
That means Bitmine is not simply betting on the price of a cryptocurrency.
It is effectively betting that Ethereum’s economic network will become significantly more valuable over time.
NOW LET’S LOOK AT THE PRICE.
ETH is currently trading around $2,714.
The recent intraday high is around $2,728, while the intraday low is around $2,683.
That puts Ethereum directly below an important resistance zone.
The first battle is $2,730.
A strong daily close above $2,730 would be an important bullish signal because it would confirm that buyers are finally absorbing the supply around the $2,700–$2,730 region.
From $2,730, the next target is $2,800.
A move from $2,714 to $2,800 would represent approximately +3.2%.
If ETH breaks $2,800 and momentum accelerates toward $3,000, that would represent approximately +10.5% from the current price.
That is where the chart could become much more interesting.
A breakout from $2,730 to $3,000 would be roughly +10.5%.
A move from $2,700 to $3,200 would be approximately +18.5%.
A move from $2,700 to $3,500 would be approximately +29.6%.
And if Ethereum eventually reaches $4,000, the upside from approximately $2,700 would be close to +48%.
These are not guaranteed targets. They are scenario levels that become increasingly realistic only if momentum, liquidity, Bitcoin and institutional demand all move in the same direction.
THE $2,650 LEVEL IS JUST AS IMPORTANT.
Ethereum has been defending the $2,650 area, making it one of the most important short-term demand zones.
From $2,714 down to $2,650 is approximately -2.4%.
If ETH holds $2,650 and buyers step in, that would keep the current bullish structure alive.
But if $2,650 breaks decisively with heavy selling volume, the next zone I would watch is approximately $2,560.
That represents roughly -5.7% from $2,714.
Below $2,560, the $2,450 area becomes important.
A decline from $2,714 to $2,450 would be approximately -9.7%.
This is why I am not simply saying “Bitmine is buying, therefore ETH must go up.”
Markets do not work that way.
Bitmine can create long-term demand, but short-term price still depends on liquidity, Bitcoin, derivatives positioning, macroeconomic conditions and overall risk appetite.
THE TECHNICAL SETUP IS GETTING INTERESTING.
Ethereum has recently traded inside a relatively tight range between approximately $2,650 and $2,775.
The October 2 session produced a high around $2,765–$2,775 and a low near $2,652, showing just how important this region has become.
Recent daily moves have also remained relatively controlled, with ETH posting approximately +0.7%, +1.5%, then -0.6% and another modest decline across recent sessions.
That tells me volatility has compressed.
And compressed volatility does not remain compressed forever.
Eventually, the market normally chooses a direction.
The question is whether the next expansion happens above $2,730 or below $2,650.
For me, $2,730 is the trigger.
Above $2,730: bullish momentum strengthens.
Above $2,800: $3,000 becomes the major psychological target.
Above $3,000: $3,200 becomes the next major expansion zone.
Above $3,200: $3,500 becomes possible if Bitcoin and liquidity remain supportive.
Above $3,500: $4,000 becomes the bigger psychological objective.
On the downside:
Below $2,650: caution.
Below $2,560: bearish pressure increases.
Below $2,450: the short-term bullish structure would require a serious reassessment.
THIS IS WHERE BITMINE BECOMES IMPORTANT.
Imagine Ethereum reaches $3,000.
Bitmine’s 6.001 million ETH treasury would then be worth approximately $18.0 billion.
At $3,500, that same treasury would be worth approximately $21.0 billion.
At $4,000, approximately $24.0 billion.
At $5,000, approximately $30.0 billion.
Every $100 move in ETH changes the theoretical market value of 6.001 million ETH by approximately $600 million.
Think about that.
A $500 move in ETH would change the value of Bitmine’s current holdings by roughly $3 billion.
A $1,000 move would change it by roughly $6 billion.
That is why this treasury is becoming such an important market story.
Bitmine has effectively created enormous sensitivity to Ethereum’s price.
And if the company continues buying every week, its sensitivity becomes even larger.
THE SUPPLY STORY IS ALSO IMPORTANT.
Ethereum has roughly 122 million ETH in total supply.
If Bitmine controls approximately 6 million ETH, that is close to 4.9% of total supply.
If it reaches the 5% target, it would control roughly one out of every twenty ETH.
That is an extraordinary concentration.
But there is another side to the equation.
Ethereum also has ETH locked in staking, while its fee-burning mechanism can remove ETH from circulation during periods of strong network activity.
Therefore, the amount of ETH actually available as liquid supply can be much more important than simply looking at total supply.
If institutional buyers continue accumulating while liquid supply remains constrained, the market can become increasingly sensitive to relatively small changes in demand.
This is the part of the Bitmine story that deserves the most attention.
The market is watching a real-time supply experiment.
One large public company is systematically acquiring ETH.
Meanwhile, other institutions are gaining exposure through regulated investment products and traditional financial channels.
If these two trends continue together, Ethereum’s market structure could become increasingly institutionally driven.
MY TRADING VIEW
I remain bullish on ETH while price holds above $2,650.
I would become significantly more bullish after a confirmed daily close above $2,730.
The first upside objective would be $2,800, followed by $3,000.
A sustained break above $3,000 could shift the market into a stronger momentum phase, with $3,200 and $3,500 becoming realistic extension zones.
The $4,000 level is the bigger long-term psychological target, but I would only consider that scenario if institutional demand, liquidity and the broader crypto trend remain strongly supportive.
On the other hand, I would not ignore a breakdown.
A loss of $2,650 would weaken the immediate setup.
A break below $2,560 would increase downside risk toward $2,450.
And if Bitcoin enters a major correction, ETH could fall even if Bitmine continues buying.
That is why I prefer structure over hype.
BITMINE’S 6 MILLION ETH IS NOT A GUARANTEE.
It is a signal.
It is a signal that institutional conviction in Ethereum is becoming much larger.
The company is essentially saying that it wants to own approximately 5% of the entire Ethereum supply.
And now it is already around 98% of the way toward that objective.
The next milestone could therefore be even more important than the 6 million ETH milestone itself.
5%.
One company.
Approximately one-twentieth of the entire ETH supply.
If Bitmine reaches that target while Ethereum is trading above $3,000, the value of the treasury would be around $18 billion.
At $4,000, it would be around $24 billion.
At $5,000, around $30 billion.
Those numbers show why this story deserves attention.
For Ethereum traders, I am watching $2,730.
For ETH bulls, $2,800 is the next confirmation zone.
For momentum traders, $3,000 is the major psychological breakout level.
For longer-term investors, $3,500 and $4,000 are the bigger upside zones.
For risk management, $2,650, $2,560 and $2,450 are the levels I would not ignore.
The setup is simple:
Above $2,730, momentum can expand.
Above $2,800, $3,000 comes into focus.
Above $3,000, the market can start targeting $3,200–$3,500.
Below $2,650, caution increases.
Below $2,560, the bullish structure weakens.
And below $2,450, I would completely reassess the trend.
Bitmine has already made its move.
6 million ETH.
Nearly 4.9% of Ethereum’s total supply.
A target of 5%.
Approximately $16 billion in ETH exposure at current prices.
Potentially $18 billion at $3,000.
Approximately $21 billion at $3,500.
Approximately $24 billion at $4,000.
Approximately $30 billion at $5,000.
This is no longer just a corporate treasury story.
It is becoming part of Ethereum’s market structure.
Now the only question is whether ETH can turn this institutional demand into the next major price expansion.
For me, the first answer comes at $2,730.
Break that level with volume, and the next battle begins at $2,800.
Break $2,800, and $3,000 becomes the number everyone will be watching.
The Ethereum story is getting bigger.
And Bitmine is making sure the market cannot ignore it.
Data note: ETH market data used above is based on October 6, 2026 market readings; Bitmine’s 6M+ ETH milestone was reported after its latest purchase. #OneGateWitnessProgram #ShareWeekly
repost-content-media
#CFTCProposesNew���CryptoAssetMarket”Category
CFTC JUST OPENED A NEW CHAPTER FOR US CRYPTO MARKETS
The biggest crypto story right now may not be a new token, ETF or price breakout.
It may be regulation.
On October 5, 2026, the US Commodity Futures Trading Commission introduced a proposed framework built specifically around crypto markets, including two important concepts: Regulation CTX and Regulation CAM, alongside a proposed “Crypto Asset Market” category.
In my view, this is important because the CFTC is not simply talking about crypto regulation in general. It is trying to define how a sp
CryptoMishu
#CFTCProposesNew���CryptoAssetMarket”Category
CFTC JUST OPENED A NEW CHAPTER FOR US CRYPTO MARKETS
The biggest crypto story right now may not be a new token, ETF or price breakout.
It may be regulation.
On October 5, 2026, the US Commodity Futures Trading Commission introduced a proposed framework built specifically around crypto markets, including two important concepts: Regulation CTX and Regulation CAM, alongside a proposed “Crypto Asset Market” category.
In my view, this is important because the CFTC is not simply talking about crypto regulation in general. It is trying to define how a specific part of the crypto trading market could operate under a clearer federal framework.
THE CORE IDEA: CRYPTO ASSET MARKET
The proposed Crypto Asset Market category is aimed at certain crypto trading activities involving retail customers and leveraged, margined or financed exposure.
The objective is to create a clearer federal pathway for eligible platforms rather than leaving market participants to navigate uncertainty across different regulatory requirements.
One important point is that this pathway would be optional.
The proposal does not automatically force every crypto exchange into the framework. Eligible platforms could choose whether to pursue the proposed federal registration route.
That makes adoption one of the biggest questions.
If major platforms participate, the framework could become much more significant for the US crypto industry.
REGULATION CTX: THE TRANSACTION SIDE
Regulation CTX, or Crypto Asset Transactions, focuses on retail commodity transactions involving crypto assets that are financed, margined or leveraged.
This matters because leveraged trading creates risks that are very different from ordinary spot buying.
A trader purchasing $1,000 of spot Bitcoin has direct exposure to the asset.
A trader using leverage can control a much larger position, creating additional liquidation, counterparty and market-risk concerns.
The CFTC is therefore attempting to establish clearer rules around these transactions.
One particularly important element is the proposed treatment of delivery.
The framework considers delivery of a crypto asset to a customer's own non-custodial wallet within 28 days as actual delivery.
For crypto users, this is significant because it recognises the unique ability of digital assets to be transferred directly into a wallet controlled by the customer.
For regulators, it creates a clearer definition of delivery within a digital-asset environment.
REGULATION CAM: THE MARKET STRUCTURE SIDE
Regulation CAM, or Regulation Crypto Asset Markets, addresses the trading platform itself.
Under the proposal, qualifying crypto markets could have an optional federal registration pathway within the CFTC's Designated Contract Market framework.
But that pathway would come with responsibilities.
The proposed framework includes areas such as proof of reserves, anti-money-laundering controls, market surveillance, anti-manipulation measures and customer-trade intermediation through registered Futures Commission Merchants.
This makes CAM much more than a simple licensing proposal.
It is an attempt to establish what a regulated crypto trading venue should actually look like.
PROOF OF RESERVES COULD BE A MAJOR CHANGE
For me, proof of reserves is one of the most important parts of the proposal.
Crypto markets have already shown what can happen when users cannot properly understand the financial condition of a platform.
A stronger reserve-verification framework could improve transparency and give users, institutions and regulators better visibility into customer assets.
It does not eliminate every risk.
But it could reduce uncertainty around whether platforms have sufficient assets to support their obligations.
That could become particularly important for institutional participation.
WHY FCM INTERMEDIATION MATTERS
The proposed role of registered Futures Commission Merchants could add another layer of regulated infrastructure between customers and the trading market.
This could increase compliance and operational costs, but it may also make crypto markets easier for traditional financial institutions to understand and access.
For institutional capital, predictable infrastructure matters.
Regulation alone does not bring capital into a market.
Clear rules, custody, reporting, surveillance and risk controls create the infrastructure that allows capital to participate with greater confidence.
THE LEVERAGE QUESTION IS STILL OPEN
Another major issue is leverage.
The CFTC has not simply imposed one fixed leverage limit through this proposal.
Instead, it is seeking feedback on what restrictions should apply.
This creates a difficult balance.
Excessive leverage can increase retail losses, liquidations and systemic risk.
But extremely restrictive leverage could push sophisticated traders toward offshore platforms.
The final approach could therefore affect liquidity, competition, trading volume and where US customers choose to trade.
This is one of the most important areas I will be watching as the proposal develops.
WHAT THE PROPOSAL DOES NOT SOLVE
This is just as important as what it does.
The proposal does not create a universal federal framework for every crypto transaction.
Its main focus is certain retail transactions involving financing, margin or leverage.
Ordinary spot crypto trading without those features is not automatically brought under this new category.
The broader US crypto market-structure debate therefore remains unfinished.
Congress also remains important because the CFTC cannot simply require every crypto asset to trade on a CFTC-regulated platform without the necessary congressional authority.
So this is a major step, but it is not the final rulebook.
THE BIGGEST POTENTIAL BENEFIT
The biggest potential benefit is regulatory clarity.
For years, uncertainty has been one of the biggest challenges for the US crypto industry.
Exchanges need to understand the rules before building infrastructure.
Institutions need predictable compliance requirements before deploying capital.
Traders need confidence that platforms operate under meaningful standards.
A clearer federal framework could reduce some of that uncertainty.
It could also make the US market more attractive to companies and institutions that currently view regulatory complexity as a major barrier.
BUT REGULATION ALSO HAS A COST
There is another side to this story.
Proof-of-reserves systems cost money.
Market surveillance requires technology.
AML compliance requires people and monitoring.
FCM involvement can add additional operational complexity.
Large platforms may be able to absorb these costs more easily than smaller companies.
That means stronger regulation could improve market quality while also increasing consolidation and making competition harder for smaller platforms.
MY MARKET VIEW
I see this announcement as a long-term structural catalyst rather than an immediate price catalyst.
The market has not exploded higher because this is still a proposal.
The framework can change.
Public comments can influence the final direction.
Platforms still have to decide whether they want to participate.
Congress still has a role.
Implementation is still ahead.
That means I would not trade the headline alone.
I would watch whether the proposal begins turning into actual market adoption.
If major exchanges move toward the framework, institutional interest increases and the final rules remain workable, the longer-term impact could be much larger than today's market reaction suggests.
BTC is currently around $85,334, with $86,000–$86,716 acting as the key breakout zone.
ETH is around $2,697, with $2,734 as an important resistance.
SOL is around $119.79, with $122 as the near-term breakout level.
These levels matter for short-term trading, but they are secondary to the regulatory development itself.
MY FINAL TAKE
The most important thing about the CFTC announcement is that it moves the conversation from “How should crypto be regulated?” toward a much more practical question:
“What should a regulated crypto market actually look like?”
CTX focuses on the transaction side.
CAM focuses on the market-structure and platform side.
Proof of reserves focuses on transparency.
Market surveillance focuses on market integrity.
AML controls focus on compliance.
FCM involvement adds another layer of regulated infrastructure.
And the optional federal pathway could give eligible platforms a clearer route into the US regulatory system.
There are still major questions around leverage, implementation, spot markets, compliance costs and congressional authority.
But the direction is important.
If this framework eventually becomes workable and widely adopted, it could help build a more transparent, institution-friendly and clearly structured US crypto market.
For me, that is the real story.
This is not simply about today's Bitcoin candle.
It is about who will build the next generation of US crypto market infrastructure, under what rules, and with what level of transparency.
The CFTC has not finished the rulebook.
But it has started writing a new chapter.
#OneGateWitnessProgram #ShareWeekly
repost-content-media
#英伟达股价新高 Nasdaq Hits a New High, Approaching 27,400: A Three-Way Rally or the Eve of a Bubble?
The Nasdaq hit another all-time high on October 5, 2026. It briefly approached 27,400 points intraday—this was not a slow climb, but nearly a 15% gain in less than three months since the late-July low. Just recently, the market was still debating whether the “tech stock bubble would burst”; now the discussion has become “how far can this rally go?” More interesting is the market structure: this is not a solo performance by one stock, but a collective surge by the five major tech heavyweight stocks—Sp
CryptoMishu
#英伟达股价新高 Nasdaq Hits a New High, Approaching 27,400: A Three-Way Rally or the Eve of a Bubble?
The Nasdaq hit another all-time high on October 5, 2026. It briefly approached 27,400 points intraday—this was not a slow climb, but nearly a 15% gain in less than three months since the late-July low. Just recently, the market was still debating whether the “tech stock bubble would burst”; now the discussion has become “how far can this rally go?” More interesting is the market structure: this is not a solo performance by one stock, but a collective surge by the five major tech heavyweight stocks—SpaceX rose more than 5%, Meta gained over 2%, Tesla and Microsoft climbed nearly 2%, and Nvidia rose more than 1%, again approaching its all-time high.
This broad-based advance is more noteworthy than an index being lifted by a single stock. The core judgment is that this new high is not driven by a single factor,
but by the resonance of three forces: rate-cut expectations, the AI theme, and premium valuations for star stocks.
But each support line has its vulnerabilities.
I The Sharp Turn in Rate Expectations: From 70% to 20%
The most direct catalyst for this rally is the rapid cooling of expectations for Fed rate hikes. Just over a week ago, the market still believed the probability of a rate hike in October was as high as 70%. By this week, that figure had fallen to 20%. Within a week, the market’s view of monetary policy had almost completely reversed. Behind this were two key data points that weakened: · September nonfarm employment came in below expectations, the unemployment rate held at 4.2%, and the labor-force participation rate continued to decline· PCE inflation data came in below expectations, with core PCE at 3.3% year over year, improving for three consecutive months. With inflation moving down and employment moving down, the Fed has less reason to continue raising rates.
For growth stocks, especially tech stocks, each step lower in rate expectations lifts valuations by another step.
But one detail deserves attention: the current federal funds target range is 3.75% - 4.00%, and the market is pricing in “no rate hike,” not yet a “rate cut.” If inflation data reverses, rate-hike expectations could return at any time—wasn’t that exactly what happened before September?
II The AI Theme Returns to the Throne: The Confidence Behind Nvidia’s $5.67 Trillion Market Cap
If rate-hike expectations are the macro backdrop, AI is the fundamental anchor of this rally. Nvidia’s share price hit a new all-time high last Friday, touching $237.88 intraday, bringing its market cap to $5.67 trillion and firmly securing the world’s largest market-cap ranking. This was Nvidia’s first new closing record since May 14. Just over two months ago, at the end of July, Nvidia had retreated nearly 20% from its high on concerns about slowing AI demand, wiping out more than $1 trillion in market value. At the time, the market was filled with talk of an “AI bubble bursting.” In just two months, the story has completely reversed.
Several hard data points are supporting this new high:
Latest quarterly revenue grew 105.9% year over year, while EPS exceeded market expectations
The company announced a record $150 billion buyback, signaling confidence
Morgan Stanley reiterated Nvidia as its “top pick,” with a $300 price target. From the late-July low to now, Nvidia has rebounded nearly 25%. It is the stabilizing force for tech stocks—as long as Nvidia does not collapse, sentiment across the entire AI sector will not dissipate.
III Star Stocks Rise Together: Broad-Based Expansion from SpaceX to Meta
What is most intriguing today is not how much Nvidia rose, but the structure of the stocks topping the gainers’ list. Leading the advance was SpaceX, whose intraday gain expanded to more than 5%. This newly listed stock, which only went public on June 12, once surged to a high of $225 before nearly halving in July, falling to around $108 at its low and shedding more than $1.2 trillion in market value. Now it has returned to the market spotlight. SpaceX’s rally is not based on exactly the same logic as Nvidia’s—it is telling a long-term story combining Starlink, space transportation, and AI infrastructure, with revenue of $18.7 billion in 2025, up 33%. That growth rate is not poor in itself, but compared with a market cap of $1.4 trillion, the valuation is indeed not cheap. Therefore, SpaceX’s sharp rise reflects more of a recovery in market risk appetite—when investors are willing to revalue high-growth stocks with high valuations, the first to move is the one with the greatest elasticity.
Now look at the other names:
Meta rose more than 2%—the dual themes of AI advertising and the metaverse, with its valuation still in a recovery channel
Microsoft rose nearly 2%—the clearest AI commercialization path through Azure cloud and Copilot
Tesla rose nearly 2%—Robotaxi expectations plus its energy business have made the story viable again. This kind of collective rise among heavyweight stocks is much healthier than relying on Nvidia as a lone pillar. But conversely, if these stocks correct at the same time, their drag on the index will also be greater.
IV Three Assumptions: The “Lifeline” for How Far the Rally Can Go
At this point, you may feel that everything looks wonderful. But every pillar of this rally rests on the assumption that “nothing goes wrong.” Stating these assumptions is a responsibility to readers, as well as to the integrity of my own judgment.
Assumption One: Inflation Does Not Rebound
The current downward trend in inflation is clear, but if oil prices, rents, or wage growth unexpectedly rise, core PCE could get stuck above 3%. At that point, the Fed’s choice would not be “whether to raise rates,” but “how many times to raise them.” This is the biggest macro risk.
Assumption Two: AI Capital Spending Does Not Slow
Nvidia’s earnings and the valuation of the entire AI sector are built on the assumption that tech companies will continue increasing their AI investment. If Microsoft, Google, or Meta issues capital-spending guidance below expectations in a given quarter, the entire AI chain will be repriced. Wasn’t that exactly what caused the July correction? Assumption Three: Earnings Growth Keeps Pace
In this round of valuation expansion, valuation expansion has contributed far more to the gains than earnings growth. The Nasdaq has risen nearly 15% from the end of July to now, but the upward revision in corporate earnings expectations over the same period has been nowhere near as large. The faster the rise, the greater the pressure for subsequent earnings to deliver. The third-quarter earnings season is about to begin, and this will be the first test.$NVDA
repost-content-media
#布局本周交易 #每周来晒 BTC October 6 Trading Plan: $1.11 billion Unlock Collides with Fed Officials’ Speeches, Continued Volatility with Long Wicks in Both Directions
21:05 (🔥 highest-risk volatility window of the day) — Fed “No. 3,” New York Fed President Williams, will deliver an important speech.
22:45 — Super-hawkish Fed Governor Bowman will speak. Pay close attention to whether she will go against the market consensus and continue to argue that “the Fed should not abandon its fight against inflation based on a single employment report.”
Throughout the day at irregular times — A $1.11 billion toke
CryptoMishu
#布局本周交易 #每周来晒 BTC October 6 Trading Plan: $1.11 billion Unlock Collides with Fed Officials’ Speeches, Continued Volatility with Long Wicks in Both Directions
21:05 (🔥 highest-risk volatility window of the day) — Fed “No. 3,” New York Fed President Williams, will deliver an important speech.
22:45 — Super-hawkish Fed Governor Bowman will speak. Pay close attention to whether she will go against the market consensus and continue to argue that “the Fed should not abandon its fight against inflation based on a single employment report.”
Throughout the day at irregular times — A $1.11 billion token unlock will test the market with selling pressure. Closely monitor the ability of large orders on exchange order books to absorb the supply, preventing profit-taking by on-chain institutions from triggering widespread bleeding across altcoins.
The market has entered an extremely delicate and critical high-level tug-of-war and shakeout phase, with market structure being pulled to the limit by two macro and capital forces:
Long-side anchor (interest-rate hike risk cleared): Last Friday’s nonfarm payrolls rose by only 29k in a cliff-like slowdown, completely erasing market fears that the Fed would continue tightening in the short term. MicroStrategy remains steadfastly in possession of more than $70 billion worth of assets, while asset management giant Strive defied heavy selling pressure at elevated levels and aggressively swept up $94.5 million at $85,396. Citibank also sharply raised its BTC one-year price target to $113,000. The continued overt bullish positioning by these top institutions has built a powerful psychological support cushion for the spot market.
The sharp edge of short-side pressure (historical cycle and massive unlock): Today (October 6) marks exactly one year since BTC touched its all-time high ($126,080), with the psychological correction from the historical cycle strongly resonating with the dense trapped positions of long-term holders (LTHs) above $86k.
More seriously, the entire market is facing a concentrated $1.11 billion token unlock today (with Hyperliquid alone releasing as much as $340 million worth of HYPE tokens to institutions today), creating substantial potential selling pressure on intraday liquidity.
Operationally, continue to guard against the possibility of volatile long-wick moves in both directions.
repost-content-media
BTC-0.23%
HYPE-1.85%
#Bitmine再增持持仓突破601万ETH The 5% target is within touching distance, but buying is quietly slowing down!
Bitmine (BMNRUS) now holds 6,016,414 ETH (approximately $16.4 billion), accounting for 4.9% of the total ETH supply—99% of the way toward its self-imposed target of holding 5%ETH.
Even more aggressive is its operating model: since launching in June 2025, it has bought ETH every week for 66 consecutive weeks without interruption, while 84% of its holdings (approximately 5.07 million ETH, worth $13.8 billion) has already been staked, with annualized staking returns expected to reach $363 million
CryptoMishu
#Bitmine再增持持仓突破601万ETH The 5% target is within touching distance, but buying is quietly slowing down!
Bitmine (BMNRUS) now holds 6,016,414 ETH (approximately $16.4 billion), accounting for 4.9% of the total ETH supply—99% of the way toward its self-imposed target of holding 5%ETH.
Even more aggressive is its operating model: since launching in June 2025, it has bought ETH every week for 66 consecutive weeks without interruption, while 84% of its holdings (approximately 5.07 million ETH, worth $13.8 billion) has already been staked, with annualized staking returns expected to reach $363 million.
This is the "Strategy of ETH"—hoarding coins while earning yield, pushing the "institutional ETH accumulation" narrative to the extreme; but two turning points must be watched: ① The buying pace has slowed for three consecutive weeks (27,562→17,362→15,112 ETH). Will it continue buying after reaching the 5% target? ② ETH accounts for 94% of the company's $17.4 billion in total assets—a highly concentrated single-point exposure. ETH is both its strength and its weakness.

I. What makes this model so "aggressive": it is not just "hoarding," but "hoarding + earning yield"
Strategy: Hoard BTC, which generates no yield—purely "conviction + unrealized gains"
Bitmine: Hoard ETH, with 84% staked to earn a 2.63% annualized yield (expected at $363 million per year)—it is "printing money" while hoarding coins

Three layers of impact:
Demand side: Fixed weekly buying of $40 million+—more disciplined than dollar-cost averaging by retail investors
Supply side: 84% staked means approximately $13.8 billion worth of ETH is "locked away" from the circulating market—effective liquidity is tighter, creating genuine supply contraction
Signal side: Chairman Tom Lee's exact words—"Institutions remain underexposed to crypto and are expected to increase their exposure in the final months of 2026"—he is roadshowing the "institutional entry" story

II. But the two "turning points" matter more than the accumulation itself
Turning point one: The buying pace is slowing: 27,562→17,362→15,112 ETH over the past three weeks, with the latest purchase being the smallest weekly buy since mid-August—the sprint toward the 5% target is slowing.
The core question: What happens after the 5% target is reached?
Look at Strategy's playbook—the marginal effect of the "coin-hoarding narrative" diminishes: buying is bullish, but once the buying is finished, the "good news is priced in"
Turning point two: 94% single-point concentration: Of Bitmine's $17.4 billion in total assets, ETH accounts for $16.4 billion (94%)—this is not "allocation"; it is "all in." If ETH rises, the balance sheet looks better and buying continues; if ETH falls, assets shrink and the company may be forced to stop buying—the "coin-hoarding leader" itself becomes an amplifier of ETH volatility

III. Impact on ETH and the market
Bullish in the short term: Fixed weekly buying + staking lockups = ETH's "effective circulating supply" continues to shrink; the "public companies hoarding ETH" narrative is taking shape, with imitators likely to follow; the final step from 4.9% to 5% is itself newsworthy.
What to watch in the medium term:
Does reaching the 5% target mark the end of the narrative or a new beginning?—This is the litmus test for ETH's "institutional accumulation rally"
Staking concentration: A single entity locking up 5.07 million ETH is both a "lockup bullish factor" and a "network risk"
Compared with the BTC accumulation wave: Public companies collectively hold only 1.27 million BTC (6.4% of circulating supply); Bitmine alone holds 4.9% of ETH—the single-point concentration is far higher than on the BTC side

Bitmine has taken "coin hoarding" to a new level—combining hoarding, staking, and yield generation; 66 uninterrupted weeks demonstrate genuine conviction, while $16.4 billion locked in staking represents genuine supply contraction. But the "5% target" is both an endpoint and a test: the slowing buying pace and 94% concentration are a double-edged sword—it is currently ETH's "bullish engine," but could also become a future "selling overhang."

For ETH: The medium-term thesis gets a boost (institutional accumulation + staking lockups), but do not treat "Bitmine will continue buying" as a perpetual-motion machine—how it proceeds after reaching 5% matters more than how much it has bought
For BMNR stock: It is currently "ETH with 2.63x leverage" (94% allocation)—you can buy it to bet on ETH, but understand that its volatility is far greater than ETH's
For the market narrative: "Corporate coin hoarding" is spreading from BTC to ETH—this is a typical late-bull-market feature (asset scarcity + institutions seeking an anchor); the hotter the narrative gets, the more important it is to remember valuation

Bitmine's 66 weeks have proven that "conviction" can be quantified—but Strategy hoards BTC, Bitmine hoards ETH, and Lion Group hoards HYPE—when "hoarding" becomes a collective behavior, "hoarding" itself is no longer a source of excess returns, but the final baton in the relay. Institutions understand better than retail investors "when it is time to tell the story to someone else." #OneGate见证计划 $ETH ‌
repost-content-media
BMNR-2.45%
ETH-2.68%
BTC-0.23%
HYPE-1.85%
#OneGate见证计划 For this market move, my answer: press the up key halfway, leave the other half for tomorrow
I’m pressing the “up key,” but only halfway. The reason is simple: BTC is holding above $85K today (around $85,500), the Nasdaq hit a new closing high overnight, BTC spot ETFs have seen net inflows for three consecutive weeks ($241 million last week), and the Fear & Greed Index is at 70 (greed zone) ——the bullish structure is intact. But $87K has been rejected twice, the 30-year US Treasury yield remains elevated at 5.6%, and the probability of a rate hike in December is still above 60%——a
CryptoMishu
#OneGate见证计划 For this market move, my answer: press the up key halfway, leave the other half for tomorrow
I’m pressing the “up key,” but only halfway. The reason is simple: BTC is holding above $85K today (around $85,500), the Nasdaq hit a new closing high overnight, BTC spot ETFs have seen net inflows for three consecutive weeks ($241 million last week), and the Fear & Greed Index is at 70 (greed zone) ——the bullish structure is intact. But $87K has been rejected twice, the 30-year US Treasury yield remains elevated at 5.6%, and the probability of a rate hike in December is still above 60%——at this level, “pressing the up key with your entire position” is just as dangerous as staying completely out. So my approach: hold the core position, keep the dry powder, and wait for tomorrow (10/7), when the Gate upgrade and confirmation of an $87K breakout arrive, before pressing the other half.

Why I dare to press halfway: three “hard-evidence”-level bullish catalysts
1、$85K held: even after the nonfarm payrolls pushed BTC to $87,250 before a pullback, it never fell below $85K——$85K has shifted from “resistance” to “real support,” the most important technical change
2、Institutions are “collectively pressing the up key”: Strive, Metaplanet, and Strategy bought another 3,334 BTC ($287 million) in one week; Bitmine has accumulated 6.01 million ETH——public companies voting with their balance sheets is worth more than the judgments of you and me
3、US stocks at new highs + three weeks of ETF inflows: external liquidity is recovering, and crypto has the wind at its back

Why I’m leaving the other half: three “unresolved” risks
1、$87K remains uncrossed: both rallies were pushed back——there is genuine overhead supply, and a breakout requires volume; without volume, it is just grinding
2、US Treasuries are still at 5.6%: until the 30-year yield comes down, all highly valued assets are doing “sit-ups”
3、A December rate hike is still on the table: nonfarm payrolls only knocked October out of the picture, while the December probability remains at 60%+——that is a November risk, but the market will price it in ahead of time

The areas I’m watching most closely next:
1、GT (tomorrow, 10/7, highest certainty): the TOKEN2049 upgrade presentation goes live——an upside surprise = accelerated repricing of the platform token’s value; a lackluster outcome = buy-the-rumor, sell-the-news. Around $11, holding above $12 points to $14-15
2、BTC ($85K battle): holding above it → previous high at $87.4K → $90K; breaking below $84K → back to $82K. It is the “switch” for the entire market
3、ETH (mid-term narrative): Bitmine’s 6.01 million ETH staked and locked up + the spread of the public-company crypto accumulation trend——around $2,700 is the institutional cost basis; a pullback is an opportunity, not a risk

For this market move, I believe in the direction of the “rise,” but the timing of the rise needs confirmation——as long as $85K holds, the uptrend structure remains intact; an $87K breakout is the acceleration signal, and the 10/7 upgrade is the nearest catalyst. You can press the up key, but keep your hand on the stop-loss.

How far have you pressed your up key? Let’s discuss in the comments 👇
repost-content-media
BTC-0.23%
NDAQ+0.51%
ASST+0.17%
SATA-0.69%
BMNR-2.45%
#OneGate见证计划 #SOL现货ETF单日净流出924万美元 Institutional “slow money” is cooling, while on-chain “hot money” remains active—$120 is the dividing line
On 10/5, SOL spot ETFs saw net outflows of $9.245 million (BSOL outflow of $7.1 million, FSOL outflow of $2.1 million, with none recording inflows), but this is only the “tip of the iceberg”—the real signal is in the weekly data: net inflows were just $2.43 million last week, plunging approximately 99% from $188.2 million the previous week. At the same time, XRP ETFs are also cooling in tandem (weekly inflows down 94%+), while BTC ETFs are still attractin
CryptoMishu
#OneGate见证计划 #SOL现货ETF单日净流出924万美元 Institutional “slow money” is cooling, while on-chain “hot money” remains active—$120 is the dividing line
On 10/5, SOL spot ETFs saw net outflows of $9.245 million (BSOL outflow of $7.1 million, FSOL outflow of $2.1 million, with none recording inflows), but this is only the “tip of the iceberg”—the real signal is in the weekly data: net inflows were just $2.43 million last week, plunging approximately 99% from $188.2 million the previous week. At the same time, XRP ETFs are also cooling in tandem (weekly inflows down 94%+), while BTC ETFs are still attracting funds—this is not SOL’s problem alone, but a structural shift in which “altcoin ETFs are retreating across the board and funds are returning to the mainstream.”
But on the other hand: SOL’s price is holding above $120, while DEX trading volume and tokenized stock trading remain strong.
ETF outflows show that “new institutional money” has stopped, while on-chain activity shows that “old ecosystem money” is still there—SOL’s pricing power is shifting from the “ETF narrative” to “on-chain usage,” with $120 marking the dividing line.
A single-day outflow of $9.24 million is really nothing
Cumulative net inflows stand at $1.599 billion, and a single-day outflow of $9.24 million accounts for just 0.6%—this is not “institutional flight,” but “slowing incremental inflows.” What is truly worth watching are two structural signals:
Signal one: weekly inflows collapsed 99% ($188 million→$2.43 million). The record of 14 consecutive weeks of net inflows remains intact, but “new money” has virtually stopped—institutions have shifted from “actively allocating” to “holding back.”
Signal two: altcoin ETFs are cooling across the board, while BTC is attracting funds alone. SOL and XRP ETFs have simultaneously stalled, while BTC ETFs still took in $241 million last week—funds are “returning to the mainstream” (risk-off rotation), and the “institutional side” of altcoin season has temporarily gone quiet. This follows the same logic as after the nonfarm payrolls report: the negative news has been priced in, but funds only dare to buy BTC.
But on-chain activity is showing “another side”
ETF funds and on-chain activity come from two different groups:
ETF institutions (slow money): watching macro conditions, compliance, and liquidity—they are waiting on the sidelines
​On-chain players (hot money): trading memes, using DEXs, and trading tokenized stocks—they are still present
SOL’s price has held $120 despite ETF inflows collapsing 99%, thanks to the resilience of DEX trading volume and tokenized stock trading.
This is actually a good thing: SOL’s pricing is shifting from “institutional sentiment” toward “real usage,” making its foundation more solid—but the cost is that without the “incremental capital” from ETFs, the slope of its rise will slow.
Impact on the price outlook: three judgments
Short term: $120 is the center of the tug-of-war. ETF outflows (bearish) vs. on-chain activity (bullish)—holding $120 means a range-bound bias with strength, targeting $132 (the previous-high zone after four consecutive gains); breaking below $120 means a pullback to $110-115. The direction will most likely depend on external variables (BTC choosing a direction/macro conditions), as SOL currently lacks the ability to break out independently.
Medium term: SOL’s “valuation anchor” has changed. Over the past six months, SOL’s gains relied on “ETF expectations + the institutional narrative.” Now that the narrative is cooling, SOL must rely on real substance (DEX volume, tokenized stocks, and ecosystem activity) to support its valuation—this is a “disenchantment phase”: the bubble portion will be squeezed out, while the usage-driven portion will remain.
Structural judgment: altcoin season has been delayed, not canceled. Altcoin ETFs cooling across the board + BTC attracting funds means capital is “narrowing its circle”—only when BTC stabilizes at $87-90K and risk appetite genuinely returns will altcoin ETFs see inflows again.
The $9.24 million outflow from SOL ETFs is the “result,” not the “cause”—the cause is the broad retreat from altcoin ETFs and institutional funds returning to BTC; but SOL’s on-chain activity proves that the ecosystem is still operating. In the short term, $120 will determine the winner; in the medium term, it remains to be seen whether SOL can successfully shift from “institutional narrative” to “usage-based pricing.” $SOL ‌
repost-content-media
SOL-3.93%
XRP-0.32%
BTC-2.02%
#OneGate见证计划 Weekly Token Unlock Overview: ENA, HYPE, AERO, OP; Who Is Creating Pressure, and Who Is Just Going Through the Motions?
Token unlocks are nothing new, but when the amount is large enough and the proportion high enough, they can directly become a short-term pricing anchor for the market. This week features four relatively notable unlocks: Ethena (ENA), Hyperliquid (HYPE), Aerodrome (AERO), and Optimism (OP).
Ethena (ENA)
Unlocking on October 5, it belongs to the DeFi sector. Its circulating market cap is approximately $2.4 billion, with this unlock worth $40.58 million, correspondi
CryptoMishu
#OneGate见证计划 Weekly Token Unlock Overview: ENA, HYPE, AERO, OP; Who Is Creating Pressure, and Who Is Just Going Through the Motions?
Token unlocks are nothing new, but when the amount is large enough and the proportion high enough, they can directly become a short-term pricing anchor for the market. This week features four relatively notable unlocks: Ethena (ENA), Hyperliquid (HYPE), Aerodrome (AERO), and Optimism (OP).
Ethena (ENA)
Unlocking on October 5, it belongs to the DeFi sector. Its circulating market cap is approximately $2.4 billion, with this unlock worth $40.58 million, corresponding to 170 million tokens and accounting for 1.7% of the current circulating supply. This is the highest-proportion unlock of the week. 1.7% is not extreme, but in the current environment of cautious market sentiment, it is enough to trigger expectations of short-term selling pressure.
In particular, as the core token of a synthetic dollar protocol, ENA has a relatively high proportion of institutional and early investors in its holder structure. If they choose to cash out after the unlock, its price sensitivity will be significantly higher than that of a purely retail-driven project.
Hyperliquid (HYPE)
Also on October 5. Its circulating market cap is as high as $20.1 billion, with this unlock worth approximately $340 million, involving 3.75 million tokens and accounting for only 0.4% of the circulating supply. The amount looks large, but the proportion is extremely low. For a leading DEX with a market cap already above the $20 billion level, a 0.4% unlock looks more like a normal supply release than a disruptive event.
The market's current pricing logic for HYPE is based more on trading volume, fee revenue, and buyback expectations. A single small-percentage unlock is unlikely to change the medium-term trend.
Aerodrome (AERO)
Unlocking on October 7. Its circulating market cap is $850 million, with an unlock worth $3.53 million, involving 4.1 million tokens and accounting for 0.4%. In terms of both amount and proportion, this falls into the low-impact category.
Its leading position among Base ecosystem DEXs remains intact, with liquidity and trading volume data supporting its fundamentals. This unlock will most likely be quickly absorbed by the market. Optimism (OP)
Unlocking on October 11. Its circulating market cap is $3 billion, with the unlock worth only $590k, involving 4.45 million tokens and accounting for 0.2%. It can almost be ignored. The Layer 2 sector as a whole remains in a phase where narrative and implementation are progressing in parallel, so OP's unlock is expected to have a very limited impact on its price.
The only one that truly warrants caution is ENA
Looking at the four unlocks together, the divergence is very clear: HYPE has the largest amount but the lowest proportion, so its impact is limited. ENA has the highest proportion, and its amount is also substantial, making its short-term pressure the most worth watching. AERO and OP are essentially just going through the motions.
The impact of token unlocks on prices has never been as simple as “unlocking means a drop.”
The key is to look at three variables: whether the unlock proportion is high enough (usually, it only becomes materially worth discussing once it exceeds 1%); who receives the tokens (the team, investors, or the community); and the market's risk appetite at the time. The overall market is currently in a digestion phase following Bitcoin's surge and retreat, and risk assets have become more sensitive to supply shocks.
ENA's 1.7% unlock falls right within this window. If concentrated selling pressure emerges after the unlock, short-term volatility could be amplified; conversely, if buyers absorb the supply strongly, the market may interpret it as “the bearish news has been fully priced in.”
HYPE is completely different. A 0.4% unlock is more like routine operations for it. What truly determines its direction remains trading data, revenue generation, and the pace of buybacks. As long as these fundamentals do not deteriorate significantly, a single small-percentage unlock is unlikely to become a trend reversal point.
How to approach this week's trading pace
For short-term traders, ENA is the only unlock event this week that requires close attention. Watch changes in trading volume before and after the unlock, large transfers, and whether there is any obvious buildup of sell orders. If the price drops rapidly after the unlock but trading volume does not increase, it often means the selling pressure was priced in ahead of time; if the drop is accompanied by increased volume, greater caution is warranted.
For medium- and long-term holders, the impact of the HYPE, AERO, and OP unlocks can all be treated as secondary. What truly determines their direction remains the competitive landscape and protocol revenue in their respective sectors, rather than a one-off release of tokens worth several million to tens of millions of dollars.
A token unlock itself is merely a disturbance on the supply side. It does not create value, nor does it eliminate value out of thin air; it simply puts previously locked tokens onto the market ahead of time. The market will ultimately tell you with real money whether these tokens were absorbed or dumped. The most important thing to watch this week is not “whether there is an unlock,” but “who is buying after the unlock.”
ENA-1.88%
HYPE-1.85%
AERO+8.54%
OP+2.20%
BTC-0.23%
#OneGate见证计划 XBR and WTI: Why have they diverged?
One Earth, two benchmark prices
One rose 5.44% for the week, while the other fell 1.28%. This is not a data error; these two markets are telling two completely different stories.
First, what exactly are they?
XBR Brent is the benchmark price for North Sea crude, setting the price for Europe and most seaborne crude; WTI is U.S. light crude from Texas, setting the price for the U.S. inland market.
Normally, the spread between the two remains stable at a few dollars, and their movements are largely synchronized.
Now, why have they diverged this ti
CryptoMishu
#OneGate见证计划 XBR and WTI: Why have they diverged?
One Earth, two benchmark prices
One rose 5.44% for the week, while the other fell 1.28%. This is not a data error; these two markets are telling two completely different stories.
First, what exactly are they?
XBR Brent is the benchmark price for North Sea crude, setting the price for Europe and most seaborne crude; WTI is U.S. light crude from Texas, setting the price for the U.S. inland market.
Normally, the spread between the two remains stable at a few dollars, and their movements are largely synchronized.
Now, why have they diverged this time?
Because the 100 million barrels released by the G7 this time are focused on diesel—with diesel reserves to be released in concentrated fashion over the first 20 days. And the market facing the real emergency right now is precisely Europe’s diesel market. After the news broke, European diesel prices plunged more than 8% at one point intraday, while U.S. diesel futures fell as much as 5.6% and ultimately closed down 3% at $4.50 per gallon.
This G7 move is targeting a “diesel shortage,” not an “oversupply of crude.”
The reason Brent is still above $102 and up 5.44% for the week is that the geopolitical risks behind it have not eased at all—the U.S.-Iran talks remain inconclusive, and uncertainty over Middle East supply persists.
WTI fell because U.S. domestic crude supply was already ample, and expectations of a reserve release weighed on it first.
Oil prices are not a single number, but a set of numbers.
The next time you look at oil prices, ask yourself first—which oil price are you looking at?
One detail many people do not know: Of the 400 million barrels of strategic reserves that the IEA announced for release in March this year, approximately 325 million barrels have already been released, more than 80%. The ammunition for this round of “oil release” is basically exhausted. If prices are to be pressured again in the next round, the focus will have to turn to OPEC+—and OPEC+’s capacity assessment has already been postponed.
Releasing reserves borrows oil from tomorrow to suppress prices today. The more you borrow, the harsher the backlash later. It is the same principle as running up your credit card…
repost-content-media
#OneGate见证计划 Altcoin season has completely changed: projects with buybacks are skyrocketing, while those without buybacks are being eliminated
A new cycle has now begun, and all the projects that have emerged successfully are those with buybacks. The ones reaching the top are all projects with both buybacks and ETFs. Let’s review which projects have buyback mechanisms and have performed well.
First, the strongest buyback mechanism at present is automated on-chain buyback and burning. Since Web3 projects are currently issued on-chain, protocols automatically using their revenue to conduct perio
CryptoMishu
#OneGate见证计划 Altcoin season has completely changed: projects with buybacks are skyrocketing, while those without buybacks are being eliminated
A new cycle has now begun, and all the projects that have emerged successfully are those with buybacks. The ones reaching the top are all projects with both buybacks and ETFs. Let’s review which projects have buyback mechanisms and have performed well.
First, the strongest buyback mechanism at present is automated on-chain buyback and burning. Since Web3 projects are currently issued on-chain, protocols automatically using their revenue to conduct periodic buybacks through smart contracts is highly consistent with the spirit of blockchain.
1. hype
hyper uses 90% of its protocol fees for buybacks, and hyper is also a 24/7 money-making machine, currently generating more than $1 billion in annual revenue. There is always such a “whale” continuously buying in the market, so the token price naturally keeps surging.
hyper has currently burned a cumulative 1.3 billion tokens, with an average of 50,000 hyepr burned daily.
hype surged as high as 97, bottomed at 23 in January 2026, and has now increased fourfold—simply unfathomable.
2. Pump
The second project with automated on-chain buybacks is pump, which uses 50% of its protocol fees for on-chain buybacks and burns the tokens directly. In April 2026, it burned $370 million worth of tokens in a single transaction.
pump has now burned 17% of its supply, burning $1 million worth of tokens daily recently. pump’s token price has increased fivefold since June 2026.
3. Uni
Uni’s fee switch was actually turned on last year, enabling programmatic buybacks and burns. Uni has now burned a cumulative 11.3% of its supply, with 2,000–4,000 tokens burned daily. Uni’s token price has also risen fourfold, from a bottom of 2.5 to the current 9.
4. SKY (formerly MakerDAO) is a veteran DeFi protocol that uses 55% of its protocol revenue for programmatic buybacks. However, the SKY bought back is not burned; instead, it is said to be removed from circulation, while some of the tokens are diverted to repay reserves, drawing criticism.
SKY’s token price has currently doubled from its bottom of 0.05.
5. Aster
Aster uses 99% of its platform fees for buybacks, apparently copying hyper’s model, but it does not burn the tokens; instead, it rewards Aster stakers.
Aster’s token price has not reacted much so far!
6. Pancake
Part of the fees is used for buybacks, triggered according to rules and cycles. However, CAKE has emissions, so it is not necessarily deflationary on a net basis.
Of course, there are many other projects with similar buyback and burn mechanisms, but they have not been included because the processes are not executed automatically in a programmatic manner.
In summary, the first four of these projects currently have the best performance among those using programmatic automatic buybacks and burns!$HYPE
HYPE-1.85%
HYPER+1.50%
PUMP-6.20%
UNI-5.80%
SKY-2.14%
#布局本周交易 #每周来晒 Bitcoin is experiencing wide-range volatility, and the market needs a new catalyst to break out of the range
Market News
Macroeconomic pressure: The U.S. 30-year Treasury yield rose to 5.67%, while the 10-year yield climbed to 5.31%, both reaching their highest levels since 2002. Continued increases in long-term yields are suppressing risk-asset valuations. QCP Capital noted that elevated oil prices and rising interest rates are still weakening upside momentum.
Key event: The Federal Reserve will release the minutes of its September FOMC meeting on October 8. The market-implied p
CryptoMishu
#布局本周交易 #每周来晒 Bitcoin is experiencing wide-range volatility, and the market needs a new catalyst to break out of the range
Market News
Macroeconomic pressure: The U.S. 30-year Treasury yield rose to 5.67%, while the 10-year yield climbed to 5.31%, both reaching their highest levels since 2002. Continued increases in long-term yields are suppressing risk-asset valuations. QCP Capital noted that elevated oil prices and rising interest rates are still weakening upside momentum.
Key event: The Federal Reserve will release the minutes of its September FOMC meeting on October 8. The market-implied probability of another 25-basis-point hike in October has plunged from 70% a week ago to 18%, although expectations of a December hike remain. Uncertainty over the rate path is the core short-term variable. Marginal regulatory easing: The Federal Reserve officially revoked the restrictive policy introduced in 2023, allowing uninsured state member banks to apply on a case-by-case basis to conduct crypto-related business. The U.S. Treasury also withdrew its proposed monitoring rules for non-custodial wallets. The compliance environment has improved, but the short-term pricing impact is limited.
Supply-side pressure: Approximately $1.11 billion worth of tokens will be unlocked in the first week of October, including $340 million from Hyperliquid. Only about $15 million in replenishing funds has entered, creating structural selling pressure due to supply-demand asymmetry.
On-chain data shows bullish signals: Glassnode data shows that the trend of BTC whales making net deposits to exchanges ended in late August, after which flows shifted to sustained net outflows. The deposit trend had lasted for more than three months, twice the duration of similar trends since 2023, indicating that whale selling pressure has materially eased.
Demand recovery: The 30-day apparent demand indicator has recovered from -182000 BTC to -101000 BTC, indicating that spot demand is recovering but remains in net contraction territory.
Holdings structure: Wallets holding 10–10000 BTC have accumulated 41025 coins over the past 10 days, bringing their total holdings to 13.64 million coins, or 67.93% of total supply. Mid-term holdings continue to concentrate in stronger hands.
Technical analysis: BTC is maintaining narrow-range volatility between $85000 and $87000, with the price above the 200-day moving average ($80625) and the Ichimoku cloud ($84864–$85417). The medium-term structure remains bullish.
However, the RSI stands at 60.74, nearing overbought territory, while MACD momentum is weakening and clear price rejection has emerged around $87363.
Since September 21, BTC has unsuccessfully tested the yearly opening price of $87570 four times, making this level a strong psychological resistance. A decisive break above $87400 would target $93700, while a break below $82500 could lead to a retest of $80000.
BTC is caught between macro interest-rate pressure and improving on-chain holdings. Its short-term direction depends on the wording of the October 8 FOMC minutes. ETH’s short-term catalyst is concentrated around the launch of the Glamsterdam testnet, but extremely low volatility suggests that a directional move is approaching.
Bitcoin has now entered wide-range consolidation, with a broad range of 82500--87400. In the short term, the 4-hour chart shows that it is basically trading above the middle band, which is also around 85000. The lower band is 84000, and the upper band is 86500.
There is currently no news-driven stimulus, so the market may continue consolidating for some time. Watch these levels for trading. Consider long positions around 84000 and short positions around 86500. $BTC
repost-content-media
BTC-0.23%
ETH-2.68%
HYPE-1.85%