Share crypto content and earn up to 60% commissions through content mining.
placeholder
gatefun
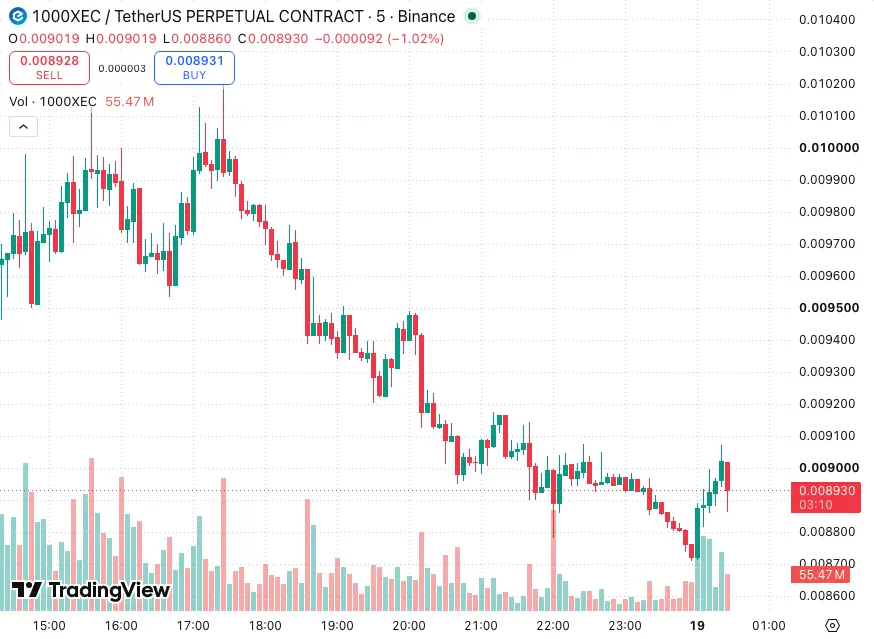
Long lower wicks that appear in the market structure are often called “the finger of the immortal.”
They are a classic candlestick signal used to anticipate the direction of the subsequent move.
When these long lower wicks show up at the high and low points of a phase of trading,
they are usually a clear reversal signal.
But if they appear in the middle of a consolidation range,
the signal’s effectiveness hasn’t been sufficiently verified yet.
Just as it happens, BTC’s 5-minute chart has formed a standard “finger of the immortal” pattern.
Next, you can focus on closely monitoring
BTC0.11%
View Original
post-image
  • Reward
  • 1
  • Repost
  • Share
Square:
Is the bullish signal correct?
Good morning
Hope you work out today
Can I get a GM back
post-image
  • Reward
  • Comment
  • Repost
  • Share
JUST IN: Lighter completes its historical repurchase and burn, removing 15.64M LIT tokens from circulation. Potential scarcity impact could bolster token fundamentals over time. $LIT
LIT5.88%
post-image
  • Reward
  • Comment
  • Repost
  • Share
#USIranWarCloudsGather
🌍 #USIranWarCloudsGather
The geopolitical landscape is once again under intense pressure as tensions between the United States and Iran continue to rise. Renewed military exchanges, political warnings, and uncertainty surrounding the Strait of Hormuz have fueled concerns that the fragile calm in the Middle East could give way to a broader regional conflict. Although diplomatic channels remain open, recent developments suggest that the situation is highly volatile, with both sides signaling a willingness to defend their strategic interests while mediators work to preven
post-image
post-image
  • Reward
  • Comment
  • Repost
  • Share
crypto market rallies against weak stock market trends with altcoin optimism heating up ahead of the
gate liveLIVE
321
live-coin
  • Reward
  • Comment
  • Repost
  • Share
July 11 BTC/ETH Mi Shen strategy
Have a great weekend—quick and to the point, going straight to the good stuff.
Both BTC and ETH have reached pressure areas near the most-recent swing highs and are consolidating there. There’s no need to worry too much—being able to range around the pressure level itself is a show of strength. The overall dip trend (哆头趋势) is fine. However, you need to watch for the main force setting up a fake breakdown to shake out the trapped liquidity near the prior high. From the traders’ psychology, when most people first get out of their positions, they may just probe. B
BTC0.11%
View Original
post-image
post-image
  • Reward
  • Comment
  • Repost
  • Share
WORLD CUP PREDICTION
gate liveLIVE
869
  • Reward
  • Comment
  • Repost
  • Share
HYPE CRASH TOTAL! | 🔥 Price Drops to $52..? through @YouTube
#HYPE #DIDICHANEL
HYPE-2.38%
View Original
post-image
  • Reward
  • 1
  • Repost
  • Share
ThisIsTranslateContent::
Buy the dip and enter 😎
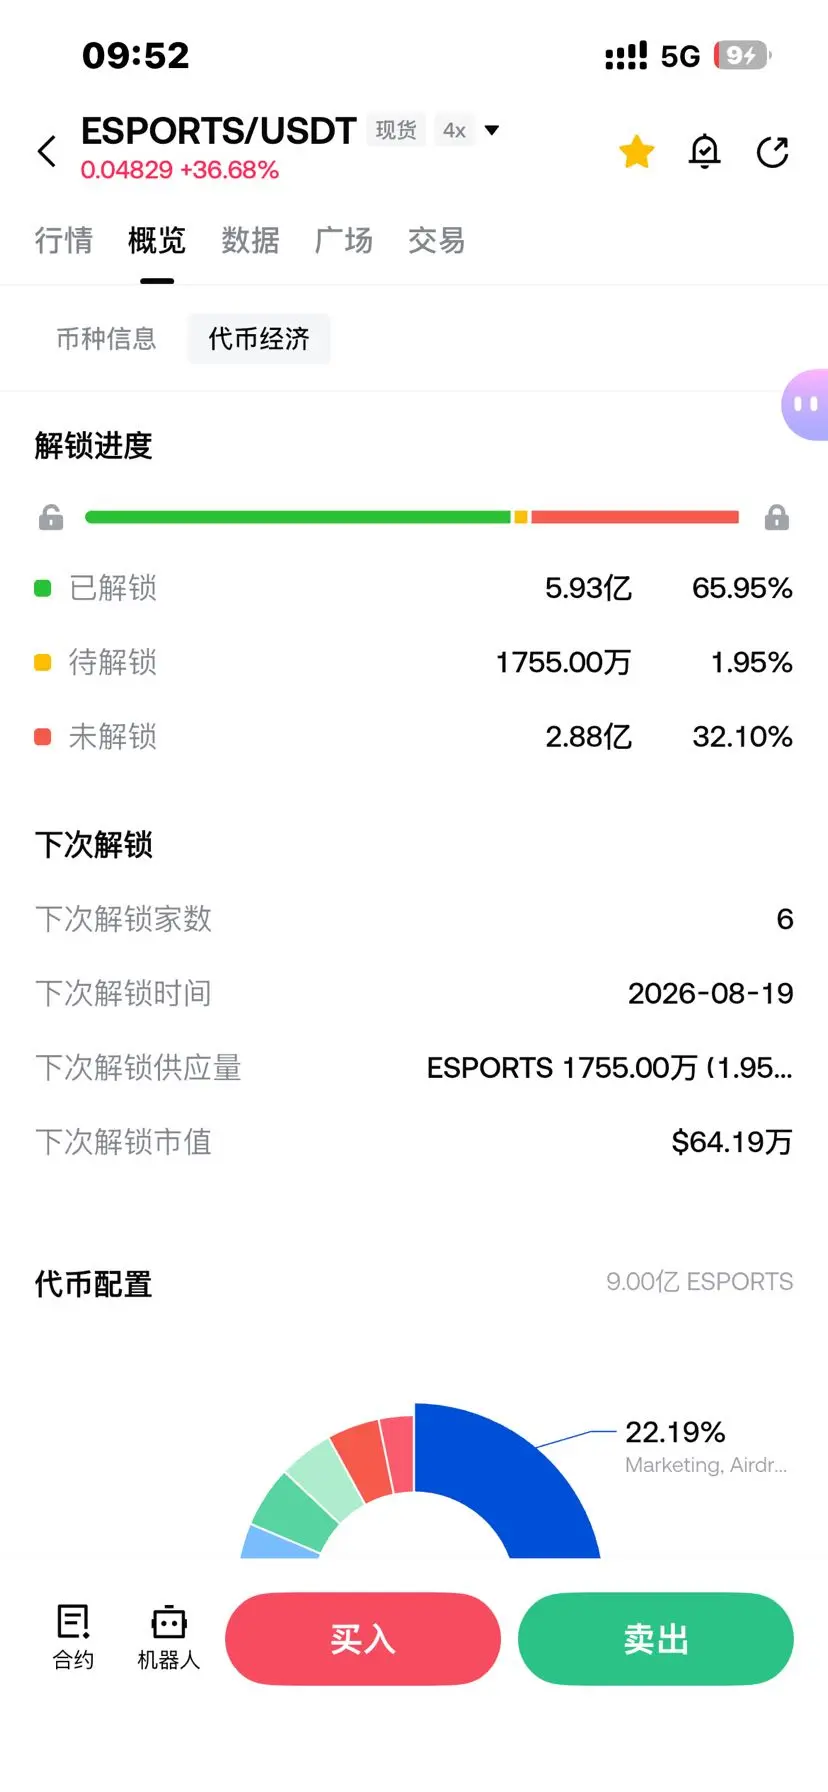
Many people were still chanting “a rebound” a moment ago, but $ESPORTS directly put in a downward confirmation candle. This kind of chart action most easily kicks hesitant traders out of the market. My short isn’t a temporary impulse—I’m looking specifically for the failed rebound after pressure in the high range.
After entering on ESPORTS from 0.04289, the most critical point is that the price keeps failing to break back up, while volume begins to shrink instead. This suggests that the buy orders above aren’t that strong. This is already off—especially after a false breakout quickly fell back
ESPORTS-18.89%
BTC0.11%
ETH1.24%
View Original
post-image
  • Reward
  • Comment
  • Repost
  • Share
Sam Altman may be the most controversial genius in Silicon Valley’s history.
Before Musk had even blasted him for turning a nonprofit into a money-making machine—people might have thought it was just Musk’s personal grudges.
But now Apple—the world’s most steady tech giant—has also stepped in to tear into him.
Apple accuses OpenAI of not just improper conduct by individual employees, but of miscoordination at the institutional level.
In short, OpenAI, starting from the top leadership, is allegedly systematically instigating OpenAI employees to get Apple staff to “sell” and make an escape.
That
AAPL-0.26%
View Original
post-image
post-image
  • Reward
  • Comment
  • Repost
  • Share
What caught my attention wasn’t a sudden spike in a single candle, but the fact that after BCH pulled back, it didn’t continue to weaken. That level is what made me re-confirm the direction.
My entry price this time was 207.29. At the time, my view was that there were signs of repair in the uptrend structure—so as long as price didn’t quickly fall back, there would be room for continuation. Now it’s at 244.38, and the feedback is smoother than I expected.
The return has reached +1269.46%. This whole process counts as a fairly comfortable period for long-position realization. In my review, the
BCH0.88%
BTC0.11%
ETH1.24%
View Original
post-image
  • Reward
  • Comment
  • Repost
  • Share
JUST IN: Brock Miller, Coinbase’s Head of Engineering, has left after 8 years to join Anthropic as a Member of Technical Staff. If true, this signals AI-native engineering talent moving between crypto and AI labs, potentially influencing how crypto projects pair with AI toolin...
COIN0.39%
post-image
  • Reward
  • Comment
  • Repost
  • Share
How crazy is the hype around Robinhood?
In just a few days, NOXA launched a total of 52,811 meme tokens, with 527k addresses participating.
The uncle only dares to buy the top market-cap tier, so he definitely won’t make big money, but it controls the risk. As long as the funds can keep flowing into Robinhood, the front-row siphoning effect will be even more obvious.
Keep buying a little at low position between 1m and 3m for the top names.
HOOD-2.70%
MEME-1.07%
View Original
post-image
  • Reward
  • Comment
  • Repost
  • Share
Don’t blink! This pullback came fast and hard—shorts cashed out too smoothly 🚨📉 When price ground higher intraday, $MON kept trying to push up, but every time it got pushed back down. Volume wasn’t strong enough, and the bids weren’t decisive either.

I was looking at it pretty simply at the time: resistance above is still there, the rebound lacks continuity, buy pressure can’t hold, and the “bait-for-longers” vibe is getting heavier. So I followed the plan and opened a long around 0.02670 👀🔔

Now the price is at 0.02343. The ROI shows +589.79%—this profit feels so good. ✅💰 If you can
MON0.17%
BTC0.11%
ETH1.24%
View Original
post-image
  • Reward
  • Comment
  • Repost
  • Share
Family, who understands this! This pullback really gave face to the move. 📉🔥 A few days ago, before bed it was still grinding around the high end, and a lot of people watching wanted to chase it. I was looking at clear overhead resistance, and the volume wasn’t keeping up either—every time it rebounded, it fell short by just a breath.
Back then $VIC was around 0.06350, so I reminded everyone not to let a fake breakout fool them—shorts were the clearer approach. This morning when I opened the chart, the price had already come down to 0.04051, and the profit was immediately locked in at +713.1
VIC0.17%
BTC0.11%
ETH1.24%
View Original
post-image
  • Reward
  • Comment
  • Repost
  • Share
$ETH Saturday Bing Analysis
It still hasn’t broken the previous high, and the rebound strength is getting weaker and weaker. On the smaller timeframes, price may continue to range and rebound. In the big picture, staying bearish is still the main focus.
Trade plan: short in the 1805-1815 range, target 1760-1740
ETH1.22%
View Original
post-image
  • Reward
  • 1
  • Repost
  • Share
GateUser-e84f640c:
The 1805-1815 range is quite important, but liquidity is thin on weekends, so the risk of sudden spikes is not small—keep your position sizing under control.
Is this the final frenzy for XRP bulls? A 4-hour top divergence has already appeared
$XRP /USDT - Go short SHORT
Trading plan:
Entry: 1.1042 – 1.1068
SL: 1.1182
TP1: 1.0960
TP2: 1.0896
TP3: 1.0801
Why focus on this structure?
- The daily trend is clearly bearish; a 4-hour EMA death cross is about to happen
- RSI on the 15-minute chart is 51.9; the rebound lacks strength, and downside room is opening up
- The current price 1.1055 is near the resistance zone, the best point to enter a SHORT
Discussion:
For this SHORT, should we first target TP1 1.0960, or go straight with a wick to 1.08?
XRP-0.46%
View Original
post-image
post-image
  • Reward
  • Comment
  • Repost
  • Share
$H /USDT Longs’ last chance to escape?

$H /USDT - Short SHORT

Trading plan:
Entry: 0.06707 – 0.06771
SL: 0.07050
TP1: 0.06506
TP2: 0.06350
TP3: 0.06116

Why focus on this setup?
- 4h-level SHORT signal, confidence 95%, 1D trend is clearly bearish.
- 15m RSI is only 39.24, rebound is weak, and bearish momentum is brewing.
- Current price 0.06739, hovering just below the EMA, TP1 0.06506 is within reach.
- Why now? RSI is not oversold + trend confluence— the best entry window has opened.

Discussion:
Will this move first wick down to TP2 0.06350, or will it break down and accelerate
H-3.92%
View Original
post-image
post-image
  • Reward
  • Comment
  • Repost
  • Share
Yesterday, the Ethereum spot ETF with the largest single-day net outflow was Fidelity’s ETF FETH, with a single-day net outflow of $33.9629 million. As of now, FETH’s historical total net inflow has reached $2.15B.
ETH2.58%
View Original
post-image
  • Reward
  • Comment
  • Repost
  • Share
A user sold 20 million CASHCAT too early for only $711, missing out on over $2.7 million in potential profit. They spent 0.04 ETH ($69) to buy 20 million CASHCAT, then sold them for 0.415 ETH ($711), achieving a 10x return, but if they had held until now, they could have profited over $2.7 million.
ETH1.22%
View Original
post-image
  • Reward
  • Comment
  • Repost
  • Share
Load More

Join 40 M users in our growing community

⚡️ Join 40 M users in the crypto craze discussion
💬 Engage with your favorite top creators
👍 See what interests you
  • Pinned