Share your thoughts
placeholder
Article
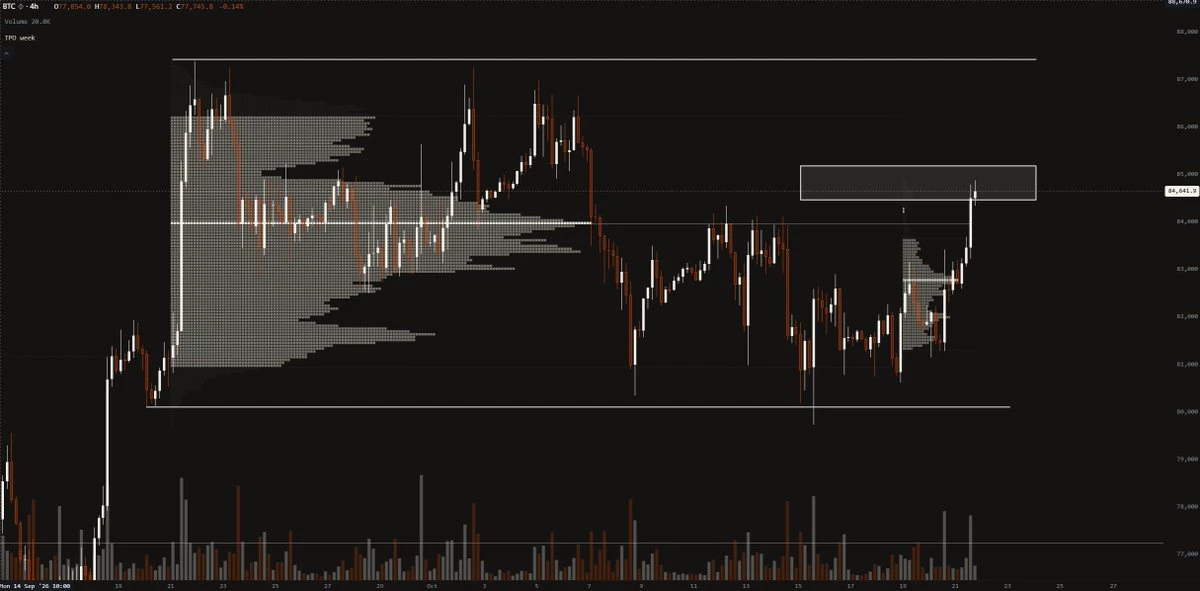
Scared me to tears.
Is this an ancient battlefield?
Short positions are trapped 🍑; do not act recklessly.
Do not panic-sell at a rebound high; blindly adding to your position will only increase the pressure on your holdings.
Wait patiently for the market momentum to play out, and make a decision once the direction emerges.
If you are unsure how to manage your position, do not tough it out alone. $BTC $ETH #日股地产电力半导体板块走强
post-image
BTC+5.94%
ETH+7.32%
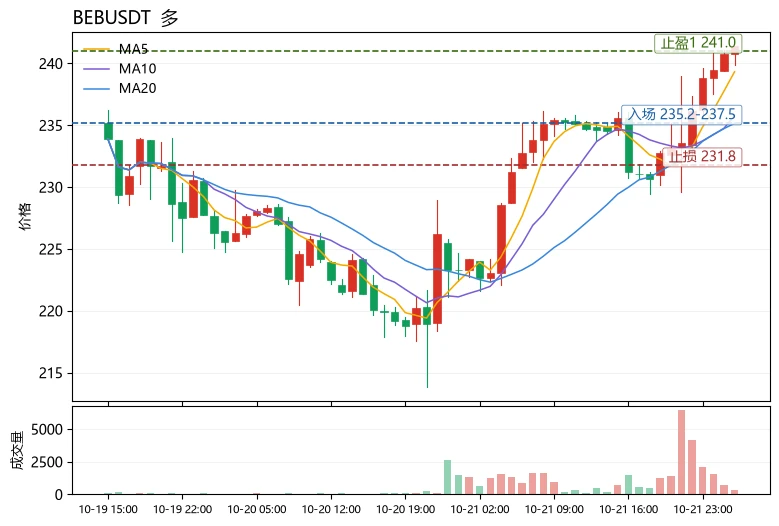
$BR , $AKE
& $STRK
... Bullish expansion continues exactly as expected. Price reacted from support, absorbed selling pressure/supply, and surged with a strong breakout and aggressive displacement. BR pushed into price discovery near $1.00. AKE saw 82% expansion, accompanied by strong momentum. STRK broke structure and extended to around $0.040. Support held → BOS confirmed → momentum expansion. Bulls still control the structure, but after such a steep vertical move, a pullback or liquidity retracement would be healthier. After such a strong bullish rally, a retest and correction phase is nor
post-image
BR+35.80%
AKE+84.92%
STRK+43.33%
BOS+7.31%
A bountiful harvest today; keep grinding this weekend
Is trading difficult? Yes, it truly is
But so many people still keep forging ahead
What for?
Isn't it to rise above the rest and achieve true freedom?
#日股地产电力半导体板块走强
You must first develop a trader's mindset, then form unique insights, and finally put knowledge into practice
$ZEC $ETH $BTC
Can't pinpoint the right entry? No problem
Can't hold on to a position? No problem
Trapped at a high? No problem
There will always be opportunities and solutions
Sleepless tonight, helping those with determination
ZEC-0.54%
ETH+7.32%
BTC+5.94%
#Gate广场中秋团圆局
#USAIConceptStocksRally The AI Trade Just Passed Its First Macro Test
The most important number from Thursday’s U.S. session was not Intel’s +7.7% or Arm’s +8.6%. It was the Nasdaq +1.69% move after the Federal Reserve delivered another 25-basis-point rate hike. The S&P 500 gained 1.14% and the Dow added 0.61%, but the stronger performance in technology and semiconductor names shows where risk appetite returned first. The question now is not whether AI stocks can rebound for one session; it is whether capital is beginning to rotate back into the AI infrastructure trade after the
post-image
$MSTR is showing a strong increase of +14.92% at the 152.00 level; the recovery from the 81.81 low has pushed the price above the MA5, MA10, and MA30. However, the 193.00 peak is still far away on the chart, and a negative P/E ratio remains. The picture before the October 29 earnings report seems to say, "I'm strong, but cautious"; stay calm, observe the level. #MSTR 🤔
Not investment advice.
MSTR+16.21%
Rally or Trap? Three Risks and One Question
A single 1.7% day on the Nasdaq is not a trend.
But the great turning points in market history also started with days like this.
What separates the two? Three gauges and one question.
Risk 1 — the rate path. The Fed ended its 2026 cycle with a hike and signalled one more before year-end. Tightening conditions press directly on growth companies that book most of their cash flow in future years.
Risk 2 — concentration. Information technology now accounts for roughly 38% of the S&P 500, against a long-run average near 18%. When an index is carried by a
post-image
xxx40xxx
It's Called the AI Rally, But the Fuel Is Liquidity
The market calls it an AI rally.
But would this picture have formed if the 10-year Treasury yield had not slipped below 5% and the VIX had not dropped 11%?
And does on-chain liquidity tell the same story?
Three variables carried risk appetite on 17 September: a 4.93% 10-year yield, a VIX at 15.7 and softer oil. Together they lower the cost of carrying risk. More often than not, prices are moved by conditions rather than headlines.
Crypto lives this dynamic faster. Stablecoin supply, transfer volumes in cash-like assets such as USDC, collateral quality inside DeFi protocols and the depth of liquidity pools rank among the most transparent measures of risk appetite. That is Web3's edge: this data sits on-chain rather than behind closed doors. An analyst watching on-chain liquidity can answer "where is the leverage coming from?" far faster than in traditional markets.
The first signs of deteriorating risk appetite show up here early too: tightening collateral ratios, sudden jumps in lending rates, stablecoin flows changing direction. In traditional markets such signals arrive late, after the close; on-chain they are readable in real time — an asymmetry that makes Web3 tooling a genuinely useful complementary risk panel.
GateSquare is where that bridge gets built: while the AI narrative drives the Nasdaq, the same theme finds expression in crypto through new Launchpad structures, tokenomics design and DeFi products. One caveat still applies: correlation is not causation, and the two markets do not always react to the same headline in the same direction.
So what is this optimism missing? Three concrete risks — and the series finale — in Article 5.
This content is not investment advice. Always perform your own research before making financial decisions.
$BTC $GT $ETH
#Gate广场中秋团圆局 #美股AI概念股全线反弹 #GateMemeCarnival #WhereToParkStablecoinsWhileWaiting #GateSquareMidAutumnReunion
repost-content-media
BTC+5.91%
GT+6.51%
ETH+7.27%
  • 30
#日股地产电力半导体板块走强 #Gate广场中秋团圆局 Japan’s latest equity move looks broad from the index level, but the underlying data tells a much more concentrated story. The Nikkei 225 closed at 65,018.95, gaining 882.70 points or 1.38%, after reaching an intraday high of 65,436.57. That was the index’s third consecutive advance and its first close above 65,000 since September 10. Trading activity was also substantial, with approximately 2.86 billion shares changing hands and around ¥10.40 trillion in trading value on the Tokyo Stock Exchange Prime market.
But the headline Nikkei gain hides an important detail:
post-image
JPN225+0.23%
USDJPY+0.50%
$NEAR ‌unstopable guys buy now next to the 🌝🌙
post-image
NEAR+24.02%
Kioxia Holdings (285A) is trading at 54,570 JPY as of September 18, 2026, and has gained 9.40% intraday, making it one of the top performing stocks in the Nikkei 225 index. The intraday trading range was between 50,600 and 54,570 JPY, with a market capitalization of 29.4 trillion JPY (approximately $188 billion).
The company's recent price movement is driven by exceptional financial results announced for the first quarter of fiscal year 2026 (April-June). Kioxia's revenue increased by 415.5% year-over-year to 1.767 trillion JPY. Operating profit increased 28-fold to 1.33 trillion JPY, while ne
post-image
BAC-0.65%
GS-1.07%
SK Hynix+6.41%
JPN225+0.23%
  • 3
  • 1
🚨 $PIEVERSE
— Strong short trade 📉🔥The price began losing momentum after the recent rise, and the movement appears stalled, with an increasing chance of a decline.🛑 Stop loss: 1.66 Targets: 1.48-1.42-1.37👇 Open a position $PIEVERSE from this area!
post-image
PIEVERSE+40.92%
japan is turning into a serious macro watch again.
nikkei just closed at 65,018, up 1.38%, with ai and semiconductor names pushing the tape higher. advan test and lasertec were among the chip names catching bids. 📈
at the same time, japan’s land market keeps grinding higher. land prices rose 1.5% year over year to july 1, marking the fifth straight year of gains, while the major tokyo, osaka and nagoya markets rose 4.4%.
then you have the power + data-center angle.
more ai compute means more chips, more electricity, more data centers and more physical infrastructure. japan is increasingly sit
post-image
Bitcoin Market overview
live-cover
LIVE1,111
$Ltc all the way!
post-image
LTC+6.15%
It's Called the AI Rally, But the Fuel Is Liquidity
The market calls it an AI rally.
But would this picture have formed if the 10-year Treasury yield had not slipped below 5% and the VIX had not dropped 11%?
And does on-chain liquidity tell the same story?
Three variables carried risk appetite on 17 September: a 4.93% 10-year yield, a VIX at 15.7 and softer oil. Together they lower the cost of carrying risk. More often than not, prices are moved by conditions rather than headlines.
Crypto lives this dynamic faster. Stablecoin supply, transfer volumes in cash-like assets such as USDC, collatera
post-image
xxx40xxx
Four Stocks, Four Stories: The "AI Basket" Fallacy
They rose on the same day, so they get filed under the same sector.
In reality one sells healthcare data, one sells servers, one sells connectivity, one licenses chip architecture.
Building the wrong basket means taking the same risk four times without noticing.
Tempus AI is a healthcare data company. Second-quarter 2026 revenue rose 22% to $382.5m, the company posted its first net profit and positive EBITDA, and full-year guidance was lifted to $1.595–1.605bn.
Super Micro Computer builds AI servers. Fourth-quarter revenue nearly doubled to about $39.1bn, new orders topped $60bn, and FY2027 guidance sits at $65–72bn. The stock, however, is still down roughly 17% year to date.
Astera Labs works on connectivity and memory. Quarterly revenue hit a record $392.4m, up 104% year on year, helped by a new Leo controller launch. Customer concentration stays high, and the company missed out on S&P 500 inclusion this round.
Arm licenses chip architecture: management said it is increasingly confident of reaching about $2bn in demand for its first data-centre chip.
Assets that move together on a single day raise portfolio correlation; they do not merge fundamental stories. Skipping a token's tokenomics before taking a position is a well-known mistake in crypto. Skipping a company's story before buying a "theme" is the equity market's version of the same error.
So where does the money financing this move actually come from? Article 4 follows the liquidity.
This content is not investment advice. Always perform your own research before making financial decisions.
$BTC $GT $ETH
#Gate广场中秋团圆局 #美股AI概念股全线反弹 #GateMemeCarnival #WhereToParkStablecoinsWhileWaiting #GateSquareMidAutumnReunion
repost-content-media
BTC+5.91%
GT+6.51%
ETH+7.27%
  • 29
  • 1
$HYPE HYPE 1D – Our Setup Delivers as Price Nears Final Target
Hyperliquid is trading around 91.509 on the daily timeframe, extending the breakout our setup flagged off the demand zone near 50 to 55, with price now closing in on the psychological 90 to 91 target zone we projected.
The structure here traces back to the long term ascending trendline from the February low, which caught up with price in early August right as a tight demand zone formed between 50 and 57. That confluence of trendline support and horizontal demand was exactly the setup we called, and price respected it precisely befo
post-image
HYPE+10.84%
Insiders are fading the daily bullish trend on ARB and setting up a massive short.

$ARB /USDT - SHORT

Trade Plan:
Entry: 0.21890 – 0.22308
SL: 0.24710
TP1: 0.20140
TP2: 0.18835
TP3: 0.16876

Why this setup?
Why now? The 1h price is pinned at 0.22099, which is the exact entry_ref for this setup, and the 1h ATR of 0.00837 shows that volatility is compressed enough for a sharp move. The 15m RSI at 59.09 proves the bounce is losing steam, not building momentum. The daily trend remains bullish, so this short is a reversal play against the higher-timeframe bias. The entry zone between 0.21890 a
post-image
ARB+26.21%
Today Market talk
live-cover
LIVE34
Smart money is fading the rally while retail chases strength.

$SOL /USDT - SHORT

Trade Plan:
Entry: 112.05 – 112.69
SL: 116.32
TP1: 109.41
TP2: 107.43
TP3: 104.47

Why this setup?
Why now? The daily trend remains bullish, but the 1h price has pushed to 112.38, aligning with a short entry at 112.37. The 15m RSI reading of 69.48 signals that momentum is overheating just as the 1h ATR of 1.266052 confirms genuine volatility. This sets a precise entry zone between 112.05 and 112.69, targeting the first objective at 109.41 and the deeper target at 107.43. The invalidation level at 102.51 is th
post-image
SOL+12.67%
#Gate广场中秋团圆局
#ZECKeepsRisingBreaking1500 $1,500 Is No Longer Just a Target It Is Becoming the Market’s New Reference Point
ZEC is trading around $1,480 after reaching a fresh intraday high near $1,537, while today’s low has been around $1,326. That creates an unusually wide $211 intraday range, showing just how aggressively liquidity is moving through the market. The latest independent market data places ZEC around $1,516 with a 24-hour range close to $1,328–$1,522, confirming that the $1,500 area has become the central price-discovery zone rather than a distant resistance level.
The import
post-image
ZEC-0.51%
Load More

Join 40 M users in our growing community

⚡️ Join 40 M users in the crypto craze discussion

💬 Engage with your favorite top creators

👍 See what interests you

Trending Topics

JapanRealEstatePowerChipStocksRise

58.62k Views3.54k Discussing

Japan's Nikkei extended gains on Sept 18, with real estate, power, and semiconductor sectors leading. Gate covers over 12,800 global stocks and ETFs, offering one-stop USDT trading across US, HK, Korean, and Japanese markets. [👉 Read more](https://www.odaily.news/en/newsflash/518749)

USAIConceptStocksRally

33.41k Views490 Discussing

GateTopsStockPerpetualCoverage

37.56k Views2.31k Discussing

View More