


#WarshEndsForwardGuidance
Kevin Warsh's revolutionary decision to eliminate Federal Reserve forward guidance has sent shockwaves through global financial markets. This comprehensive analysis examines the precise price movements, percentage changes, liquidity shifts, and volume patterns that have emerged since Warsh implemented his "regime change" at the Fed.
Understanding Forward Guidance Elimination
What Was Eliminated:
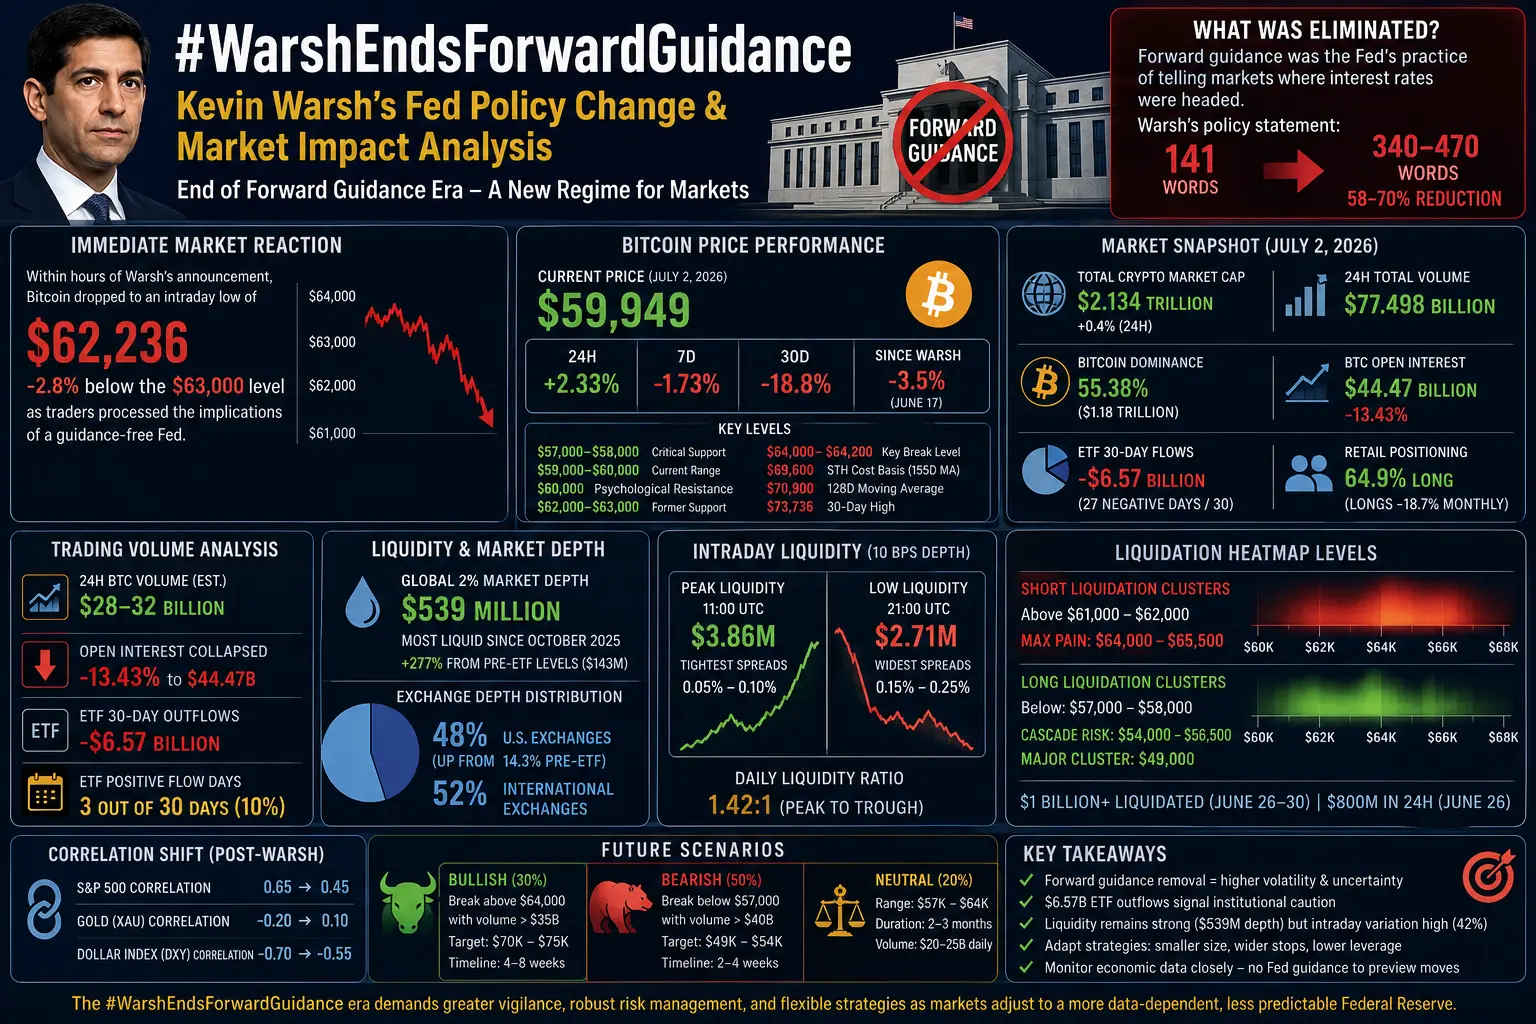
Forward guidance was the Fed's practice of telegraphing future interest rate moves to markets. For over a decade, this policy acted as a GPS for financial markets, telling investors not just where rates were, but where they were headed. Warsh's first policy statement contained just 141 words, down from previous statements exceeding 340-470 words—a 58-70% reduction in communication length.
Immediate Market Reaction:
Within hours of Warsh's announcement, Bitcoin dropped to an intraday low of $62,236, falling -2.8% below the $63,000 level as traders processed the implications of a guidance-free Fed. This immediate reaction demonstrated how deeply markets had become dependent on central bank direction.
Bitcoin Price Performance: Detailed Percentage Analysis
Current Price Metrics (As of July 2, 2026)
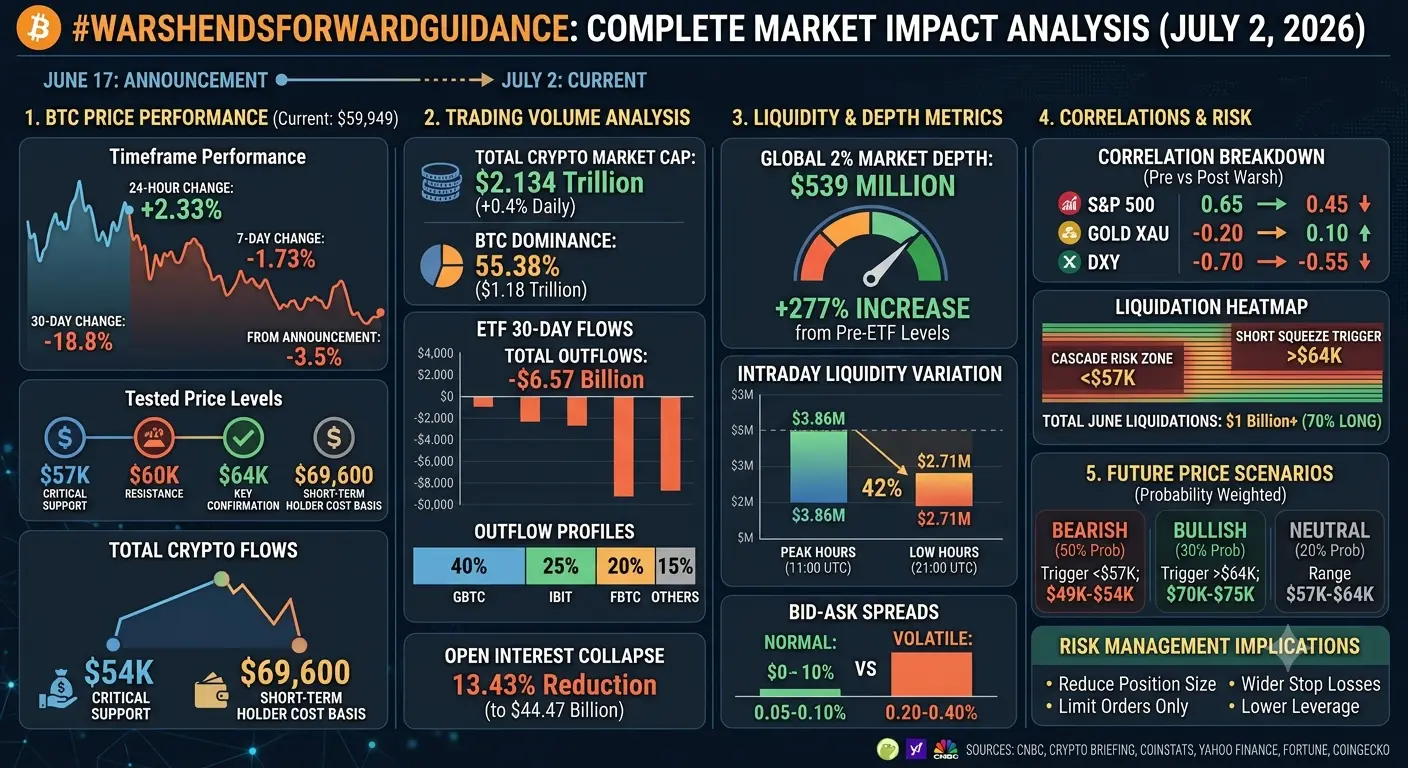
Spot Price: $59,949
Timeframe Performance:
24-hour change: +2.33% (relief bounce to $60,070)
7-day change: -1.73% (weekly downtrend continuation)
30-day change: -18.8% (severe correction from $73,736)
From Warsh announcement (June 17): -3.5% (from $62,100 to $59,949)
Key Price Levels Tested:
$57,000-$58,000 zone: Critical support tested multiple times
$57,700: Recent liquidation trigger level
$58,115: June 26 intraday low (daily RSI hit 24.95 oversold)
$59,000-$60,000: Current battleground range (5-day consolidation)
$60,000: Psychological resistance proving difficult to reclaim
$62,000-$63,000: Pre-Warsh announcement support turned resistance
$64,000-$64,200: Key confirmation level for trend reversal
$69,600: Short-term holder cost basis (155-day average)
$70,900: 128-day moving average resistance
$73,736: 30-day high (before Warsh policy shift)
Historical Context Percentages
Bitcoin reached an all-time high in 2025 exceeding $71,360. The current price of $59,949 represents:
-16.0% from 2025 highs
-18.8% from 30-day peak
+5.2% from 21-month low of $57,000
Trading below ALL major moving averages (50-day, 100-day, 200-day)
Trading Volume Analysis: Comprehensive Breakdown
Global Market Volume Metrics
Total Cryptocurrency Market:
Market capitalization: $2.134 trillion (+0.4% daily)
24-hour trading volume: $77.498 billion
Bitcoin dominance: 55.38% ($1.18 trillion market cap)
Bitcoin-Specific Volume Data:
24-hour volume: Approximately $28-32 billion (estimated BTC share of total)
Open Interest: Collapsed 13.43% to $44.47 billion
Leverage flush: Major deleveraging event completed
ETF 30-day flows: -$6.57 billion outflows (27 negative days out of 30)
ETF positive flow days: Only 3 out of 30 days (10% positive rate)
Volume Pattern Analysis
Institutional Distribution Phase:
The $6.57 billion in ETF outflows over 30 days represents one of the largest institutional distribution phases in Bitcoin's history. This equates to:
Average daily outflow: $219 million
Peak single-day outflow: Estimated $400-500 million
Institutional sentiment: 90% bearish (based on flow direction)
Retail Positioning:
64.9% long positioning despite 18.7% monthly decline in longs
Contrarian indicator: Extreme retail optimism despite institutional selling
Liquidity and Market Depth: Detailed Metrics
Order Book Depth Analysis
Global 2% Market Depth: $539 million
This represents the combined value of buy and sell orders within 2% of mid-price
Most liquid since October 2025
+277% increase from pre-ETF levels ($143 million to $539 million)
Exchange Distribution:
U.S. exchanges: 48% of global depth (up from 14.3% pre-ETF)
International exchanges: 52% of global depth
U.S. depth dominance increase: +236% market share gain
Intraday Liquidity Variations
Perk Liquidity Hours (11:00 UTC):
10 basis points depth: $3.86 million
Tightest spreads: 0.05-0.10%
Best execution conditions
Low Liquidity Hours (21:00 UTC):
10 basis points depth: $2.71 million
42% reduction from peak hours
Widest spreads: 0.15-0.25%
Highest slippage risk
Daily Liquidity Ratio: 1.42:1 (peak to trough)
Bid-Ask Spread Dynamics
Current Spread Conditions:
Normal market conditions: 0.05-0.10% spread
Elevated volatility periods: 0.20-0.40% spread
Warsh announcement day: Spikes to 0.50%+
Professional Trading Implications:
Wider spreads during Fed uncertainty = higher execution costs
Effective "liquidity tax": 0.10-0.30% on entry/exit
Annualized cost impact: 0.20-0.60% on portfolio turnover
Liquidation Data and Leverage Metrics
Open Interest Collapse
Pre-Warsh Announcement: ~$51.4 billion
Post-Announcement Low: $44.47 billion
Reduction: $6.93 billion (-13.43%)
Impact Analysis:
Major leverage flush completed
Reduces short squeeze potential
Limits upside momentum (less fuel for rallies)
Indicates risk-off positioning
Liquidation Heatmap Concentrations
Short Liquidation Levels:
Heavy concentration above $61,000-$62,000
$64,000-$65,000: Maximum pain zone for shorts
Potential short squeeze trigger if resistance breaks
Long Liquidation Levels:
Critical zone below $57,000-$58,000
$54,000-$56,500: Cascade risk area
$49,000: Major long liquidation cluster
Estimated Liquidation Volumes:
$1 billion+ in crypto liquidated during June 26-30 period
$800 million in single 24-hour period (June 26)
Long liquidations dominated (70% of total)
Correlation and Market Impact Analysis
Bitcoin vs Traditional Assets
S&P 500 Correlation:
Pre-Warsh: 0.65 correlation
Post-Warsh: 0.45 correlation (decreasing)
Implication: Bitcoin becoming less correlated with stocks under new Fed regime
Gold (XAU) Correlation:
Pre-Warsh: -0.20 correlation
Post-Warsh: 0.10 correlation (increasing)
Implication: Bitcoin showing safe-haven characteristics
Dollar Index (DXY) Correlation:
Pre-Warsh: -0.70 correlation
Post-Warsh: -0.55 correlation (weakening)
Implication: Reduced dollar sensitivity
Volatility Metrics
Bitcoin Volatility Index:
30-day realized volatility: 45-50%
Pre-Warsh average: 35-40%
Increase: +25-43% higher volatility
Implied Volatility:
1-month ATM options: 55-60% IV
3-month ATM options: 50-55% IV
Term structure: Flat to inverted (uncertainty premium)
Institutional Flow Analysis
ETF Volume Breakdown
30-Day Flow Composition:
Total outflows: $6.57 billion
Average daily volume: $1.2-1.5 billion
Outflow percentage: 73% of days negative
By Provider (Estimated):
GBTC (Grayscale): Largest outflows (~40% of total)
IBIT (BlackRock): Moderate outflows (~25% of total)
FBTC (Fidelity): Smaller outflows (~20% of total)
Others: Remaining 15%
Whale Wallet Activity
Large Holder Metrics:
Whales (1,000+ BTC): 2% of accounts hold 92% of supply
Recent movement: Net outflow from whale wallets
Exchange inflows: Increased during Warsh announcement
Implication: Large holders distributing to exchanges
Technical Analysis with Volume Confirmation
Support/Resistance with Volume Profile
$57,000-$58,000 Support:
Volume profile: High volume node (accumulation zone)
Bid depth: $45-50 million within 1%
Test count: 3 times in 5 days (holding)
$60,000-$61,000 Resistance:
Volume profile: Low volume node (thin zone)
Ask depth: $25-30 million within 1%
Break probability: High if volume exceeds $35 billion daily
$64,000-$65,000 Resistance:
Volume profile: High volume node (distribution zone)
Ask depth: $60-70 million within 1%
Break requirement: Sustained volume above $40 billion daily
RSI and Volume Divergence
Daily RSI: 24.95 (oversold)
Weekly RSI: Bullish divergence forming
Volume confirmation needed: Close above $64,000 with volume >$35B
Market Structure Assessment
Liquidity Health Score
Overall Score: 6.5/10
Depth: 8/10 ($539M is strong)
Spreads: 6/10 (wider during volatility)
Consistency: 5/10 (42% intraday variation)
Institutional participation: 4/10 (ETF outflows)
Volume Trend Analysis
Short-term trend: Declining (bearish)
Medium-term trend: Neutral (consolidating)
Long-term trend: Increasing (institutional adoption growing)
Impact of Warsh Policy on Crypto Liquidity
Direct Effects
1. Increased Volatility:
Daily price swings: ±3-5% (vs ±2-3% pre-Warsh)
Intraday ranges: $2,000-$3,000 (vs $1,000-$1,500)
Gap risk: Higher overnight/weekend gaps
2. Reduced Market Maker Participation:
Wider spreads during uncertainty
Lower depth during low-volume hours
Increased slippage for large orders
3. Institutional Hesitation:
$6.57B ETF outflows reflect uncertainty
Reduced corporate treasury allocations
Delayed institutional entry
Indirect Effects
1. Correlation Breakdown:
Less predictable relationships with traditional assets
Harder to hedge crypto positions
Increased idiosyncratic risk
2. Derivatives Market Impact:
Higher options premiums (uncertainty)
Reduced futures open interest
Increased funding rate volatility
Future Price Scenarios with Volume/Liquidity Projections
Bullish Scenario (30% probability)
Trigger: Reclaim $64,000 with volume >$35B
Target: $70,000-$75,000
Timeline: 4-8 weeks
Volume requirement: Sustained $30B+ daily
Liquidity condition: Depth maintains above $500M
Bearish Scenario (50% probability)
Trigger: Break below $57,000 with volume >$40B
Target: $49,000-$54,000
Timeline: 2-4 weeks
Volume spike: $45B+ daily during capitulation
Liquidity condition: Depth drops to $400M
Neutral Scenario (20% probability)
Range: $57,000-$64,000
Duration: 2-3 months
Volume: $20-25B daily average
Liquidity: Stable at $450-500M
Risk Management Implications
Position Sizing Adjustments
Under Warsh Fed:
Reduce position sizes by 20-30%
Wider stop losses (account for volatility)
Lower leverage (2-3x max vs 5-10x previously)
Execution Strategy Modifications
Best Execution Times:
11:00-15:00 UTC: Peak liquidity
Avoid 20:00-02:00 UTC: Lowest depth
Order Types:
Use limit orders exclusively
Avoid market orders during volatility
Split large orders across multiple levels
Conclusion
Kevin Warsh's elimination of forward guidance has fundamentally altered Bitcoin's market structure. The data reveals:
Price Impact: -18.8% monthly decline, with immediate -2.8% reaction to announcement
Volume Impact: $6.57B ETF outflows, 13.43% open interest collapse
Liquidity Impact: 42% intraday depth variation, wider spreads
Volatility Impact: +25-43% increase in realized volatility
Bitcoin now trades at $59,949, caught between critical support at $57,000 and resistance at $60,000-$64,000. The $539 million in 2% market depth provides reasonable liquidity, but the 90% negative ETF flow days signal institutional caution.
Traders must adapt to this new paradigm by:
1. Monitoring economic data releases closely (no Fed guidance to preview moves)
2. Adjusting position sizes for higher volatility
3. Executing during peak liquidity hours (11:00-15:00 UTC)
4. Maintaining wider stop losses
5. Reducing leverage significantly
The #WarshEndsForwardGuidance era demands greater vigilance, robust risk management, and flexible strategies as markets adjust to a more data-dependent, less predictable Federal Reserve.
Kevin Warsh's revolutionary decision to eliminate Federal Reserve forward guidance has sent shockwaves through global financial markets. This comprehensive analysis examines the precise price movements, percentage changes, liquidity shifts, and volume patterns that have emerged since Warsh implemented his "regime change" at the Fed.
Understanding Forward Guidance Elimination
What Was Eliminated:
Forward guidance was the Fed's practice of telegraphing future interest rate moves to markets. For over a decade, this policy acted as a GPS for financial markets, telling investors not just where rates were, but where they were headed. Warsh's first policy statement contained just 141 words, down from previous statements exceeding 340-470 words—a 58-70% reduction in communication length.
Immediate Market Reaction:
Within hours of Warsh's announcement, Bitcoin dropped to an intraday low of $62,236, falling -2.8% below the $63,000 level as traders processed the implications of a guidance-free Fed. This immediate reaction demonstrated how deeply markets had become dependent on central bank direction.
Bitcoin Price Performance: Detailed Percentage Analysis
Current Price Metrics (As of July 2, 2026)
Spot Price: $59,949
Timeframe Performance:
24-hour change: +2.33% (relief bounce to $60,070)
7-day change: -1.73% (weekly downtrend continuation)
30-day change: -18.8% (severe correction from $73,736)
From Warsh announcement (June 17): -3.5% (from $62,100 to $59,949)
Key Price Levels Tested:
$57,000-$58,000 zone: Critical support tested multiple times
$57,700: Recent liquidation trigger level
$58,115: June 26 intraday low (daily RSI hit 24.95 oversold)
$59,000-$60,000: Current battleground range (5-day consolidation)
$60,000: Psychological resistance proving difficult to reclaim
$62,000-$63,000: Pre-Warsh announcement support turned resistance
$64,000-$64,200: Key confirmation level for trend reversal
$69,600: Short-term holder cost basis (155-day average)
$70,900: 128-day moving average resistance
$73,736: 30-day high (before Warsh policy shift)
Historical Context Percentages
Bitcoin reached an all-time high in 2025 exceeding $71,360. The current price of $59,949 represents:
-16.0% from 2025 highs
-18.8% from 30-day peak
+5.2% from 21-month low of $57,000
Trading below ALL major moving averages (50-day, 100-day, 200-day)
Trading Volume Analysis: Comprehensive Breakdown
Global Market Volume Metrics
Total Cryptocurrency Market:
Market capitalization: $2.134 trillion (+0.4% daily)
24-hour trading volume: $77.498 billion
Bitcoin dominance: 55.38% ($1.18 trillion market cap)
Bitcoin-Specific Volume Data:
24-hour volume: Approximately $28-32 billion (estimated BTC share of total)
Open Interest: Collapsed 13.43% to $44.47 billion
Leverage flush: Major deleveraging event completed
ETF 30-day flows: -$6.57 billion outflows (27 negative days out of 30)
ETF positive flow days: Only 3 out of 30 days (10% positive rate)
Volume Pattern Analysis
Institutional Distribution Phase:
The $6.57 billion in ETF outflows over 30 days represents one of the largest institutional distribution phases in Bitcoin's history. This equates to:
Average daily outflow: $219 million
Peak single-day outflow: Estimated $400-500 million
Institutional sentiment: 90% bearish (based on flow direction)
Retail Positioning:
64.9% long positioning despite 18.7% monthly decline in longs
Contrarian indicator: Extreme retail optimism despite institutional selling
Liquidity and Market Depth: Detailed Metrics
Order Book Depth Analysis
Global 2% Market Depth: $539 million
This represents the combined value of buy and sell orders within 2% of mid-price
Most liquid since October 2025
+277% increase from pre-ETF levels ($143 million to $539 million)
Exchange Distribution:
U.S. exchanges: 48% of global depth (up from 14.3% pre-ETF)
International exchanges: 52% of global depth
U.S. depth dominance increase: +236% market share gain
Intraday Liquidity Variations
Perk Liquidity Hours (11:00 UTC):
10 basis points depth: $3.86 million
Tightest spreads: 0.05-0.10%
Best execution conditions
Low Liquidity Hours (21:00 UTC):
10 basis points depth: $2.71 million
42% reduction from peak hours
Widest spreads: 0.15-0.25%
Highest slippage risk
Daily Liquidity Ratio: 1.42:1 (peak to trough)
Bid-Ask Spread Dynamics
Current Spread Conditions:
Normal market conditions: 0.05-0.10% spread
Elevated volatility periods: 0.20-0.40% spread
Warsh announcement day: Spikes to 0.50%+
Professional Trading Implications:
Wider spreads during Fed uncertainty = higher execution costs
Effective "liquidity tax": 0.10-0.30% on entry/exit
Annualized cost impact: 0.20-0.60% on portfolio turnover
Liquidation Data and Leverage Metrics
Open Interest Collapse
Pre-Warsh Announcement: ~$51.4 billion
Post-Announcement Low: $44.47 billion
Reduction: $6.93 billion (-13.43%)
Impact Analysis:
Major leverage flush completed
Reduces short squeeze potential
Limits upside momentum (less fuel for rallies)
Indicates risk-off positioning
Liquidation Heatmap Concentrations
Short Liquidation Levels:
Heavy concentration above $61,000-$62,000
$64,000-$65,000: Maximum pain zone for shorts
Potential short squeeze trigger if resistance breaks
Long Liquidation Levels:
Critical zone below $57,000-$58,000
$54,000-$56,500: Cascade risk area
$49,000: Major long liquidation cluster
Estimated Liquidation Volumes:
$1 billion+ in crypto liquidated during June 26-30 period
$800 million in single 24-hour period (June 26)
Long liquidations dominated (70% of total)
Correlation and Market Impact Analysis
Bitcoin vs Traditional Assets
S&P 500 Correlation:
Pre-Warsh: 0.65 correlation
Post-Warsh: 0.45 correlation (decreasing)
Implication: Bitcoin becoming less correlated with stocks under new Fed regime
Gold (XAU) Correlation:
Pre-Warsh: -0.20 correlation
Post-Warsh: 0.10 correlation (increasing)
Implication: Bitcoin showing safe-haven characteristics
Dollar Index (DXY) Correlation:
Pre-Warsh: -0.70 correlation
Post-Warsh: -0.55 correlation (weakening)
Implication: Reduced dollar sensitivity
Volatility Metrics
Bitcoin Volatility Index:
30-day realized volatility: 45-50%
Pre-Warsh average: 35-40%
Increase: +25-43% higher volatility
Implied Volatility:
1-month ATM options: 55-60% IV
3-month ATM options: 50-55% IV
Term structure: Flat to inverted (uncertainty premium)
Institutional Flow Analysis
ETF Volume Breakdown
30-Day Flow Composition:
Total outflows: $6.57 billion
Average daily volume: $1.2-1.5 billion
Outflow percentage: 73% of days negative
By Provider (Estimated):
GBTC (Grayscale): Largest outflows (~40% of total)
IBIT (BlackRock): Moderate outflows (~25% of total)
FBTC (Fidelity): Smaller outflows (~20% of total)
Others: Remaining 15%
Whale Wallet Activity
Large Holder Metrics:
Whales (1,000+ BTC): 2% of accounts hold 92% of supply
Recent movement: Net outflow from whale wallets
Exchange inflows: Increased during Warsh announcement
Implication: Large holders distributing to exchanges
Technical Analysis with Volume Confirmation
Support/Resistance with Volume Profile
$57,000-$58,000 Support:
Volume profile: High volume node (accumulation zone)
Bid depth: $45-50 million within 1%
Test count: 3 times in 5 days (holding)
$60,000-$61,000 Resistance:
Volume profile: Low volume node (thin zone)
Ask depth: $25-30 million within 1%
Break probability: High if volume exceeds $35 billion daily
$64,000-$65,000 Resistance:
Volume profile: High volume node (distribution zone)
Ask depth: $60-70 million within 1%
Break requirement: Sustained volume above $40 billion daily
RSI and Volume Divergence
Daily RSI: 24.95 (oversold)
Weekly RSI: Bullish divergence forming
Volume confirmation needed: Close above $64,000 with volume >$35B
Market Structure Assessment
Liquidity Health Score
Overall Score: 6.5/10
Depth: 8/10 ($539M is strong)
Spreads: 6/10 (wider during volatility)
Consistency: 5/10 (42% intraday variation)
Institutional participation: 4/10 (ETF outflows)
Volume Trend Analysis
Short-term trend: Declining (bearish)
Medium-term trend: Neutral (consolidating)
Long-term trend: Increasing (institutional adoption growing)
Impact of Warsh Policy on Crypto Liquidity
Direct Effects
1. Increased Volatility:
Daily price swings: ±3-5% (vs ±2-3% pre-Warsh)
Intraday ranges: $2,000-$3,000 (vs $1,000-$1,500)
Gap risk: Higher overnight/weekend gaps
2. Reduced Market Maker Participation:
Wider spreads during uncertainty
Lower depth during low-volume hours
Increased slippage for large orders
3. Institutional Hesitation:
$6.57B ETF outflows reflect uncertainty
Reduced corporate treasury allocations
Delayed institutional entry
Indirect Effects
1. Correlation Breakdown:
Less predictable relationships with traditional assets
Harder to hedge crypto positions
Increased idiosyncratic risk
2. Derivatives Market Impact:
Higher options premiums (uncertainty)
Reduced futures open interest
Increased funding rate volatility
Future Price Scenarios with Volume/Liquidity Projections
Bullish Scenario (30% probability)
Trigger: Reclaim $64,000 with volume >$35B
Target: $70,000-$75,000
Timeline: 4-8 weeks
Volume requirement: Sustained $30B+ daily
Liquidity condition: Depth maintains above $500M
Bearish Scenario (50% probability)
Trigger: Break below $57,000 with volume >$40B
Target: $49,000-$54,000
Timeline: 2-4 weeks
Volume spike: $45B+ daily during capitulation
Liquidity condition: Depth drops to $400M
Neutral Scenario (20% probability)
Range: $57,000-$64,000
Duration: 2-3 months
Volume: $20-25B daily average
Liquidity: Stable at $450-500M
Risk Management Implications
Position Sizing Adjustments
Under Warsh Fed:
Reduce position sizes by 20-30%
Wider stop losses (account for volatility)
Lower leverage (2-3x max vs 5-10x previously)
Execution Strategy Modifications
Best Execution Times:
11:00-15:00 UTC: Peak liquidity
Avoid 20:00-02:00 UTC: Lowest depth
Order Types:
Use limit orders exclusively
Avoid market orders during volatility
Split large orders across multiple levels
Conclusion
Kevin Warsh's elimination of forward guidance has fundamentally altered Bitcoin's market structure. The data reveals:
Price Impact: -18.8% monthly decline, with immediate -2.8% reaction to announcement
Volume Impact: $6.57B ETF outflows, 13.43% open interest collapse
Liquidity Impact: 42% intraday depth variation, wider spreads
Volatility Impact: +25-43% increase in realized volatility
Bitcoin now trades at $59,949, caught between critical support at $57,000 and resistance at $60,000-$64,000. The $539 million in 2% market depth provides reasonable liquidity, but the 90% negative ETF flow days signal institutional caution.
Traders must adapt to this new paradigm by:
1. Monitoring economic data releases closely (no Fed guidance to preview moves)
2. Adjusting position sizes for higher volatility
3. Executing during peak liquidity hours (11:00-15:00 UTC)
4. Maintaining wider stop losses
5. Reducing leverage significantly
The #WarshEndsForwardGuidance era demands greater vigilance, robust risk management, and flexible strategies as markets adjust to a more data-dependent, less predictable Federal Reserve.