


#30YearTreasuryYieldBreaks5%
The 30-Year Treasury Yield Above 5% And The Beginning Of A Global Macro Regime Shift
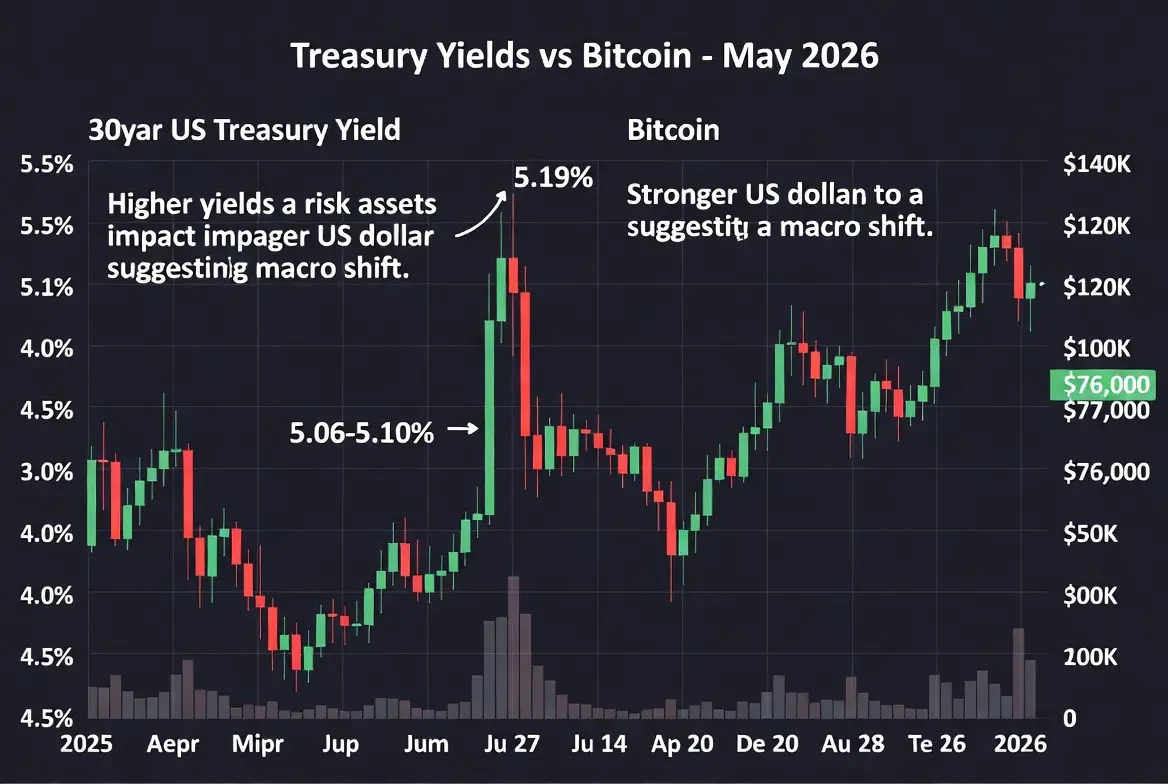
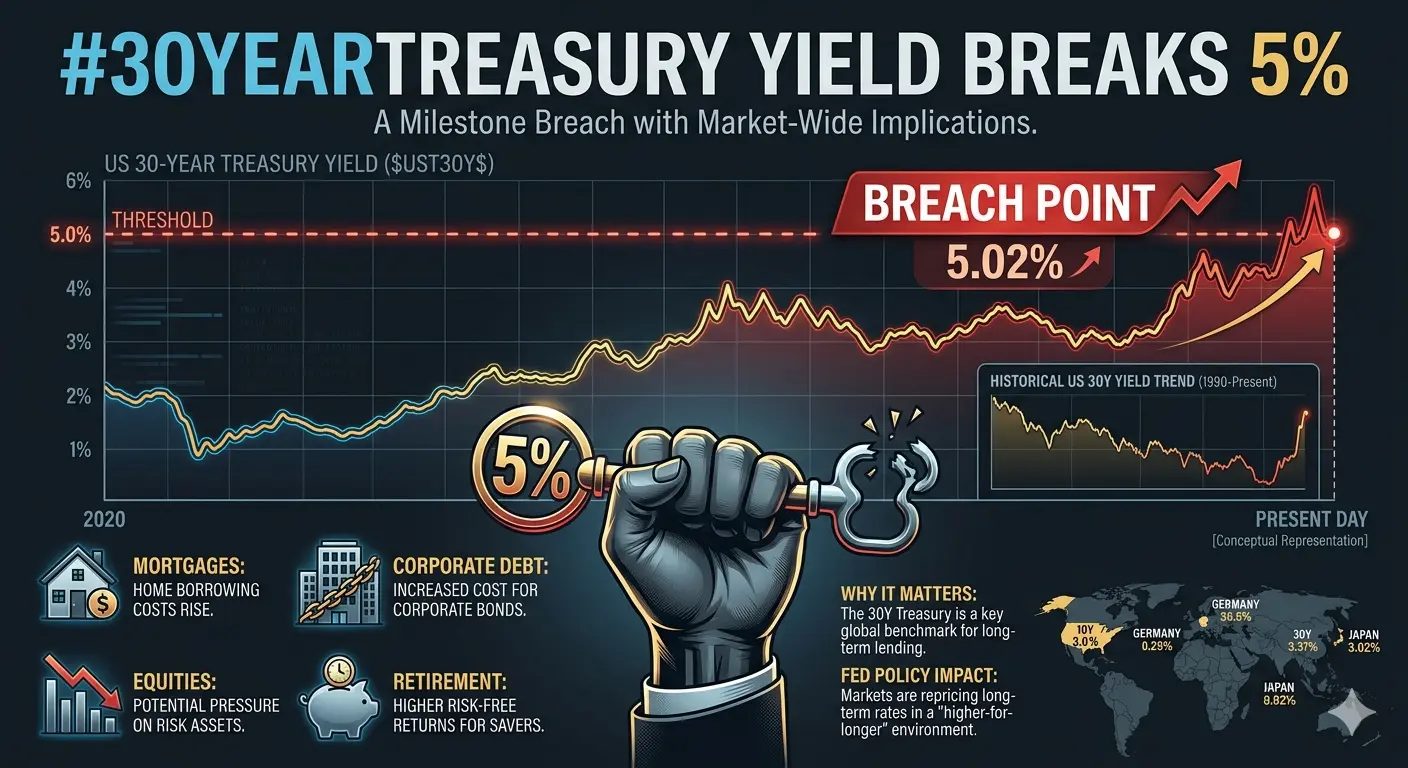
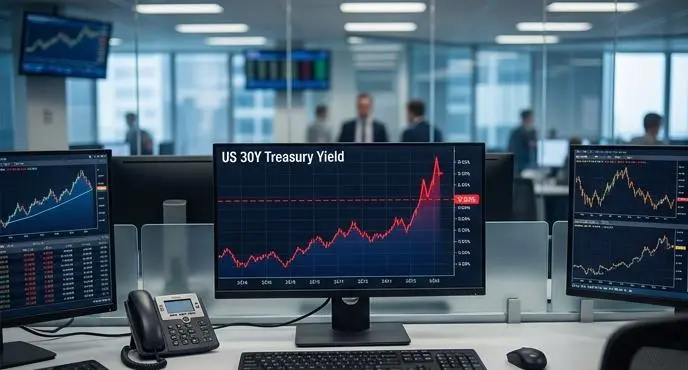
The United States 30-year Treasury yield moving above the critical 5 percent threshold and stabilizing in the $5.15 percent to $5.19 percent range represents one of the most significant macroeconomic regime shifts since the pre-2007 financial cycle. This is not a short-term volatility spike. It is a structural repricing of global capital that signals the end of the ultra-cheap money era and the beginning of a permanently higher cost of capital environment.
The entire yield curve confirms this shift. The 10-year Treasury near $4.65 percent and the 2-year near $4.12 percent show that markets are pricing persistent inflation, heavy sovereign debt supply, and structurally tighter liquidity conditions across the global economy. Long-duration money is no longer cheap, stable, or predictable.
Global Sovereign Bond Markets Enter A Synchronized Duration Shock
This movement is not isolated to the United States. It is global.
The UK 30-year gilt is near $5.8–$5.9 percent, Germany is at multi-year yield highs, and Japan’s yield structure is breaking decades of ultra-low stability.
This reflects a synchronized global duration shock driven by:
Persistent inflation pressure
Expanding fiscal deficits
Rising sovereign debt issuance
Geopolitical instability
Bond markets are no longer controlled purely by central bank suppression. They are now driven by real market pricing of risk, inflation, and debt sustainability.
Iran Conflict And Energy Shock Are Amplifying Inflation Pressure
Geopolitical tension around Iran and disruptions in the Strait of Hormuz are reinforcing global inflation trends.
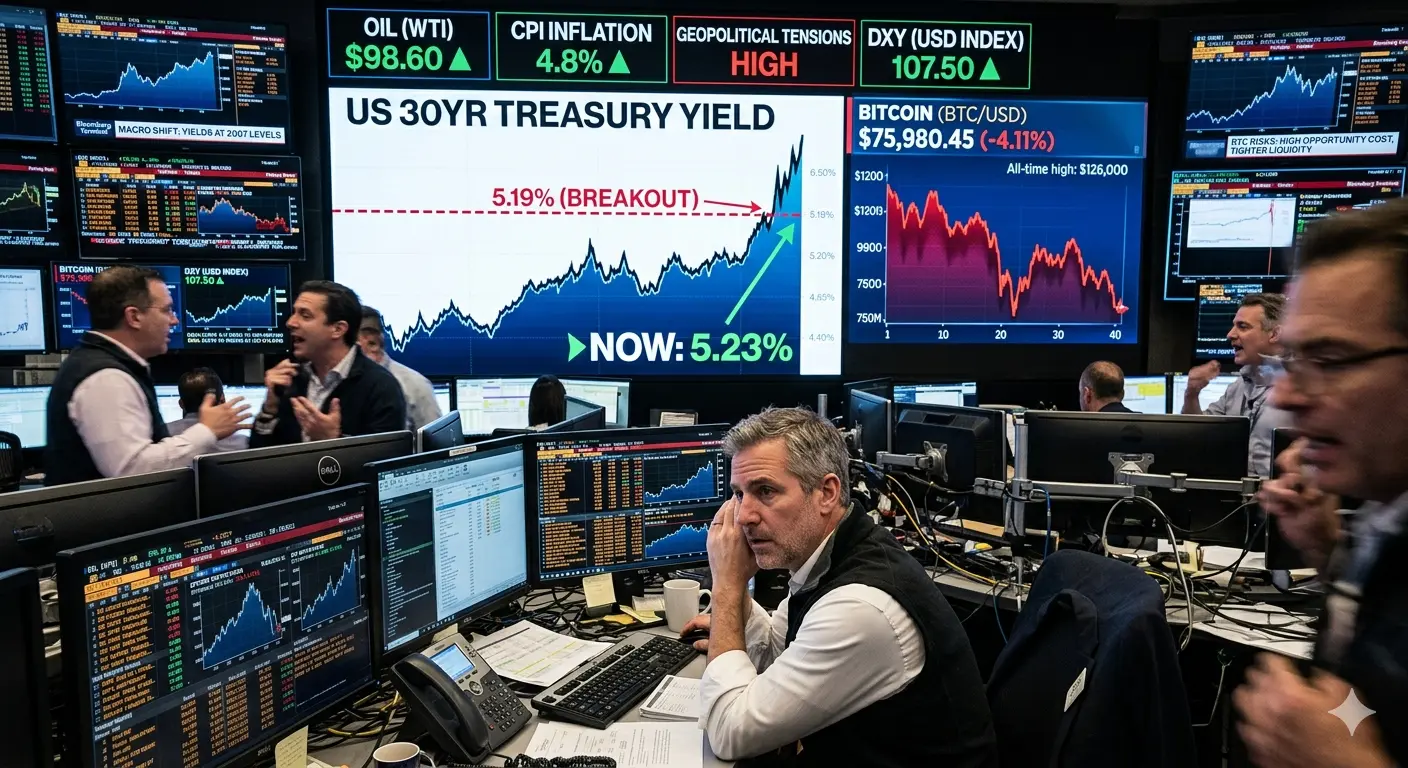
Oil remains in the $105–$118 range, while natural gas volatility continues due to supply uncertainty. This energy shock is now the primary transmission channel for inflation.
CPI inflation: ~$3.8 percent YoY
PPI inflation: ~$6 percent
This confirms inflation is not fading—it is evolving into a second wave driven by energy, logistics, and wage rigidity.
Meanwhile, US federal debt exceeds $36.8 trillion, with annual interest costs approaching $952 billion, creating a compounding fiscal pressure loop where higher yields generate even more debt issuance.
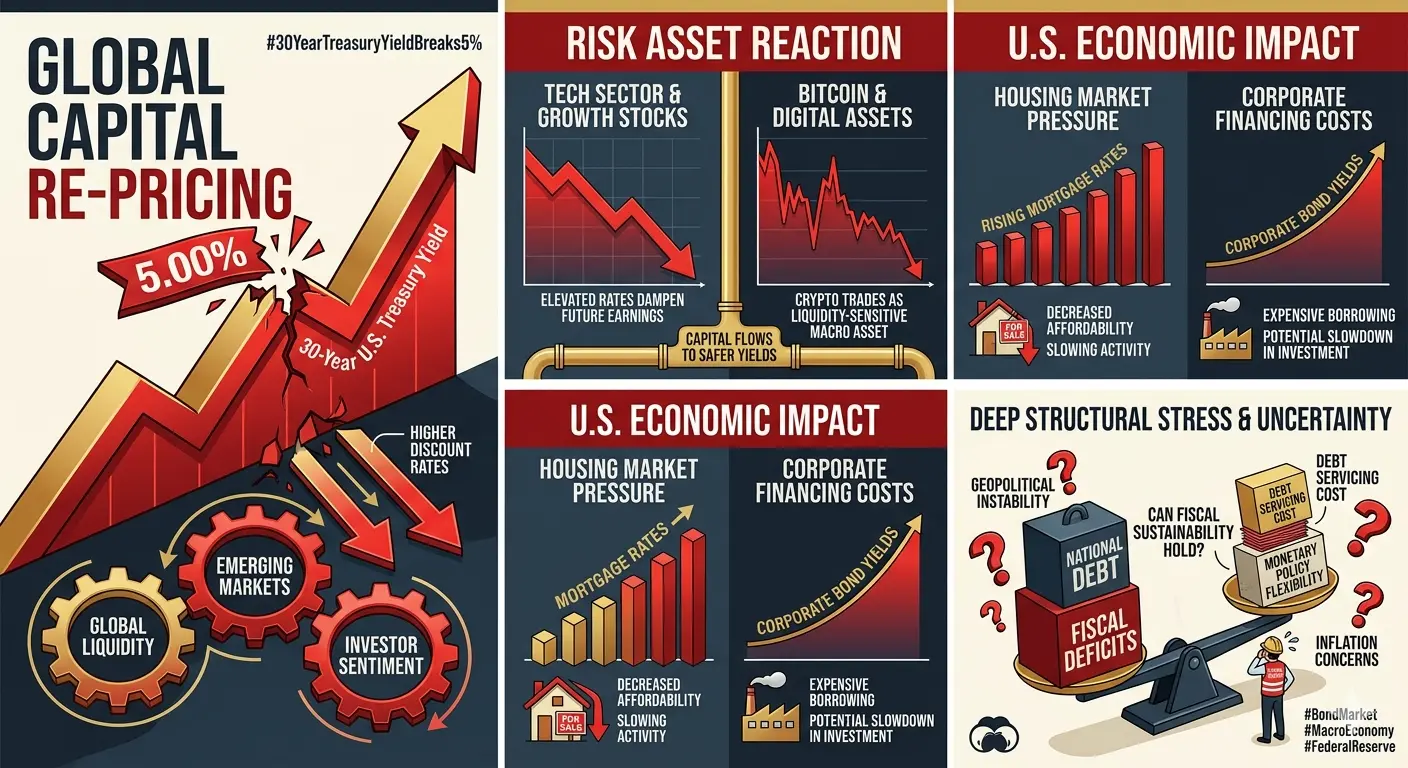
Why A 5 Percent Yield Changes Everything For Bitcoin And Risk Assets
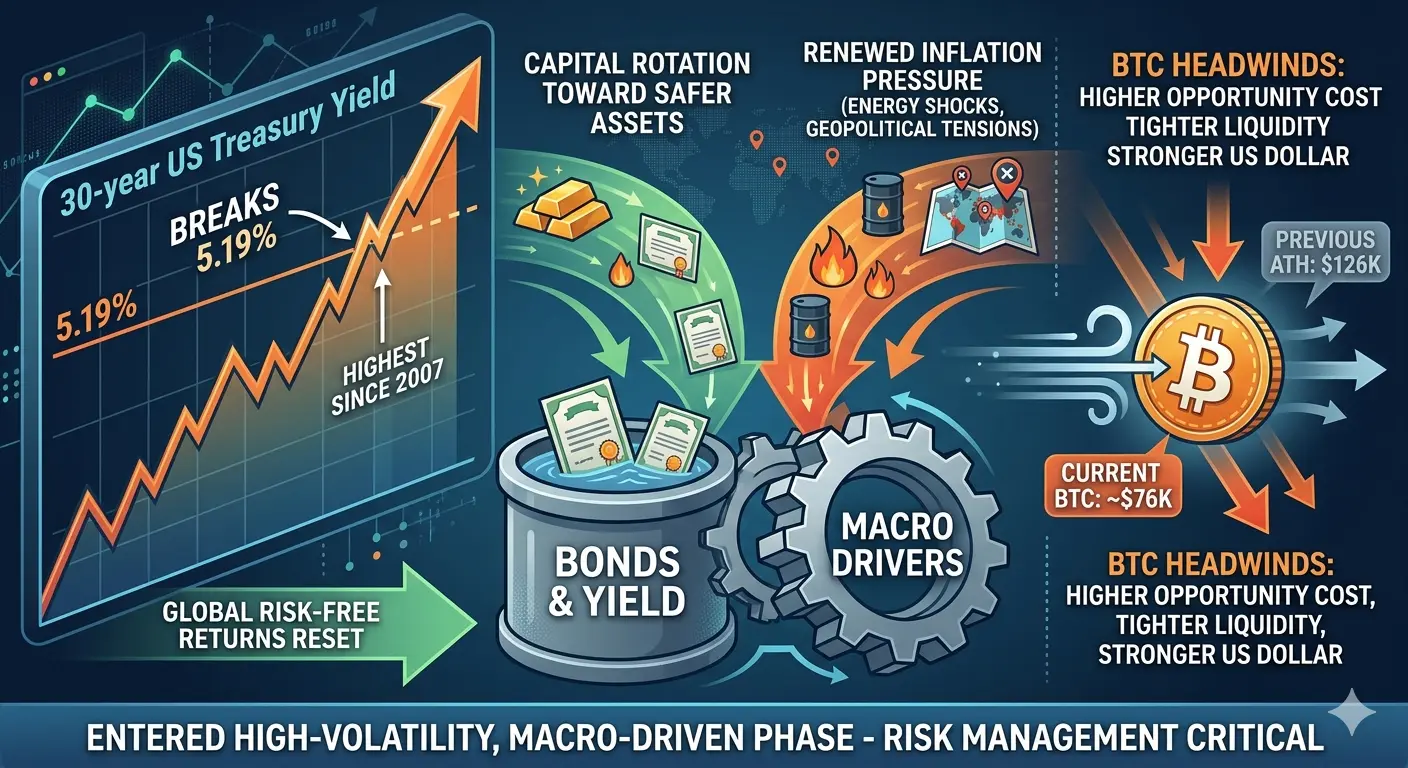
A 30-year yield above 5 percent is a global capital allocation reset.
Investors can now earn ~$5 percent risk-free returns from sovereign bonds. This dramatically increases the opportunity cost of holding non-yielding assets like Bitcoin.
The previous cycle was defined by:
Zero interest rates
Excess liquidity
Cheap leverage
That environment no longer exists.
Now:
Fixed income offers attractive returns
Volatility is lower in bonds
Institutional capital rotates toward safety
This is already visible:
Slower ETF inflows into Bitcoin
Reduced risk appetite in derivatives markets
Increasing sensitivity to liquidity tightening
At the same time, higher yields strengthen the US dollar, which historically creates headwinds for Bitcoin and risk assets.
Bitcoin Market Structure Under Macro Pressure
Bitcoin is currently trading in the $74,000–$76,000 range after repeated rejection near $78,000–$80,000.
From its $126,000 cycle high, BTC has corrected nearly 39 percent, reflecting macro-driven liquidity contraction rather than internal structural failure.
This is not panic selling. It is controlled institutional distribution.
Bitcoin remains fundamentally strong due to:
ETF adoption
Fixed supply model
Halving cycle dynamics
Long-term sovereign debt concerns
But short-term behavior is fully dominated by macro liquidity conditions.
Current Market Snapshot
BTC Price: $74,000–$76,000
ATH: $126,000
Drawdown: ~39 percent
Market Cap: ~$1.5 trillion
Altcoins remain heavily compressed:
Ethereum: ~$4,000–$4,200
Solana: below major resistance near $210
Broad altcoin market: down 50–80 percent
Technical Structure And Key Levels
Bitcoin remains in a transitional phase with no confirmed macro reversal.
Bearish momentum dominates the 4H structure, while the daily chart shows price below major moving averages.
Support Zones:
$73,000–$74,000 → primary liquidity base
$70,000–$72,000 → institutional accumulation zone
$65,000 → macro stress extension zone
Resistance Zones:
$75,700 → immediate supply barrier
$77,600 → structural rejection zone
$79,800 → macro trend reversal trigger
$85,000 → breakout confirmation
Bitcoin Scenarios Based On Treasury Yields
If Yields Rise To $5.3–$5.5 Percent:
BTC retests $73,000–$74,000
Potential extension toward $70,000–$72,000
Extreme stress scenario: $65,000
If Yields Stabilize Near $5 Percent:
BTC consolidates in $73,000–$80,000 range
Range-bound volatility continues
If Yields Fall Below $4.8 Percent:
Liquidity returns
BTC recovery toward $80,000–$85,000+
Long-term models still project $120,000–$200,000 potential over the broader cycle if adoption and debt dynamics continue.
Why Bitcoin Reacts To Yields
Higher yields increase risk-free returns, reducing demand for volatile assets. They also tighten liquidity, reduce leverage, and strengthen the dollar.
However, structurally rising sovereign debt may eventually weaken trust in fiat systems, reinforcing Bitcoin’s long-term narrative as a non-sovereign monetary hedge.
Trading Strategy In A Macro-Dominated Environment
This is a capital preservation phase, not a leverage phase.
Accumulation Strategy:
Primary zone: $73,000–$76,000
Deep zone: $70,000–$72,000
Extreme opportunity: ~$65,000
Risk Management:
Avoid leverage
Prioritize spot exposure
Track Treasury yields daily (5%–5.3% zone is critical)
Monitor oil, inflation, and Fed policy
Aggressive bullish positioning only becomes valid if BTC reclaims $77,600–$80,000 with strong confirmation.
Final Conclusion
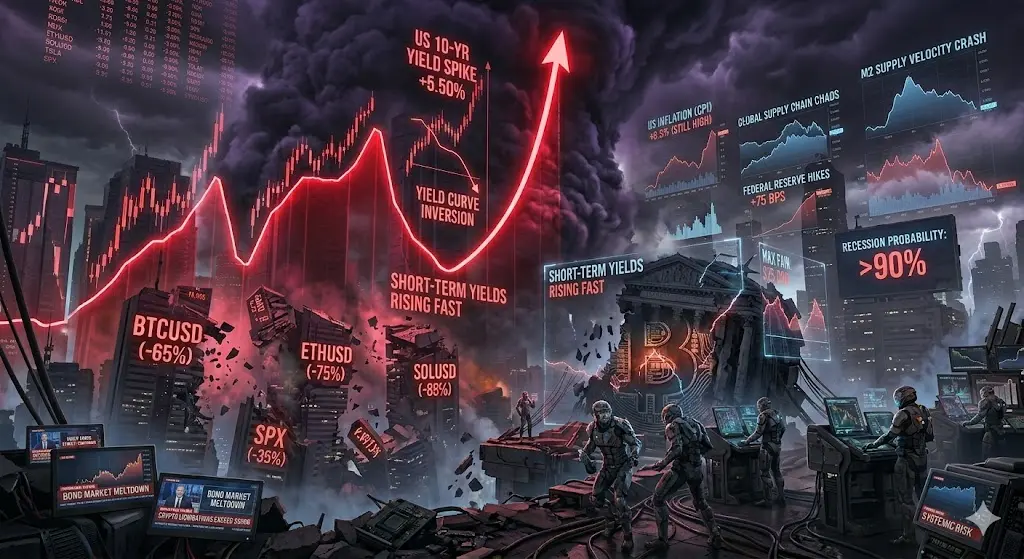
The 30-year Treasury yield breaking above 5 percent represents a historic global macro reset that is reshaping capital flows across every asset class.
Higher yields compress liquidity, strengthen fixed-income appeal, and reduce risk appetite across speculative markets including cryptocurrencies.
Bitcoin is not structurally broken. It is reacting to a global liquidity transition where bond markets currently dominate price discovery across financial systems.
The most important variable going forward remains the $5 percent to $5.3 percent yield zone. Stability or decline would unlock liquidity and upside potential, while further increases toward $5.5 percent or $6 percent would deepen macro pressure across all risk assets.
In essence, Bitcoin is not in a structural downtrend. It is in a macro liquidity cycle controlled by global bond markets.
@Gate_Square @Gate广场_Official #TradfiTradingChallenge
The 30-Year Treasury Yield Above 5% And The Beginning Of A Global Macro Regime Shift
The United States 30-year Treasury yield moving above the critical 5 percent threshold and stabilizing in the $5.15 percent to $5.19 percent range represents one of the most significant macroeconomic regime shifts since the pre-2007 financial cycle. This is not a short-term volatility spike. It is a structural repricing of global capital that signals the end of the ultra-cheap money era and the beginning of a permanently higher cost of capital environment.
The entire yield curve confirms this shift. The 10-year Treasury near $4.65 percent and the 2-year near $4.12 percent show that markets are pricing persistent inflation, heavy sovereign debt supply, and structurally tighter liquidity conditions across the global economy. Long-duration money is no longer cheap, stable, or predictable.
Global Sovereign Bond Markets Enter A Synchronized Duration Shock
This movement is not isolated to the United States. It is global.
The UK 30-year gilt is near $5.8–$5.9 percent, Germany is at multi-year yield highs, and Japan’s yield structure is breaking decades of ultra-low stability.
This reflects a synchronized global duration shock driven by:
Persistent inflation pressure
Expanding fiscal deficits
Rising sovereign debt issuance
Geopolitical instability
Bond markets are no longer controlled purely by central bank suppression. They are now driven by real market pricing of risk, inflation, and debt sustainability.
Iran Conflict And Energy Shock Are Amplifying Inflation Pressure
Geopolitical tension around Iran and disruptions in the Strait of Hormuz are reinforcing global inflation trends.
Oil remains in the $105–$118 range, while natural gas volatility continues due to supply uncertainty. This energy shock is now the primary transmission channel for inflation.
CPI inflation: ~$3.8 percent YoY
PPI inflation: ~$6 percent
This confirms inflation is not fading—it is evolving into a second wave driven by energy, logistics, and wage rigidity.
Meanwhile, US federal debt exceeds $36.8 trillion, with annual interest costs approaching $952 billion, creating a compounding fiscal pressure loop where higher yields generate even more debt issuance.
Why A 5 Percent Yield Changes Everything For Bitcoin And Risk Assets
A 30-year yield above 5 percent is a global capital allocation reset.
Investors can now earn ~$5 percent risk-free returns from sovereign bonds. This dramatically increases the opportunity cost of holding non-yielding assets like Bitcoin.
The previous cycle was defined by:
Zero interest rates
Excess liquidity
Cheap leverage
That environment no longer exists.
Now:
Fixed income offers attractive returns
Volatility is lower in bonds
Institutional capital rotates toward safety
This is already visible:
Slower ETF inflows into Bitcoin
Reduced risk appetite in derivatives markets
Increasing sensitivity to liquidity tightening
At the same time, higher yields strengthen the US dollar, which historically creates headwinds for Bitcoin and risk assets.
Bitcoin Market Structure Under Macro Pressure
Bitcoin is currently trading in the $74,000–$76,000 range after repeated rejection near $78,000–$80,000.
From its $126,000 cycle high, BTC has corrected nearly 39 percent, reflecting macro-driven liquidity contraction rather than internal structural failure.
This is not panic selling. It is controlled institutional distribution.
Bitcoin remains fundamentally strong due to:
ETF adoption
Fixed supply model
Halving cycle dynamics
Long-term sovereign debt concerns
But short-term behavior is fully dominated by macro liquidity conditions.
Current Market Snapshot
BTC Price: $74,000–$76,000
ATH: $126,000
Drawdown: ~39 percent
Market Cap: ~$1.5 trillion
Altcoins remain heavily compressed:
Ethereum: ~$4,000–$4,200
Solana: below major resistance near $210
Broad altcoin market: down 50–80 percent
Technical Structure And Key Levels
Bitcoin remains in a transitional phase with no confirmed macro reversal.
Bearish momentum dominates the 4H structure, while the daily chart shows price below major moving averages.
Support Zones:
$73,000–$74,000 → primary liquidity base
$70,000–$72,000 → institutional accumulation zone
$65,000 → macro stress extension zone
Resistance Zones:
$75,700 → immediate supply barrier
$77,600 → structural rejection zone
$79,800 → macro trend reversal trigger
$85,000 → breakout confirmation
Bitcoin Scenarios Based On Treasury Yields
If Yields Rise To $5.3–$5.5 Percent:
BTC retests $73,000–$74,000
Potential extension toward $70,000–$72,000
Extreme stress scenario: $65,000
If Yields Stabilize Near $5 Percent:
BTC consolidates in $73,000–$80,000 range
Range-bound volatility continues
If Yields Fall Below $4.8 Percent:
Liquidity returns
BTC recovery toward $80,000–$85,000+
Long-term models still project $120,000–$200,000 potential over the broader cycle if adoption and debt dynamics continue.
Why Bitcoin Reacts To Yields
Higher yields increase risk-free returns, reducing demand for volatile assets. They also tighten liquidity, reduce leverage, and strengthen the dollar.
However, structurally rising sovereign debt may eventually weaken trust in fiat systems, reinforcing Bitcoin’s long-term narrative as a non-sovereign monetary hedge.
Trading Strategy In A Macro-Dominated Environment
This is a capital preservation phase, not a leverage phase.
Accumulation Strategy:
Primary zone: $73,000–$76,000
Deep zone: $70,000–$72,000
Extreme opportunity: ~$65,000
Risk Management:
Avoid leverage
Prioritize spot exposure
Track Treasury yields daily (5%–5.3% zone is critical)
Monitor oil, inflation, and Fed policy
Aggressive bullish positioning only becomes valid if BTC reclaims $77,600–$80,000 with strong confirmation.
Final Conclusion
The 30-year Treasury yield breaking above 5 percent represents a historic global macro reset that is reshaping capital flows across every asset class.
Higher yields compress liquidity, strengthen fixed-income appeal, and reduce risk appetite across speculative markets including cryptocurrencies.
Bitcoin is not structurally broken. It is reacting to a global liquidity transition where bond markets currently dominate price discovery across financial systems.
The most important variable going forward remains the $5 percent to $5.3 percent yield zone. Stability or decline would unlock liquidity and upside potential, while further increases toward $5.5 percent or $6 percent would deepen macro pressure across all risk assets.
In essence, Bitcoin is not in a structural downtrend. It is in a macro liquidity cycle controlled by global bond markets.
@Gate_Square @Gate广场_Official #TradfiTradingChallenge