














#Gate广场万圣节 👻 The Scariest Thing in Crypto Isn't a Ghost, It's a Bad Trade. A Horror Story Told in October's Real Numbers
Two traders, Sam and Ana, are fictional composites used to tell this story. Every price, flow and liquidation figure below is real. Their story starts on October 19, when Bitcoin looked like a treat.
The treat that was a trick
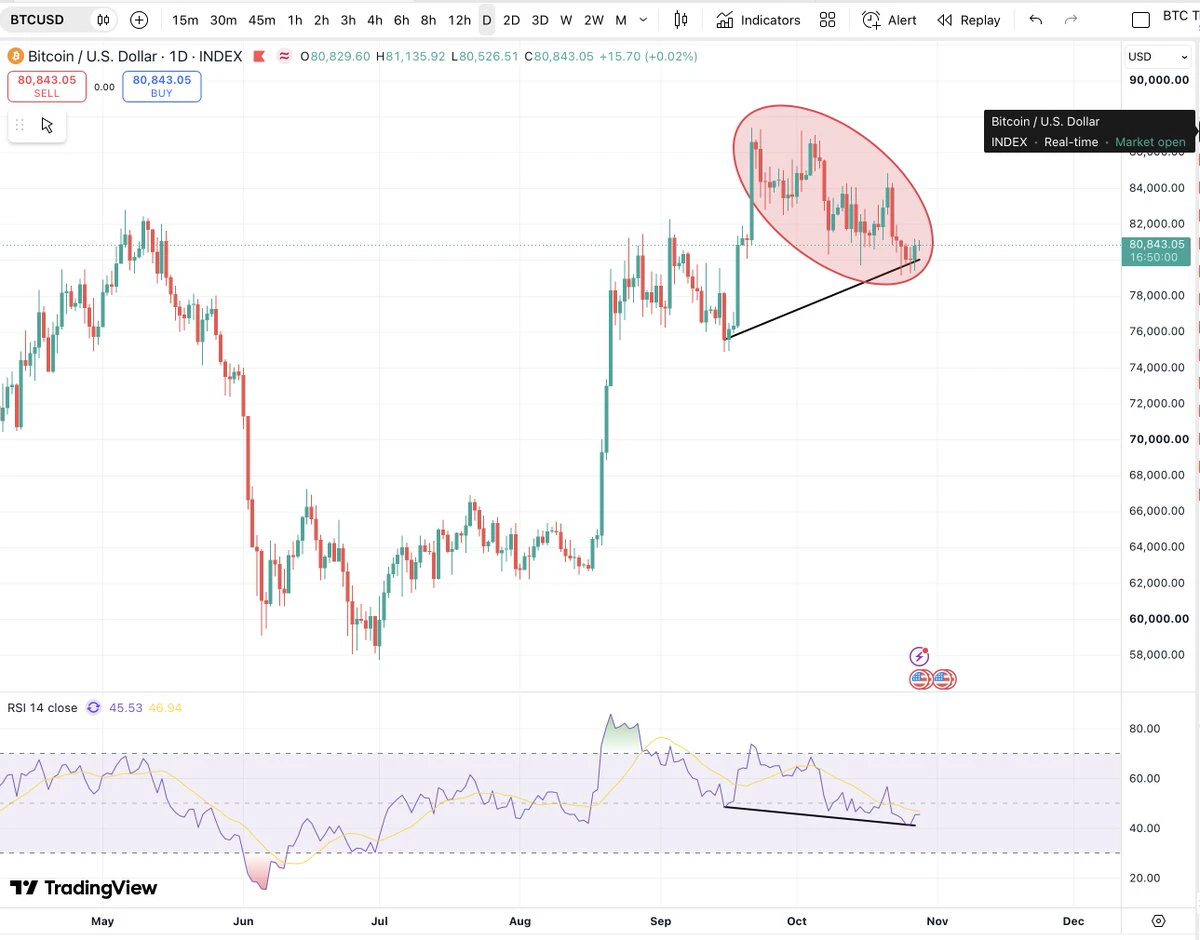
From October 19 to 21, US spot Bitcoin ETFs took in more than $1 billion and BTC climbed toward $85,000. Fear and Greed read 63, in greed territory. On October 21 the rally stalled at $84,840, below the October 2 peak of $87,197, a lower high. Sam saw green candles and bought a 10x long at $84,500 with $1,000 of margin, which is $10,000 of exposure, with no stop-loss. Ana looked at the same chart and saw something else. The close above $85,000 never came, and a lower high is not a breakout. She stayed flat. FOMO is the feeling of missing out, and its cost is entering at the exact point where the move is already crowded.
The crash
On Thursday, October 22, the Nasdaq had its worst day since June, and spot Bitcoin ETFs lost $636 million, their largest single-day outflow since June. BTC fell to about $81,000 and more than $430 million of long positions were liquidated within 24 hours. From $84,500 to $81,000 is a drop of about 4.2%, which at 10x erased roughly 42% of Sam's margin. He told himself it was only a dip. Without a stop, a plan becomes hope.
The weekend ghost
Weekend liquidity is thin. On Saturday, October 24, BTC fell to $79,146, its first move under $80,000 since October 15. More than $200 million was liquidated in a single hour, $191.33 million of it longs, and over $810 million across 24 hours. Sam sold at $79,200, a 6.3% drop from his entry, which at 10x cost 62.7% of his margin, or $627. Within hours BTC reclaimed $80,000, and it trades at $80,940 today, 2.2% above his exit. Panic selling had hit the low. The data shows why: long liquidations came in three waves that kept shrinking, $1.05 billion on October 8, $918 million on October 14 and 15, and $687 million on October 24. By Saturday, the weak longs had already been flushed.
What a stop-loss would have changed
At 10x leverage, a 10% adverse move wipes out the whole margin, since margin is erased by one divided by the leverage. A stop only 2% below entry, at $82,810, would have capped Sam's loss at $200, 20% of his margin, instead of $627. Even holding without selling would have cost him 42% at today's price. The better approach is sizing by the stop. Risk 1% of a $5,000 account, or $50, with a 2% stop, and the position is $2,500 of exposure, a quarter of what Sam used, and the loss on that exact trade would have been $50.
How patience paid Ana
Ana had a rule written before any trade: no long unless BTC closes above $81,500, the top of the $80,000 to $81,500 cost-basis band, with a stop under $80,900. She traded nothing that week. Waiting was not idle. She watched ETF flows, funding at about 0.009% per eight hours, well below the 0.03% overheating level, and the fact that about 70% of accounts were long. That crowd was the risk. Patience cost her zero and kept her margin intact for the setup she had defined.
The technical map from $80,998
Resistance sits at $81,500 (+0.7%), $82,024 (+1.3%), $82,539 (+2.0%) and $84,000 (+3.8%). Support sits at $80,000 (-1.2%), $79,146 (-2.2%), $78,000 (-3.6%, which is also the options max-pain level for the October 30 expiry) and $77,600 (-4.1%). Price is inside the cost-basis band, so it is neutral. Momentum is soft, with RSI near 44 and a negative MACD histogram at the weekend reading. A close above $81,500 would be Ana's trigger. A close below $79,146 would reopen the weekend ghost.
Tonight's real-world test
The Fed announces its decision at 2:00 p.m. ET today, 02:00 Beijing on October 29. A hold is priced near 91% and a December hike near 80%, and Chair Warsh gives no forward guidance, so the press conference can move prices fast. Microsoft and Alphabet report after the close, and Thursday brings GDP and PCE. A trader holding a leveraged long with no stop into that window is Sam again.
The moral in four rules
Size the position by the stop, never by the leverage on offer. Wait for a close, not a wick. Never chase a green candle that already reached resistance. Plan the exit before the entry, so fear cannot choose it for you. The market will keep producing fake breakouts and sudden crashes, but a trader with a plan sees them as data, not as ghosts.
Halloween monsters disappear at dawn. An unplanned trade does not.
#GateSquareHalloween