MatthewDixon

vip
Active for: 1.4y
Peak Tier 0
No content yet
Something interesting is developing across markets.
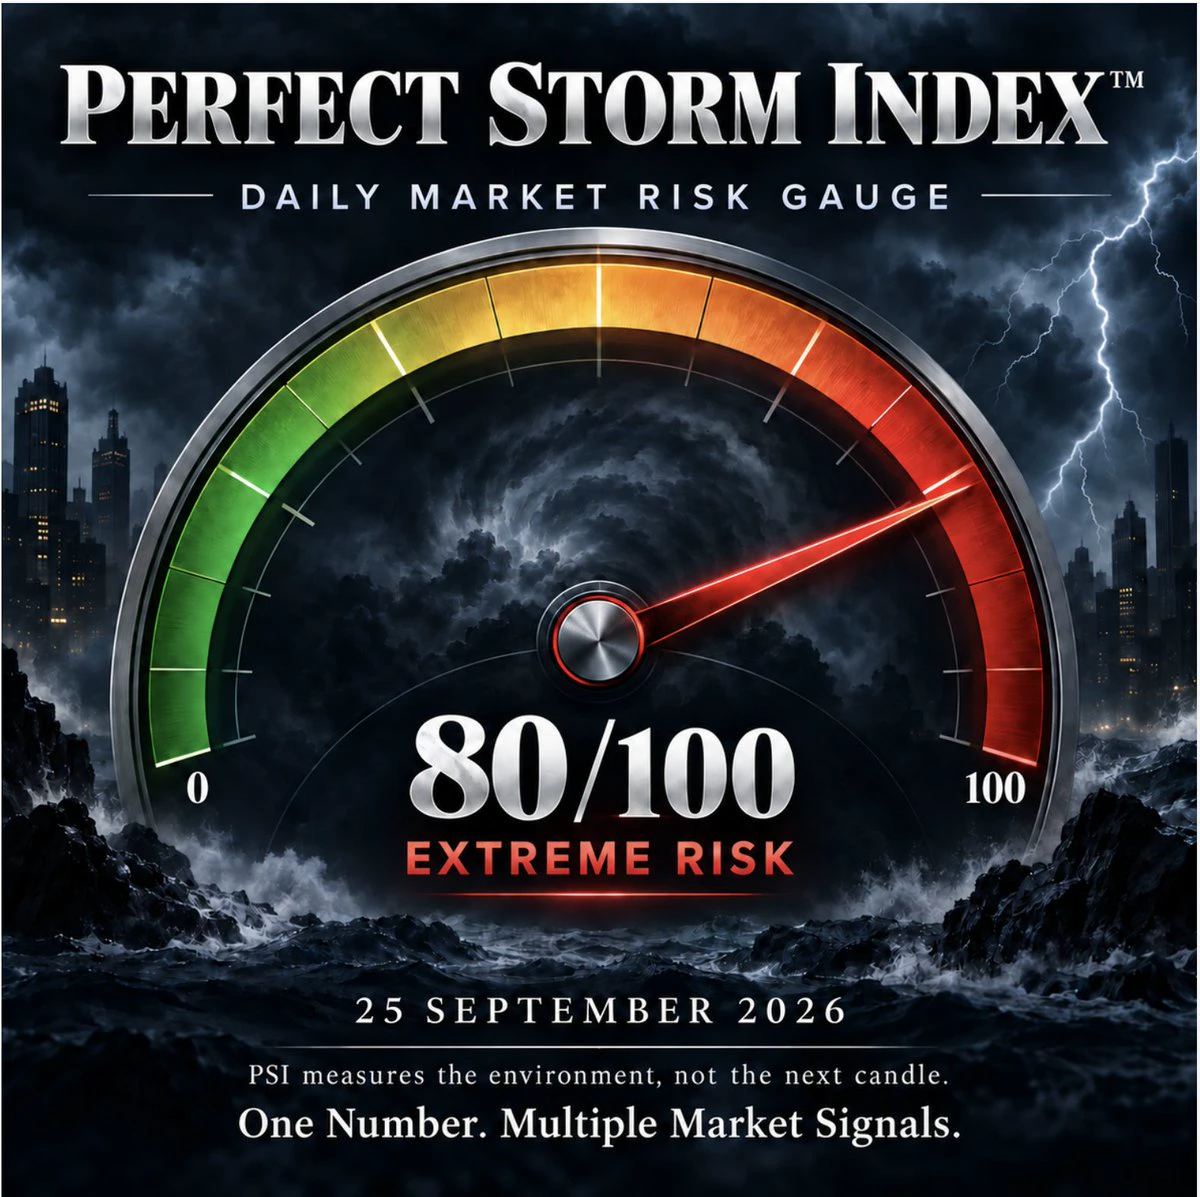
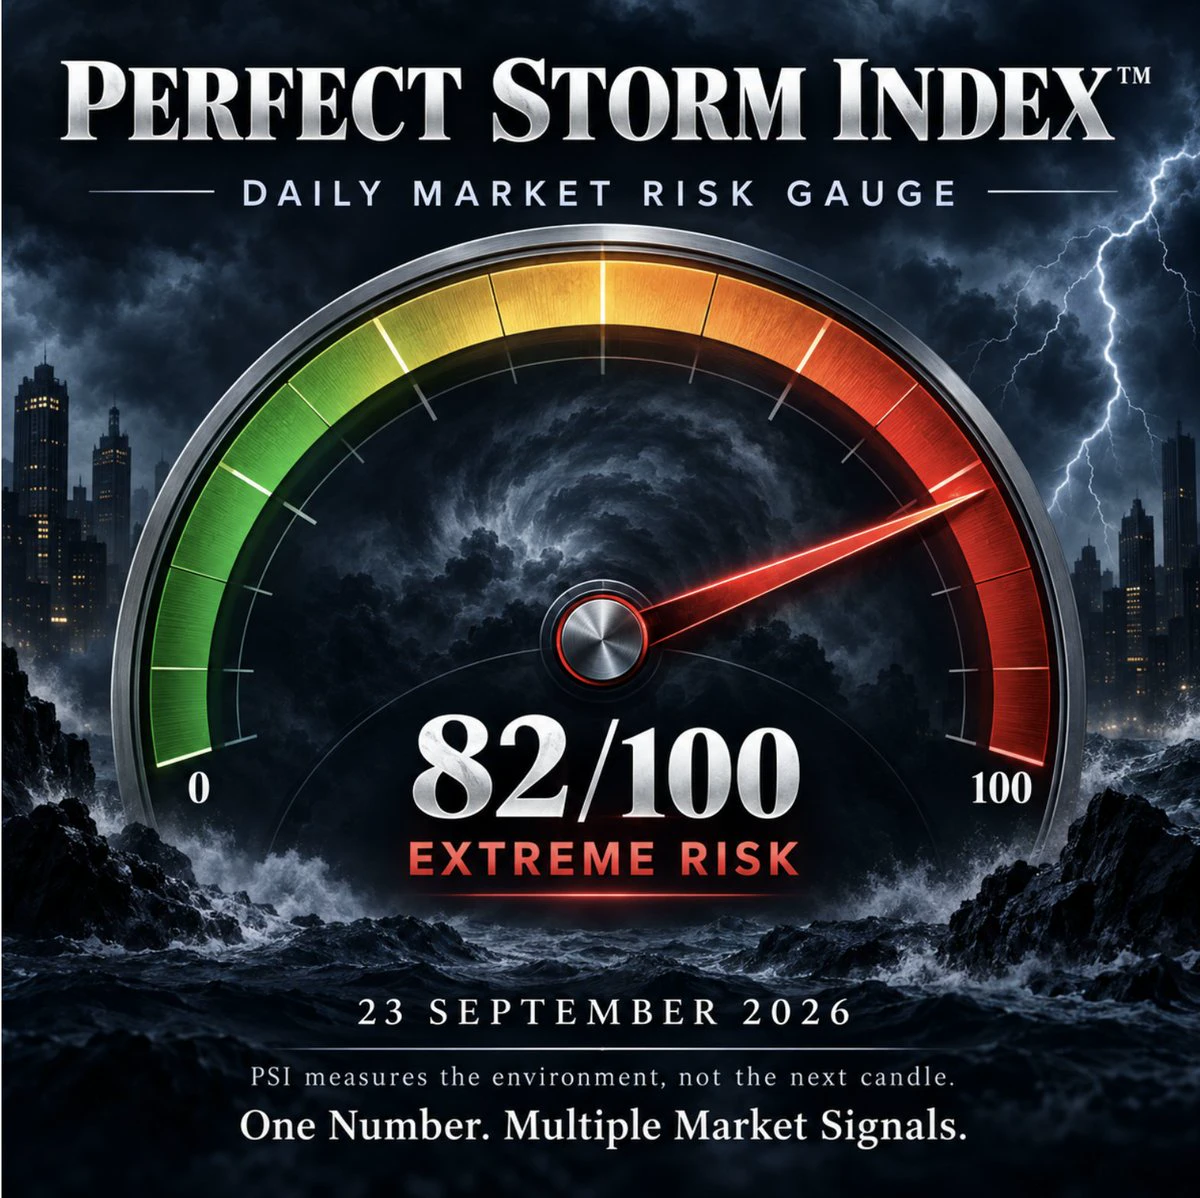
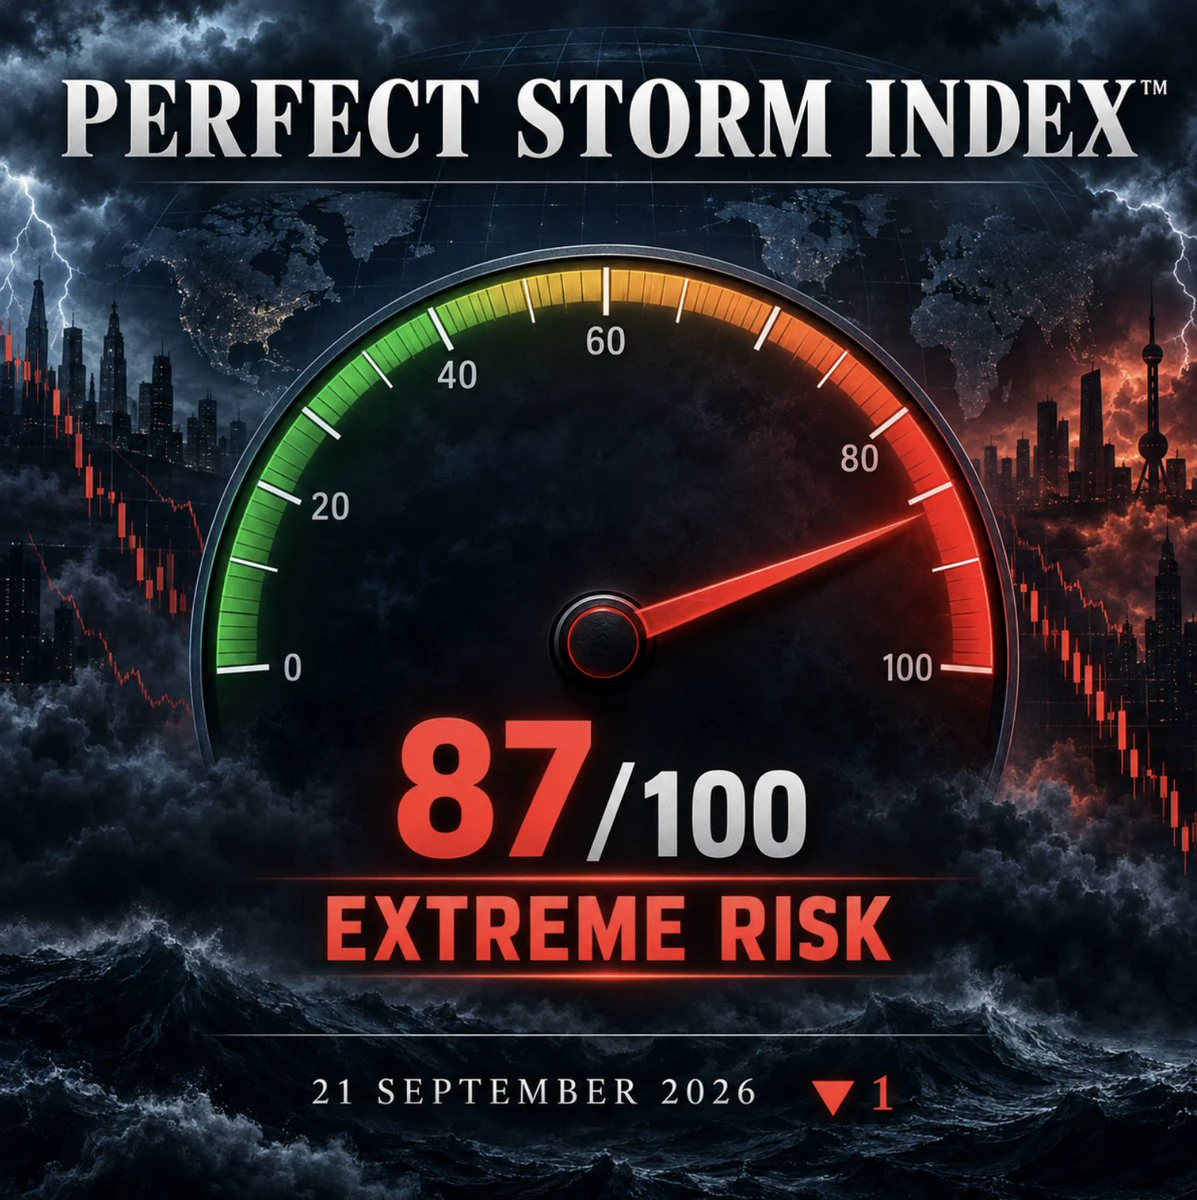
My Perfect Storm Index™ remains elevated at 58/100.
#BTC remains in what I believe is a corrective structure.
#SPX is making new highs while weekly RSI is showing clear bearish divergence.
Meanwhile, inflation/Fed conditions are improving, but yields, oil and geopolitical risks remain elevated.
None of this tells us precisely when markets turn.
But that isn't the point.
After 40+ years in markets, I've learned that the greatest risks often emerge when several seemingly unrelated signals begin pointing in the same direction.
Now add the long-t
BTC0.63%
SPX0.25%
post-image
  • Reward
  • Comment
  • Repost
  • Share
Clear bearish RSI divergence is now visible at the recent high on #SPX.
The Elliott Wave structure also raises the possibility that this long-running impulsive advance is approaching completion.
But divergence is a warning, not a sell signal.
I would still want to see a clear reversal in price structure and trend before drawing any tradable conclusions.
Evidence first. Prediction second.
#SP500 #Markets #ElliottWave
SPX0.25%
post-image
  • Reward
  • Comment
  • Repost
  • Share
The B and Y labels are intended to show directional movement, not precise $BTC price targets.
My base case is that the B wave may have a little further to run before a final 5-wave decline completes the larger Y wave.
The precise levels are less important than the structure.
If that correction completes alongside an improvement in the geopolitical and macroeconomic risk environment, reflected by a falling Perfect Storm Index™, the conditions could then be in place for a powerful recovery towards new #BTC all-time highs.
Probabilities, not certainties. Structure first, targets second.
#Bitcoin
BTC0.63%
post-image
  • Reward
  • Comment
  • Repost
  • Share
US crypto regulation remains unresolved. The anticipated progress on the CLARITY Act has stalled, meaning one of the potentially largest structural catalysts for US crypto hasn't materialised on the hoped-for timetable. At the same time, the SEC is reportedly looking at ways of advancing crypto regulation administratively rather than waiting indefinitely for Congress. The latter could eventually be significant for token issuance, although I'd want firmer official details before treating it as a market catalyst.
  • Reward
  • Comment
  • Repost
  • Share
The B and Y labels are intended to show directional movement, not precise $BTC price targets.
My base case is that the B wave may have a little further to run before a final 5-wave decline completes the larger Y wave.
The precise levels are less important than the structure.
If that correction completes alongside an improvement in the geopolitical and macroeconomic risk environment, reflected by a falling Perfect Storm Index™, the conditions could then be in place for a powerful recovery towards new #BTC all-time highs.
Probabilities, not certainties. Structure first, targets second.
#Bitcoin
BTC0.63%
PSI5.50%
post-image
  • Reward
  • Comment
  • Repost
  • Share
Perfect Storm Index™ 13 Aug 2026
Today’s PSI: 58/100 🟠
Risk Environment: Elevated
Bias: Risk-Off / Cautious
Risk has eased fractionally from yesterday’s 59, but the backdrop remains uncomfortable.
✅ VIX and credit stress remain subdued
✅ Inflation/Fed pressure has improved slightly
⚠️ US yields remain elevated
⚠️ Oil and geopolitical risk remain firm
⚠️ #Bitcoin trend and Elliott Wave structure still favour caution
The key point: we are not in a full “Perfect Storm”, but conditions remain vulnerable to deterioration.
A simultaneous rise in DXY, yields, oil and volatility would push PSI quick
PSI5.50%
BTC0.63%
post-image
  • Reward
  • Comment
  • Repost
  • Share
Looking at the last two #BTC halving cycles, something interesting stands out.
#Bitcoin recorded a major cycle low:
• 513 days before the 2020 halving
• 516 days before the 2024 halving
Just a 3-day variation.
The next Bitcoin halving is expected around April 2028.
If, and it's a big IF, that timing relationship persists, a comparable cycle low would fall around November 2026.
Interestingly, that aligns closely with my existing Elliott Wave work pointing towards a potential Q4 2026 low.
Two observations don't make a statistical law, but when independent methods begin pointing towards the same
BTC0.63%
post-image
  • Reward
  • Comment
  • Repost
  • Share
Could #Bitcoin's entire history represent one enormous leading diagonal? Yes IMO.
If so, the 2025 ATH may be far more significant than simply the top of another four-year cycle.
It's not a prediction, it is a low-probability but potentially very high-consequence scenario that deserves to remain on the risk map.
A wave 2 following a leading diagonal is normally expected to be deep. A retracement toward 61.8% of the entire advance would put BTC somewhere around the $45–50k region depending on precisely where the diagonal is anchored.
BTC0.63%
post-image
  • Reward
  • Comment
  • Repost
  • Share
#Bitcoin is still “treading water” within what I see as a corrective B wave. Price may drift a little higher from here, but the broader trend remains down.
Ideally, another push higher would lift RSI towards overbought territory while momentum fails to confirm the price advance, creating bearish divergence.
That would add technical weight to the case for a final C wave lower, completing the corrective cycle from the ATH.
No certainty. No prediction dressed up as fact. Just watching the probabilities and the risk environment. #BTC
BTC0.63%
post-image
  • Reward
  • Comment
  • Repost
  • Share
The Perfect Storm Index™ 12 August 2026
Today’s PSI: 61/100 🟠
Market Pressure: ELEVATED
Daily Change: +2
Risk conditions have deteriorated modestly.
💵 DXY remains firm
📈 US yields remain elevated
🛢️ Oil/geopolitical risk is increasing
💧 Liquidity is showing early improvement
₿ Crypto sentiment remains cautious
The important point is the confluence. Dollar strength, elevated yields and higher oil are maintaining pressure on risk assets, even as liquidity begins to offer some offset. Today's markets continue to reflect those competing forces.
PSI doesn’t predict the future. It quantifies th
BTC0.63%
post-image
  • Reward
  • Comment
  • Repost
  • Share
Maybe Goodbye 🥲
This particular Tweet has been maliciously reported for Copyright violation despite it being 100% my own work.
X has contacted me to say that as a result my account may be removed.
If it is, then I would just like to say thank you to the many thousands of followers and I wish you successful trading ahead - I cant be bothered to fight it. They have not even provided any evidence for me to dispute!
  • Reward
  • Comment
  • Repost
  • Share
Ai says - There is no obvious copyright infringement in the analytical content itself. The key issue is likely the images/charts, not your written DXY/BTC analysis.
Your charts visibly carry the TradingView attribution. TradingView's current terms say users may create chart snapshots and use them outside TradingView provided the required attribution remains visible. Your screenshots appear to retain the TradingView logo, which points in your favour.
However, there is an important distinction: if you created these charts yourself in your own TradingView account, including the Elliott Wave label
BTC0.63%
  • Reward
  • Comment
  • Repost
  • Share
#Bitcoin advanced from the FTX low around $15,500 to the ATH in what appears to be a remarkably clean 5-wave Elliott Wave structure, with some compelling Fibonacci relationships.
Since the ATH, price appears to have shifted into corrective mode.
My preferred interpretation is that the correction is not yet complete and that at least one further leg lower remains probable before the larger bullish trend can resume.
That is a probability, not a prediction. If the structure changes, so does the view.
Short-term caution. Long-term opportunity.
#BTC #Crypto #ElliottWave
BTC0.63%
post-image
  • Reward
  • Comment
  • Repost
  • Share
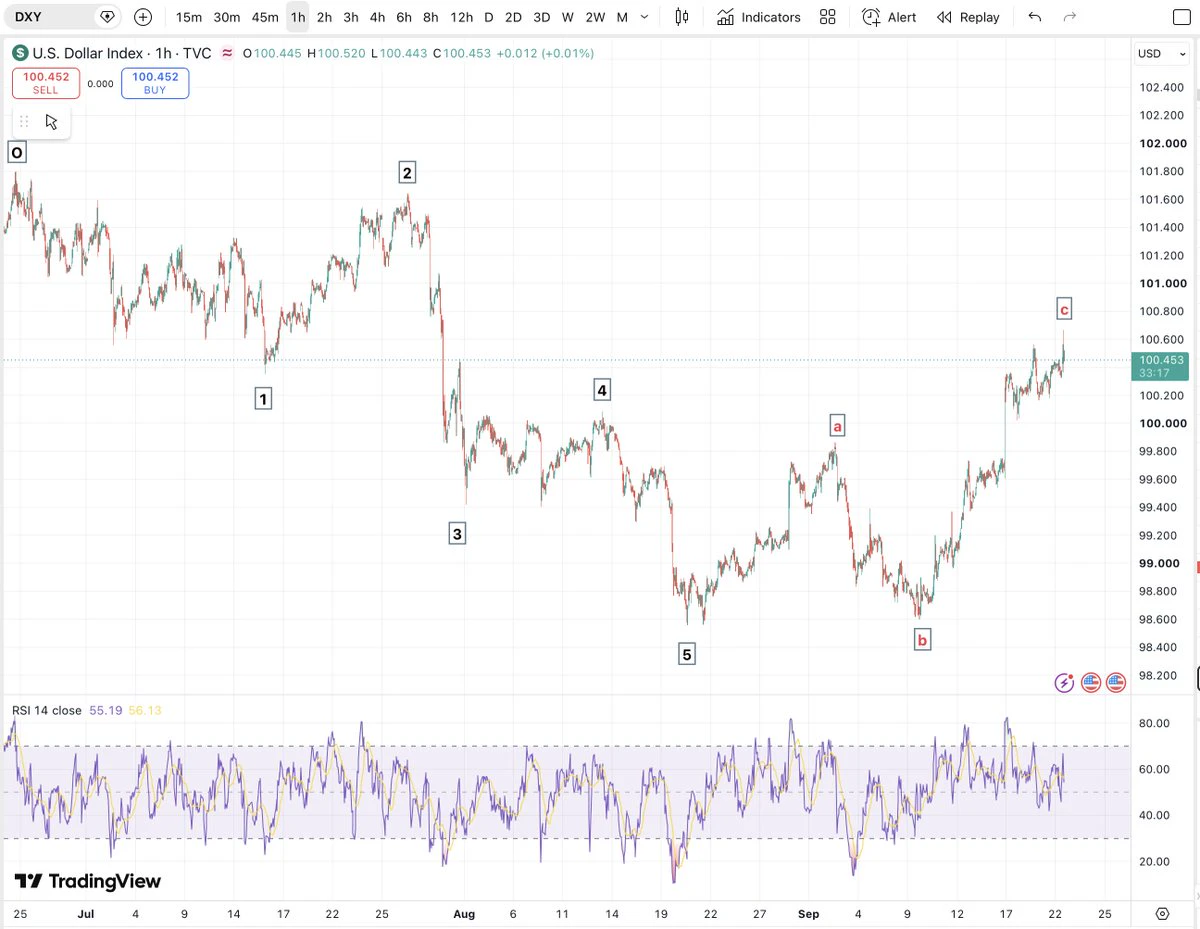
Tentative evidence that #DXY may have bottomed near the lower boundary of this long-term rising channel. A structure that has existed for almost the entire history of #Bitcoin.
If the channel continues to hold, renewed dollar strength could tighten financial conditions and increase pressure on #BTC and #Crypto.
This also helps explain why the Perfect Storm Index™ remains elevated.
Not a prediction — a risk to be respected.
#DXY #Bitcoin #Macro #PSI
BTC0.63%
PSI5.50%
post-image
  • Reward
  • Comment
  • Repost
  • Share
The Perfect Storm Index™ 11 August 2026
Today’s PSI: 59/100 🟠
Market Pressure: ELEVATED
Daily Change: +2
Risk conditions remain elevated, with liquidity still tight and the US dollar and yields remaining firm.
Volatility remains subdued, but risk appetite is constrained and the broader Elliott Wave/momentum picture remains cautious.
The important point: 59 is not a prediction. It is a measure of the current risk environment.
Stay defensive. Protect capital. Cash is a position.
#PerfectStormIndex #PSI #Bitcoin #Crypto #Markets #Macro
PSI5.50%
BTC0.63%
post-image
  • Reward
  • Comment
  • Repost
  • Share
Any hope left for #JASMY?
From its 2021 extreme, JASMY has fallen around 99%. A brutal reminder that in crypto, a 90% decline can still be followed by another 90% decline.
But this is where it gets interesting.
Price is now returning towards the base of the powerful 2024 advance. If that move represented the beginning of a larger bullish cycle, this is roughly where we need to start seeing evidence of accumulation and structural reversal.
If not, the bear market remains firmly in control.
No predictions. No hopium. Watch the structure and let price provide the evidence.
JASMY0.88%
post-image
  • Reward
  • Comment
  • Repost
  • Share
The improving Perfect Storm Index™ over recent days is being validated by the gradual recovery in risk assets, including #BTC and #Crypto.
This aligns with my preferred Elliott Wave count, a corrective B-wave recovery remains underway.
The next phase could become particularly interesting.
If #BTC continues higher while momentum begins to weaken, bearish RSI divergence could develop, providing additional evidence that the B wave is approaching completion and the larger C wave lower is getting closer.
PSI measures the risk environment. Elliott Wave provides the roadmap. Price confirms the thesis
BTC0.63%
  • Reward
  • Comment
  • Repost
  • Share
Perfect Storm Index™ | 10 August 2026
🟠 Today’s Reading: 57/100
Yesterday: 58 | Change: -1
Risk conditions remain elevated, but continue to ease gradually.
Lower volatility, stable crypto markets and easing funding pressures are mildly constructive, while a strong dollar, elevated yields and tight financial conditions continue to constrain risk appetite.
The PSI remains cautious, not complacent.
Stay selective. Manage risk. Cash is a position.
#PerfectStormIndex #Markets #Macro #Bitcoin #Crypto
PSI5.50%
BTC0.63%
post-image
  • Reward
  • Comment
  • Repost
  • Share
Still favouring a deeper Wave 2 correction in #OIL towards the $71 area.
That could coincide with a further near-term advance in #BTC and #Crypto.
But the bigger setup may come afterwards.
Oil will likely show hidden bullish divergence once Wave 2 completes, then the preferred count points to a potentially powerful Wave 3 higher.
If that develops into Q4, sharply higher oil could become another macro headwind for inflation, rates and ultimately risk assets.
Oil down → crypto relief → oil reversal → Q4 risk?
A scenario, not a certainty but one I'm watching closely.
BTC0.63%
post-image
  • Reward
  • Comment
  • 1
  • Share
  • Pinned