TraderTardigrade

vip
Active for: 3.3y
Peak Tier 0
No content yet
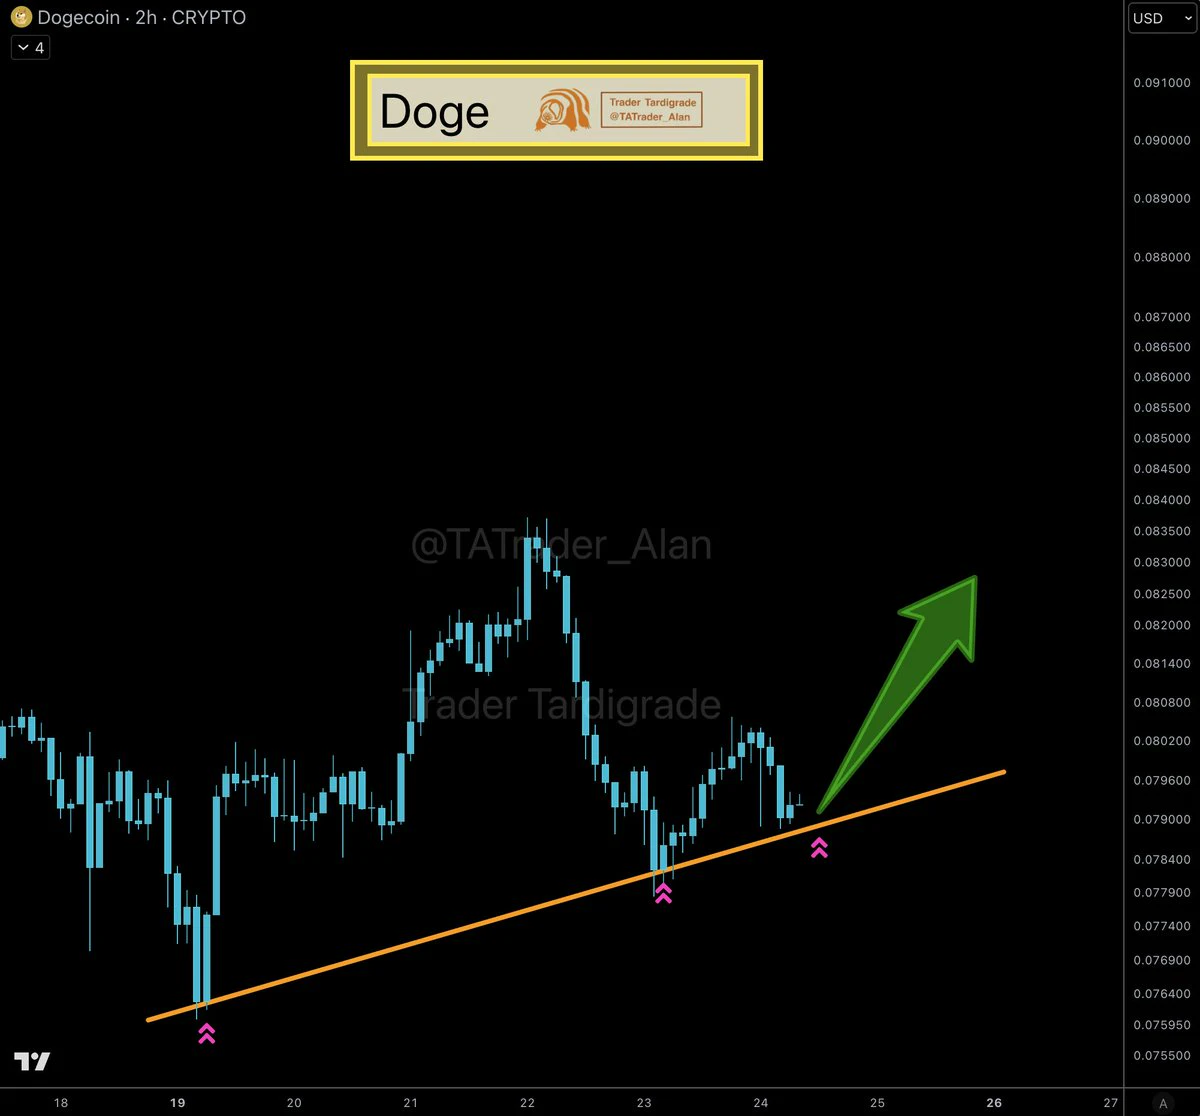
$DOGE /4-hour — Next Easy Target $0.093 🐕❇️
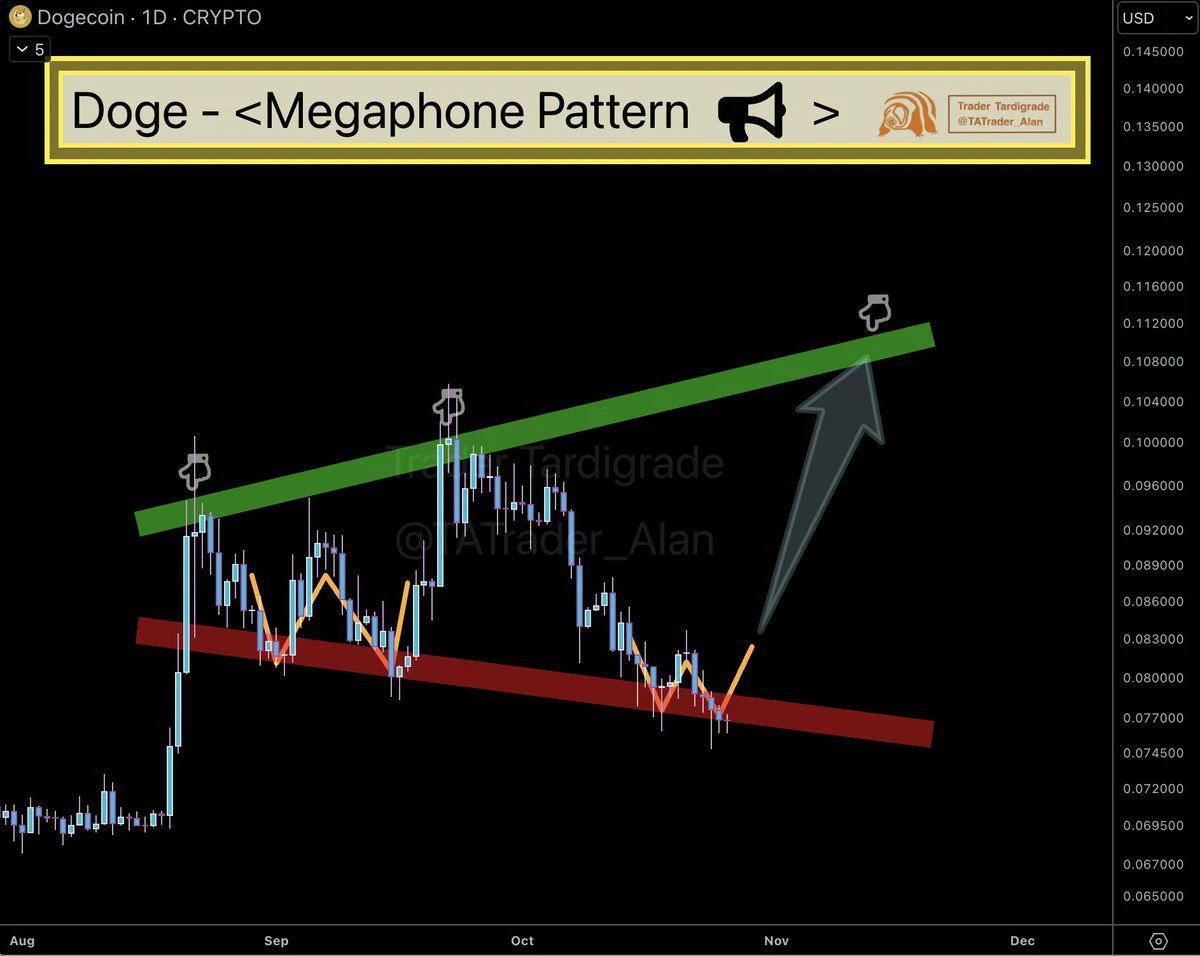
#Dogecoin is moving inside an ascending channel and has now bounced perfectly off the lower trendline support for the second time.
📊 Ascending channel structure
🟢 Double bounce at support confirmed
🎯 Next target: $0.093 (upper resistance)
✍️ When price respects the lower boundary of an ascending channel twice and rebounds with strength, it typically projects toward the upper resistance. The pattern is clean and the momentum is building.
Target locked 🚀
post-image
DOGE+0.69%
$BTC /monthly — On Sale Ends Soon ❇️
#Bitcoin is sitting just below the 20 EMA on the monthly chart.
This is one of the most bullish setups in crypto.
📊 Price consolidating under 20 EMA
🟢 Every previous dip below = massive buying opportunity
🚀 Once reclaimed, the next leg begins
✍️ History shows that when BTC dips below the 20 EMA on the monthly timeframe and consolidates there, it marks the end of corrections and the start of the next rally phase.
The sale is about to end 🔥
post-image
BTC+1.36%
$MEME .C/daily — Meme Season Setup 🚀
Crypto Memecoins Market Cap has broken out of the long-term descending trendline and is now forming a consolidation range above it.
📊 Descending trendline breakout complete
🟢 Consolidation above breakout = momentum buildup
🎯 Another spike in memes incoming
✍️ When market cap breaks a major resistance and consolidates above it, the setup becomes extremely bullish. This consolidation is building energy for the next leg up.
Levels to watch:
🟢 — Breakout above consolidation top
🟣 — Retest of consolidation top
Meme season could ignite late 2026 🔥
post-image
MEME-1.53%
MMT-0.13%
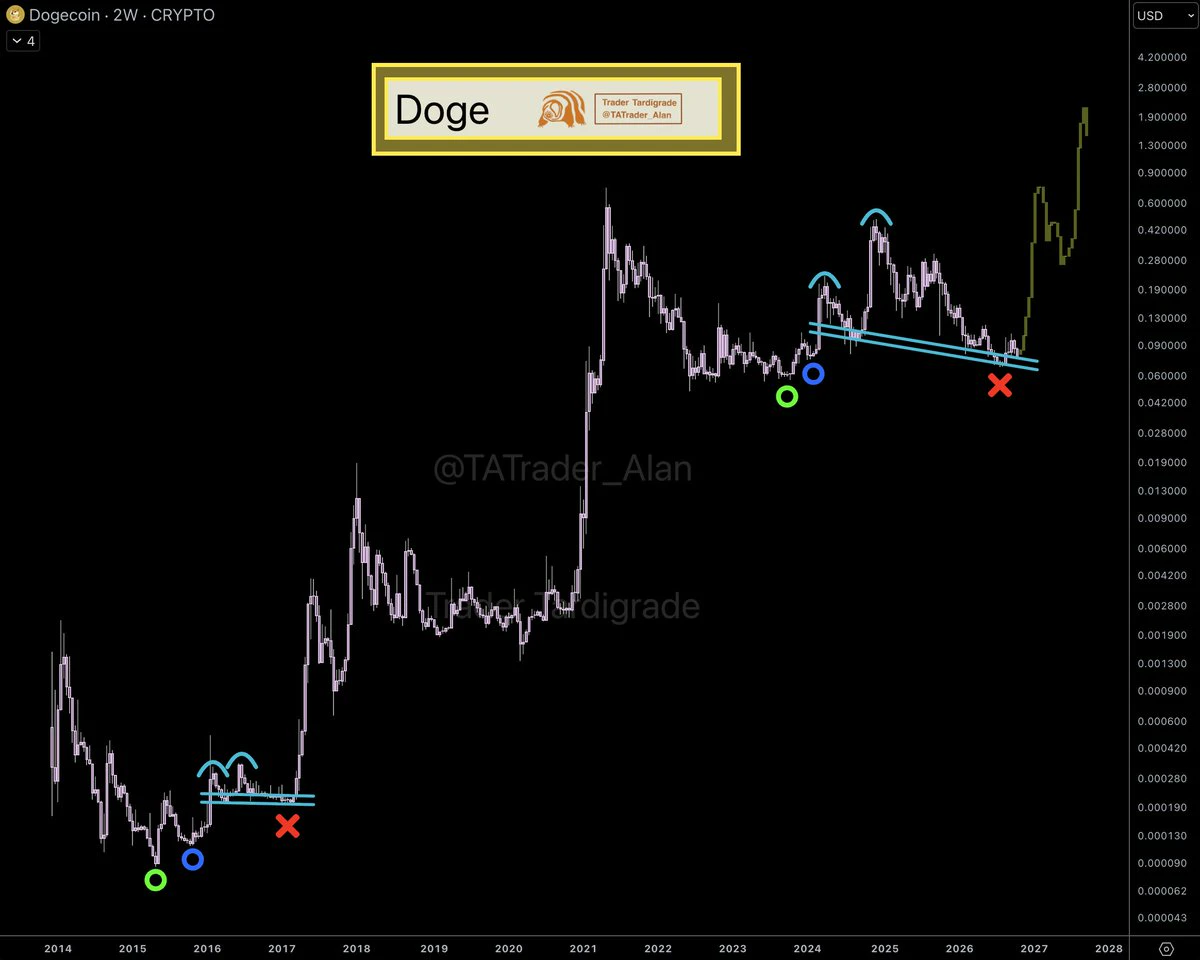
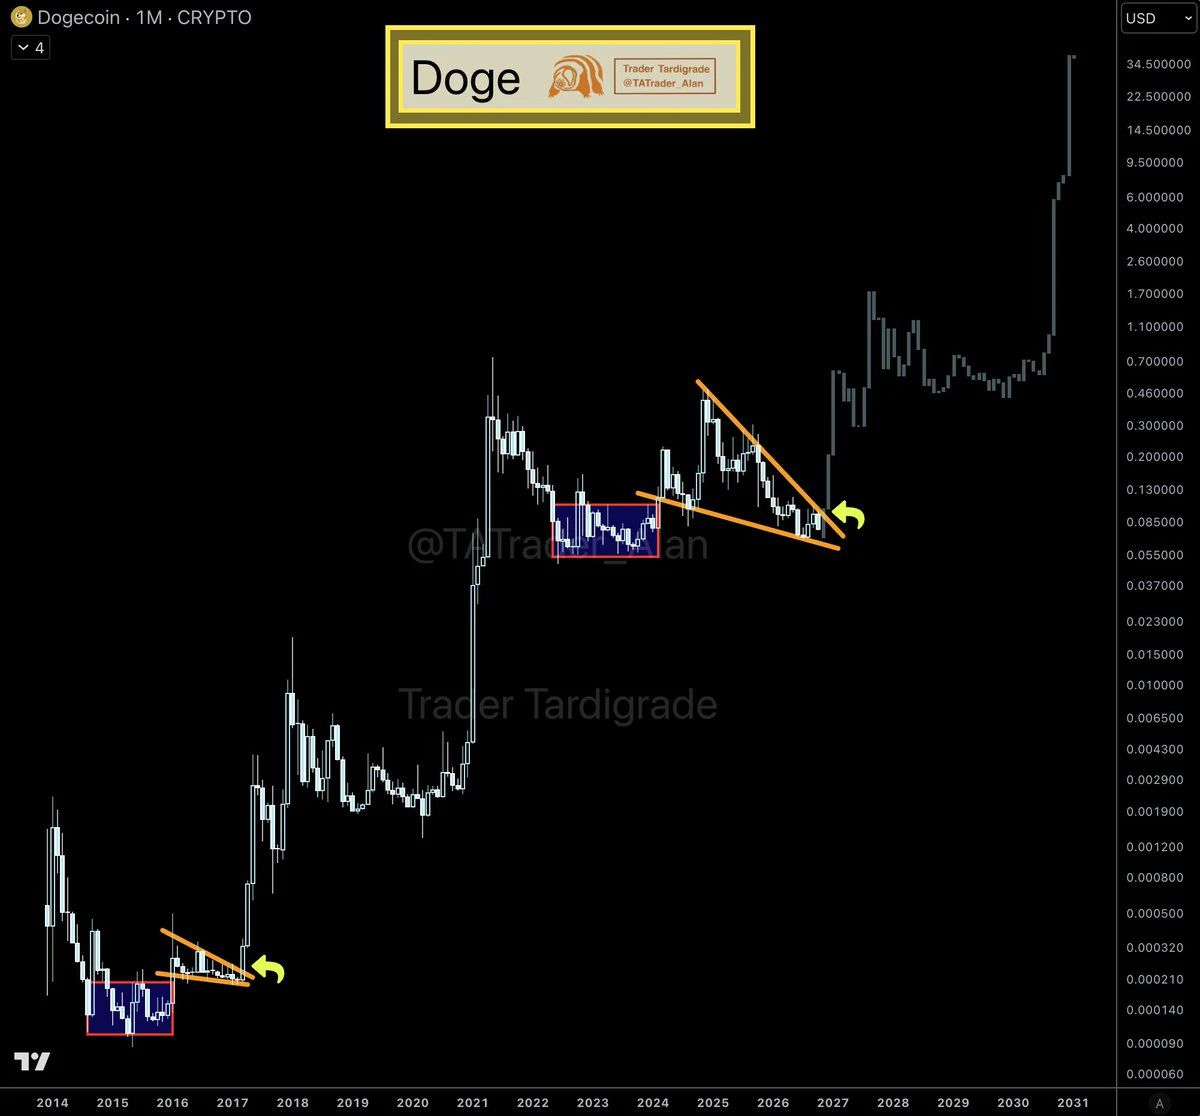
$DOGE /monthly — Fractal Repeat 🐕❇️
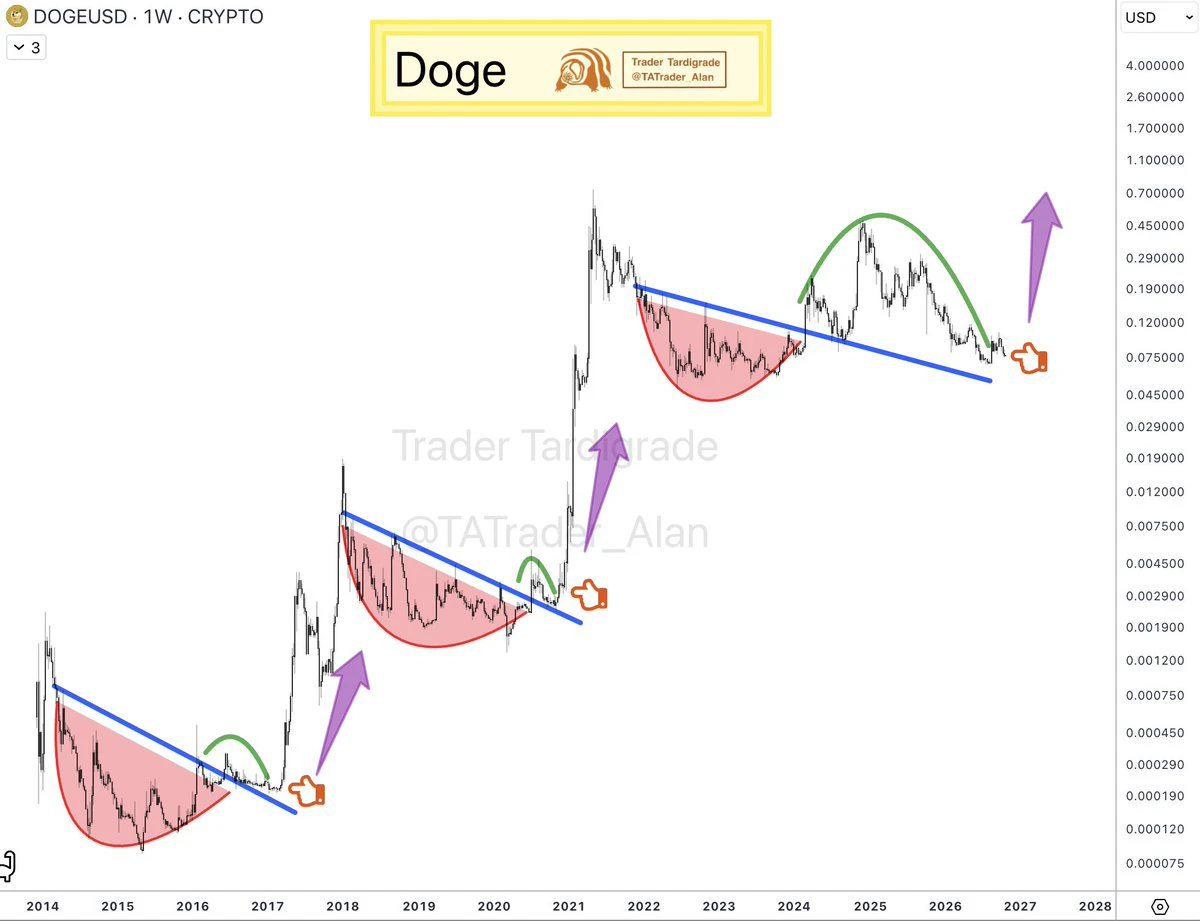
#Dogecoin is printing the exact same pattern that triggered the two previous parabolic cycles.
📊 Rounded bottom forming
🔴 Descending trendline resistance
🟢 Breakout above trendline = cycle ignition
✍️ The structure is identical. Both previous cycles formed a rounded bottom, broke above the descending trendline, and launched into explosive rallies. DOGE is now at the same critical point.
History is about to repeat 🚀
post-image
DOGE+0.69%
$DOGE /weekly — RSI Bottom 🐕❇️
#Dogecoin has reached the bottom.
The RSI has broken the long-term descending trendline — the same level that marked the two previous cycle bottoms.
📊 RSI at multi-year support trendline
🟢 Breakout = Momentum built
🚀 Previous breakout triggered massive rallies
The bottom is in 🔥
post-image
DOGE+0.69%
  • 1
  • 1
$ETH /monthly ❇️
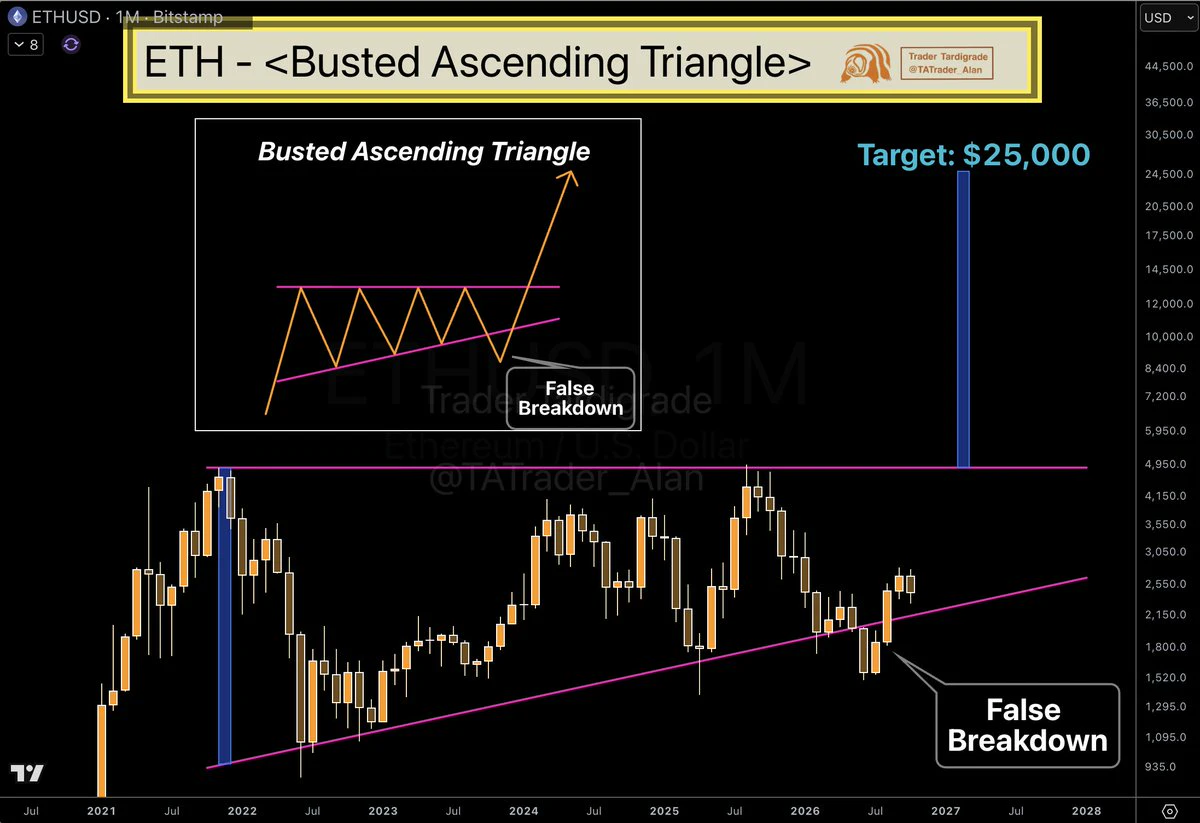
#Ethereum has been forming a Busted Ascending Triangle for nearly 5 years — one of the most powerful bullish reversal structures in technical analysis.
📊 False breakdown complete
🟢 Price reversed back into the triangle
🚀 Rapid surge to the upside now developing
✍️ A Busted Ascending Triangle occurs when price breaks below support, traps sellers with a false breakdown, then reverses aggressively back into the pattern.
The failed breakdown becomes fuel for the breakout.
Target: $25,000 🔥
post-image
ETH+1.30%
  • 1
$DOGE /4-hour
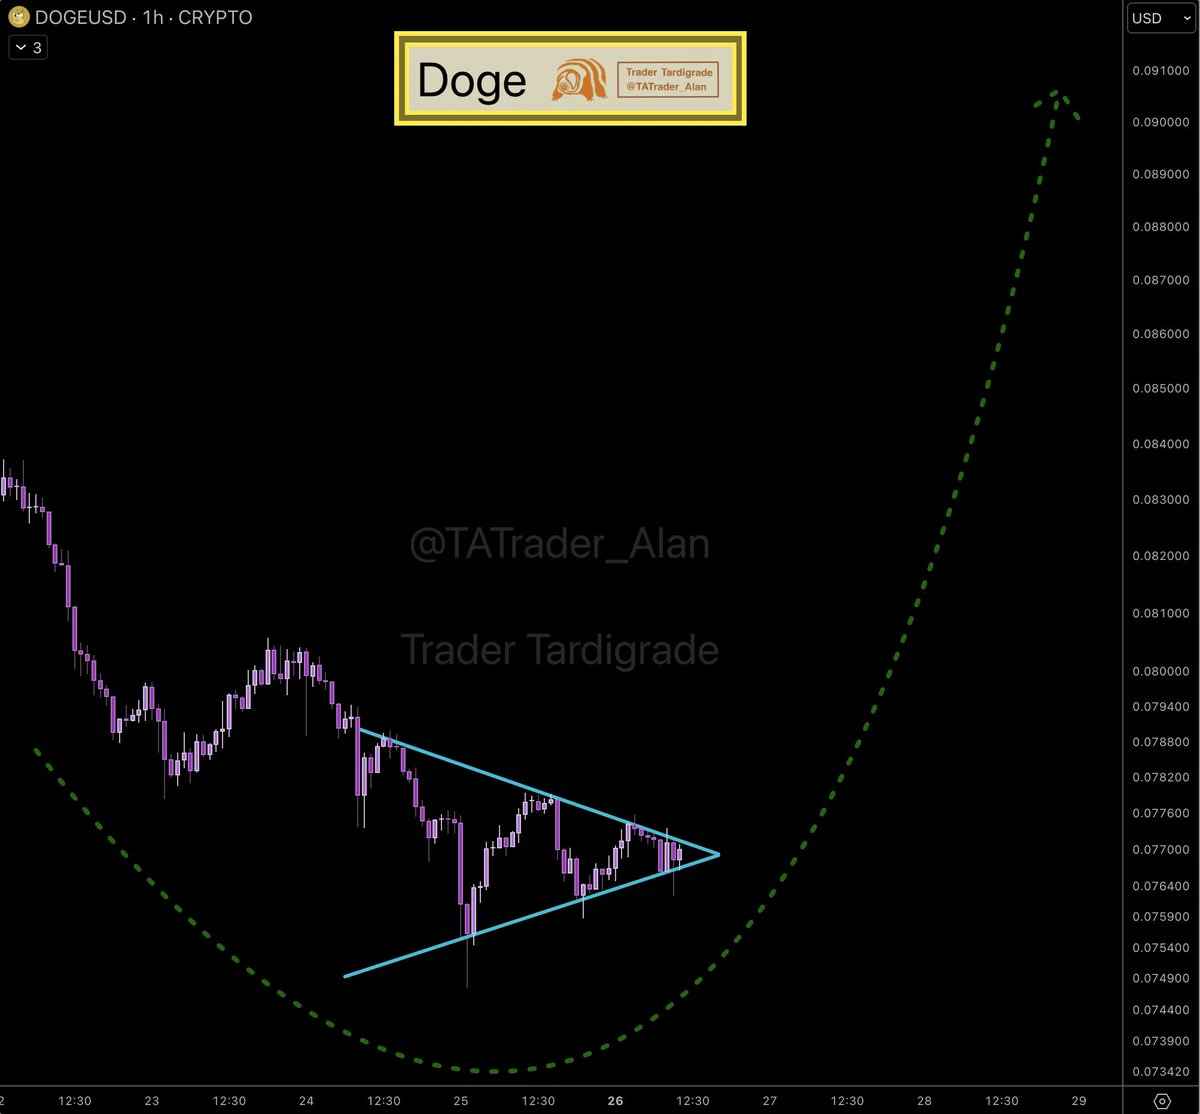
#Dogecoin has formed a Bullish Pennant — one of the most reliable continuation patterns in technical analysis.
📊 Compression complete
📈 Trendlines converging
🚀 Breakout imminent
✍️ Bullish Pennants signal strong momentum continuation. The setup is textbook and the structure is clean.
Breakout incoming 🔥
post-image
DOGE+0.69%
$BTC .D/weekly — Bear Flag at Resistance
❇️ #Bitcoin dominance has formed a textbook Bear Flag — and the flagpole high rejected perfectly at long-term resistance.
📊 Bear Flag structure complete
🔴 Rejection at multi-year resistance trendline
🎯 Breakdown = Altseason trigger
✍️ When BTC dominance breaks down from a Bear Flag at resistance, it signals capital rotation into alts. The setup is clean.
Altseason is one breakdown away 🚀
post-image
BTC+1.36%
$DOGE /2-week
❇️ MACD has just printed a Bullish Cross after an extended period of weakness — the first major signal of trend reversal.
This indicator doesn't cross often on the 2-week timeframe. When it does, it typically marks the beginning of sustained upward momentum.
The bearish phase is over. The Bull Run structure is now forming. 🚀
DOGE+0.69%
  • 1
dogecoin:native — H4 Fibonacci Update
❇️ DOGE has retraced back to the 0.618 Fibonacci level, currently near $0.0813.
This is a technically significant support zone and the market is reacting around it so far. However, one touch does not confirm a durable bottom. Multiple tests of the 0.618 level remain possible as price searches for acceptance.
The key is how DOGE behaves on each retest:
🔸 Holding above $0.0813: support remains valid.
🔸 Reclaiming $0.0865: improves short-term structure.
🔸 A decisive H4 close below $0.0813: increases the risk of a deeper retracement.
Repeated tests can eith
post-image
DOGE+0.69%
$Doge/monthly — Inverted Chart
#Dogecoin just formed a Hanging Man candle at resistance — a textbook bearish reversal pattern.
📊 Hanging Man at resistance
🔴 Bearish reversal signal
🎯 Target: $0.7
✍️ This is the third time the Inverted Chart has flashed this exact setup — and both previous times triggered drops.
A huge drop is coming.
The pattern is scheduled 🩸
post-image
DOGE+0.69%
$DOGE — Daily Ichimoku Update
❇️ Breaking through a significant resistance zone is rarely a straight-line process.
The first attempt to reclaim above the Kumo failed, but that rejection should not automatically be interpreted as a bearish reversal. It is the first meaningful sign that directional momentum may be shifting after an extended period of weakness.
✍️ DOGE is now holding just above the Kijun-sen, which is acting as dynamic support. As long as price remains above this level, the breakout structure remains active rather than invalidated.
The next key development is a potential second a
post-image
DOGE+0.69%
$Doge/monthly
#Dogecoin just broke below the Bullish Pennant — but if price reclaims back inside, the false breakdown effect will be insane.
📊 Bullish Pennant formed perfectly
❌ False breakdown trapping sellers
🚀 Reclaim = explosive move
✍️ False breakdowns are the strongest bullish signals. Every seller who panicked gets trapped, and the reversal hits harder than a clean breakout.
If $DOGE reclaims the pennant, this explodes 🔥
post-image
DOGE+0.69%
  • 1
$BTC /weekly
#Bitcoin has completed an Ascending Triangle at the bottom — and the breakout just happened.
📊 259-day downtrend → Ascending Triangle Bottom → Breakout ✅
🚀 1,001-day Bull Run starts right now
✍️ The pattern is textbook. When $BTC forms this structure at the bottom, a massive Bull Run follows.
Last: Ascending Triangle Bottom → 1,001d Bull Run ✅
Current: Ascending Triangle Bottom → 1,001d Bull Run ?
History is repeating 🔥
post-image
BTC+1.36%
  • 1
$Doge/monthly
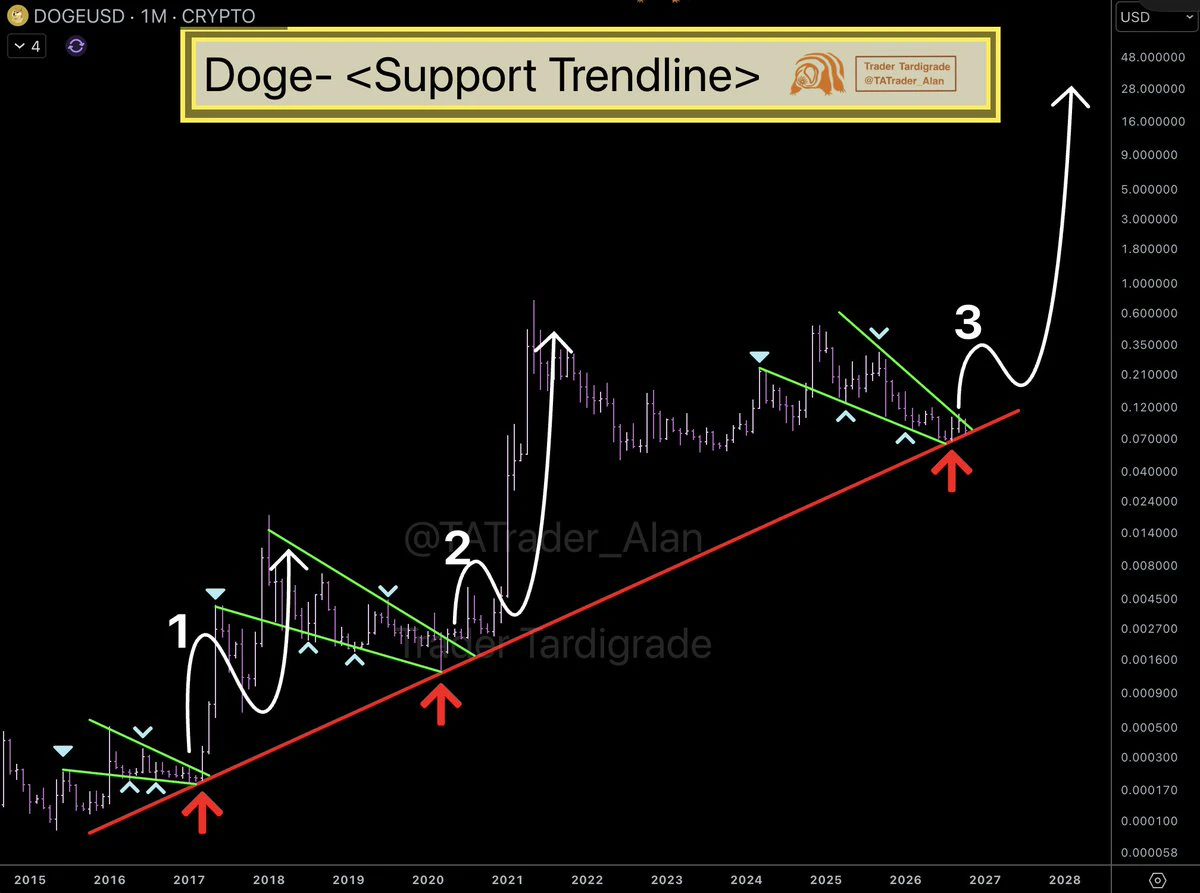
#Dogecoin is hitting the third pre-massive pump structure — Falling Wedge onto support trendline.
🟢 Falling Wedge compressing
🔴 Support trendline holding
2017: Touch → Massive pump ✅
2020: Touch → Massive pump ✅
2026: Touch → ?
✍️ Same setup. Same trendline. Same outcome.
This pattern has never failed 🚀
post-image
DOGE+0.69%
$Doge/4-hour
#Dogecoin has formed a Bullish Pennant — and the breakout is ready.
📊 Compression complete
📈 Trendlines converging
🎯 Breakout target: $0.128
✍️ Bullish Pennants are continuation patterns. The setup is clean and the measured move is clear.
Breakout incoming 🚀
post-image
DOGE+0.69%
  • 1