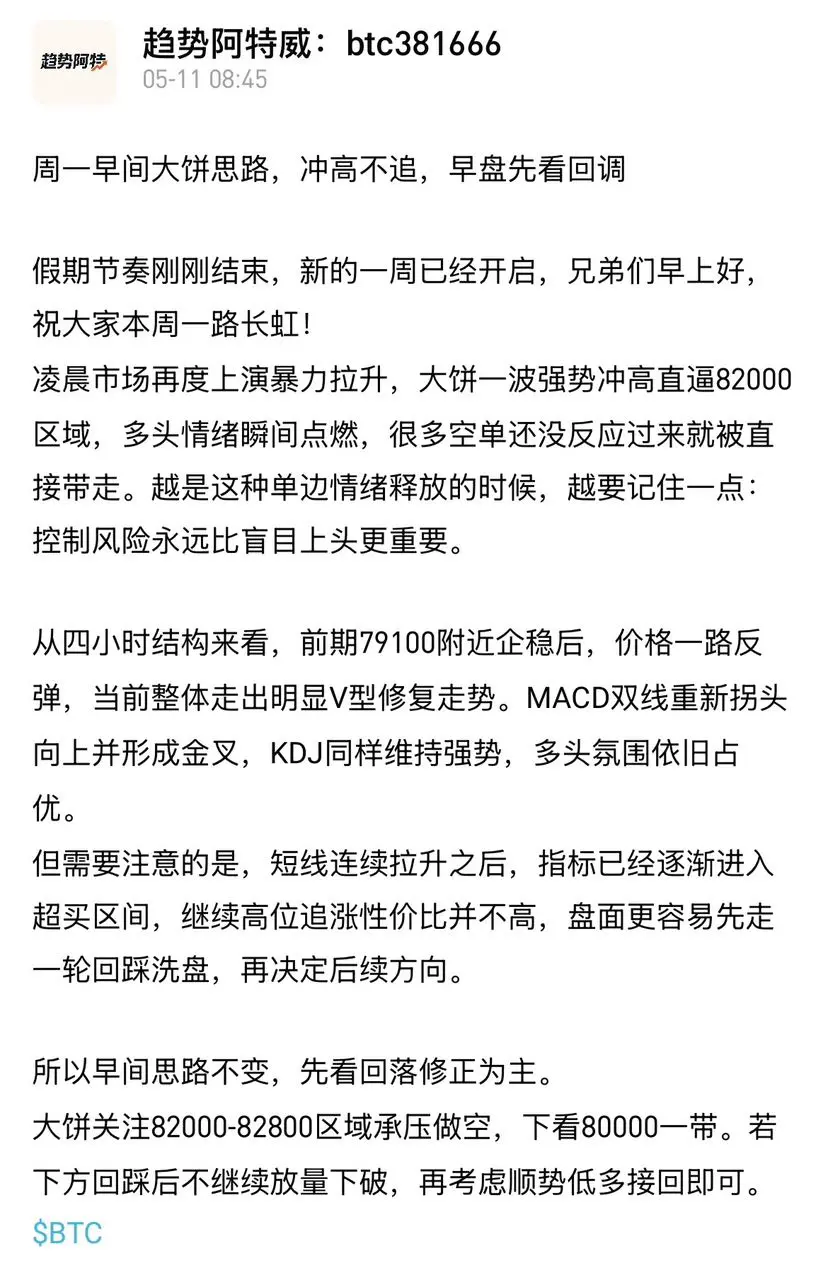

#Gate广场五月交易分享 Has Bitcoin already peaked at 82,800? 80% probability, keep an eye on 84,500
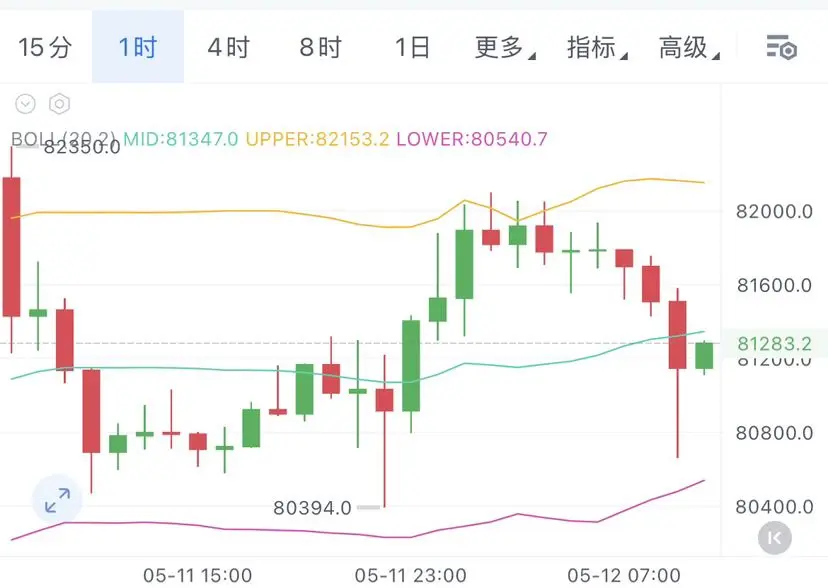
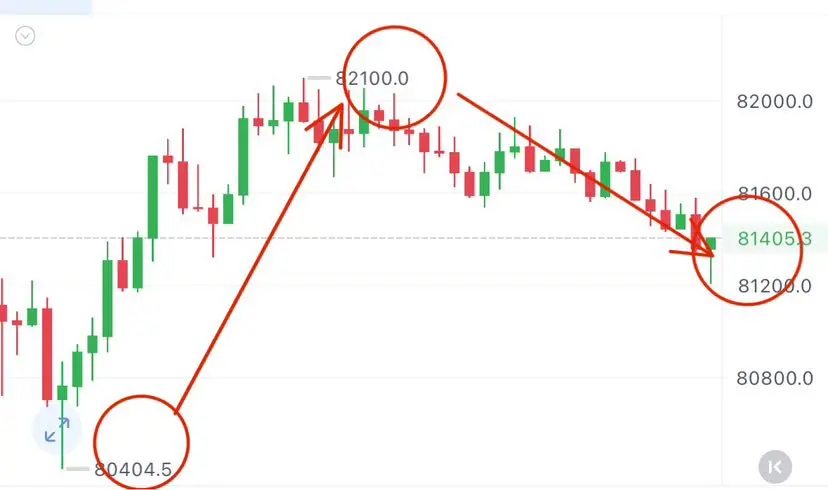
On May 7th, Bitcoin surged to 82,860. On May 10th, it surged to 82,350.
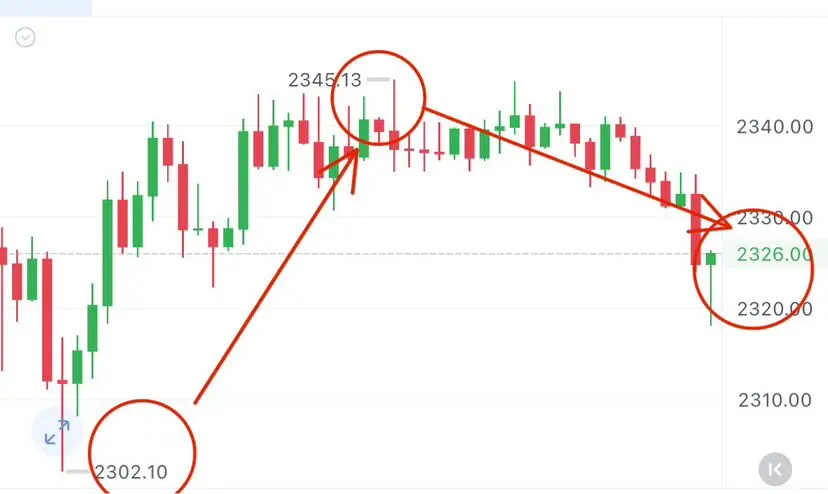
Two rebounds near 82,500, each lower than the last. This is no coincidence.
On May 7th, the surge high was accompanied by a daily volume of 1.33 million coins. On May 10th, the surge high was with a daily volume of 530k coins.
A 60% contraction. Price hit a new high, but volume didn't keep up. In natural trading theory, this is called “bullish volume exhaustion.”
Core judgment: 82,860 is very likely (about 80%) the peak of the fourth wave rebound on the weekly chart.
1. Why is the 82,860 Bitcoin price most likely the top?
First, divergence between volume and price.
Looking at the weekly chart: the price has rebounded below the major Fibonacci 0.618 level (84,500), with the first rebound to 82,860 and the second to 82,350, with decreasing highs. The area around 84,500 forms a strong resistance zone, making it difficult for the price to break through.
Next, the daily chart: daily volume is gradually shrinking, from 1.34 million on May 1st to 530k on May 10th, a 60% contraction, showing mild volume-price divergence.
Finally, the 4-hour bullish and bearish volume levels: on May 7th, during the surge, 4-hour volume was 40,000-50k coins, with bullish volume oscillating downward. Currently, bullish volume is waning, and the price can no longer be pushed higher.
Second, candlestick confirmation.
On May 10th, a long upper shadow was formed, with an upper shadow of 1,400 points. Bulls pushed up, but selling pressure brought it down, closing at the lowest point. This is called “bearish dominance.”
Third, ETF net outflows for three consecutive days.
May 7th: -$277 million, May 8th: -$162 million, May 9th: -$162 million. Institutions took profits above 82,000. Retail big V influencers are shouting “bullish return soon,” while institutions quietly distribute at the top.
Fourth, large sell orders gradually appear on the order book.
Looking at the latest order book data, another large sell order appeared today. Although the bears haven't actively dumped, they have heavily fortified at high levels. This isn't retail behavior; it's the main players “guarding the gate”—waiting for the rebound to complete, for the last wave of buy-in, then closing the position.
Fifth, the time cycle of Wave 4 has arrived.
Wave 4 ran from February to May, over 90 days; Wave 2 only lasted 60 days. Time exchanges space, and bulls have exhausted their strength.
Sixth, market sentiment is extremely euphoric.
Many big V influencers, including ETH’s die-hard bull Tom Lee, are enthusiastically shouting: “The big cycle bull market is here, Bitcoin will rise above 150k, Ethereum will reach 9,000-12,000 USD.”
This is exactly what market makers want—the ignition of retail euphoria to induce more buying. Meanwhile, institutions are secretly selling into the hype.
2. Multi-dimensional resonance: five major signals pointing to a market reversal in mid-May
First, the five-wave structure on the major cycle.
From the October 2025 high of 126,000 to the February low of 60,000, the main decline wave (Wave 3) has completed. The rebound from 60,000 to 82,860 has lasted over 90 days. The five-wave structure is nearing completion; Wave 5 decline is an inevitable wave theory projection.
Second, the end of the ascending channel.
From the February low of 60,000 to the May high of 82,860, the price has been moving along a Fibonacci ascending channel. The 1-axis (around 82,500) is the upper boundary of the channel; the price has touched this level three times and then retreated. The channel is reaching its end, not breaking out, but exhaustion. The 1-axis here is a natural trading theory strong gravitational level, with enormous pressure!
Third, geopolitical tensions and high oil prices.
US-Iran negotiations on May 10th faced setbacks again, Iran rejected the US proposal, Trump called it “completely unacceptable.” Brent crude oil rose to $104.42/barrel, WTI crude to $98.33/barrel.
High oil prices → high inflation → Federal Reserve unable to cut interest rates. This transmission chain has never been broken.
Fourth, macro policies: rate cuts are unlikely, Japan’s rate hike is imminent.
Bank of America and Goldman Sachs have delayed rate cut expectations to 2027. The probability of a Fed rate cut in June is only 1%.
The Bank of Japan’s April meeting vote was 6-3, with three members advocating immediate rate hike to 1.0%, the biggest split since Ueda took office. Market bets on a June rate hike have risen to 66%-74%.
Historical pattern: after Japan hikes rates, Bitcoin has fallen by 23%, 26%, and 31%, respectively.
Fifth, major turning point window in mid-May.
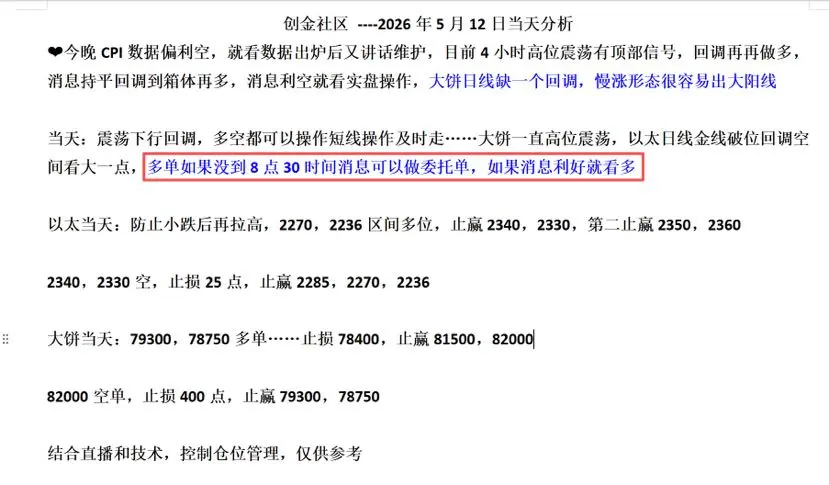
May 12: CPI data release.
May 14: Senate review of the Clarity Act.
May 15: Powell’s resignation, Wosh’s appointment.
Fibonacci trend time 2.0 node points to May 12-16.
All five dimensions simultaneously point to mid-May. It’s not a coincidence; the market is telling us: a reversal is imminent.
3. Why is the probability that 82,860 is the top not 100%?
Above 82,860, there are two more defense lines: the 200-day moving average (around 85,000), and the major Fibonacci 0.382 level (84,329).
If the CPI data on May 12th is below expectations, combined with a smooth passage of the Clarity Act review on May 14th, there is still a very low probability (about 10-15%) that the price will pulse up to 84,000-85,000 to form a second top, then fall back.
This is not a reversal but the “ultimate trap” for inducing more shorts. 84,000-85,000 is the accumulation zone for shorts, not a buy zone, but an opportunity to sell and profit from the decline!
4. Two possible future price trajectories for Bitcoin
Scenario 1: Double top induced buying (50-55% probability)
CPI or Clarity Act catalysts push the price to 82,000-83,500, forming a second top, then retreat. The second top is the golden zone for short entries.
Scenario 2: Gradual decline and bottoming (35-40% probability)
Volume cannot expand, and after oscillating weakly between 78,000-81,000, the price tests down to 75,000-78,000.
5. Only for reference: trading strategies, not investment advice
Medium-term shorts placed in batches at 82,000-84,500. Stop-loss set at 86,000.
On May 7th, Bitcoin surged to 82,860. On May 10th, it surged to 82,350.
Two rebounds near 82,500, each lower than the last. This is no coincidence.
On May 7th, the surge high was accompanied by a daily volume of 1.33 million coins. On May 10th, the surge high was with a daily volume of 530k coins.
A 60% contraction. Price hit a new high, but volume didn't keep up. In natural trading theory, this is called “bullish volume exhaustion.”
Core judgment: 82,860 is very likely (about 80%) the peak of the fourth wave rebound on the weekly chart.
1. Why is the 82,860 Bitcoin price most likely the top?
First, divergence between volume and price.
Looking at the weekly chart: the price has rebounded below the major Fibonacci 0.618 level (84,500), with the first rebound to 82,860 and the second to 82,350, with decreasing highs. The area around 84,500 forms a strong resistance zone, making it difficult for the price to break through.
Next, the daily chart: daily volume is gradually shrinking, from 1.34 million on May 1st to 530k on May 10th, a 60% contraction, showing mild volume-price divergence.
Finally, the 4-hour bullish and bearish volume levels: on May 7th, during the surge, 4-hour volume was 40,000-50k coins, with bullish volume oscillating downward. Currently, bullish volume is waning, and the price can no longer be pushed higher.
Second, candlestick confirmation.
On May 10th, a long upper shadow was formed, with an upper shadow of 1,400 points. Bulls pushed up, but selling pressure brought it down, closing at the lowest point. This is called “bearish dominance.”
Third, ETF net outflows for three consecutive days.
May 7th: -$277 million, May 8th: -$162 million, May 9th: -$162 million. Institutions took profits above 82,000. Retail big V influencers are shouting “bullish return soon,” while institutions quietly distribute at the top.
Fourth, large sell orders gradually appear on the order book.
Looking at the latest order book data, another large sell order appeared today. Although the bears haven't actively dumped, they have heavily fortified at high levels. This isn't retail behavior; it's the main players “guarding the gate”—waiting for the rebound to complete, for the last wave of buy-in, then closing the position.
Fifth, the time cycle of Wave 4 has arrived.
Wave 4 ran from February to May, over 90 days; Wave 2 only lasted 60 days. Time exchanges space, and bulls have exhausted their strength.
Sixth, market sentiment is extremely euphoric.
Many big V influencers, including ETH’s die-hard bull Tom Lee, are enthusiastically shouting: “The big cycle bull market is here, Bitcoin will rise above 150k, Ethereum will reach 9,000-12,000 USD.”
This is exactly what market makers want—the ignition of retail euphoria to induce more buying. Meanwhile, institutions are secretly selling into the hype.
2. Multi-dimensional resonance: five major signals pointing to a market reversal in mid-May
First, the five-wave structure on the major cycle.
From the October 2025 high of 126,000 to the February low of 60,000, the main decline wave (Wave 3) has completed. The rebound from 60,000 to 82,860 has lasted over 90 days. The five-wave structure is nearing completion; Wave 5 decline is an inevitable wave theory projection.
Second, the end of the ascending channel.
From the February low of 60,000 to the May high of 82,860, the price has been moving along a Fibonacci ascending channel. The 1-axis (around 82,500) is the upper boundary of the channel; the price has touched this level three times and then retreated. The channel is reaching its end, not breaking out, but exhaustion. The 1-axis here is a natural trading theory strong gravitational level, with enormous pressure!
Third, geopolitical tensions and high oil prices.
US-Iran negotiations on May 10th faced setbacks again, Iran rejected the US proposal, Trump called it “completely unacceptable.” Brent crude oil rose to $104.42/barrel, WTI crude to $98.33/barrel.
High oil prices → high inflation → Federal Reserve unable to cut interest rates. This transmission chain has never been broken.
Fourth, macro policies: rate cuts are unlikely, Japan’s rate hike is imminent.
Bank of America and Goldman Sachs have delayed rate cut expectations to 2027. The probability of a Fed rate cut in June is only 1%.
The Bank of Japan’s April meeting vote was 6-3, with three members advocating immediate rate hike to 1.0%, the biggest split since Ueda took office. Market bets on a June rate hike have risen to 66%-74%.
Historical pattern: after Japan hikes rates, Bitcoin has fallen by 23%, 26%, and 31%, respectively.
Fifth, major turning point window in mid-May.
May 12: CPI data release.
May 14: Senate review of the Clarity Act.
May 15: Powell’s resignation, Wosh’s appointment.
Fibonacci trend time 2.0 node points to May 12-16.
All five dimensions simultaneously point to mid-May. It’s not a coincidence; the market is telling us: a reversal is imminent.
3. Why is the probability that 82,860 is the top not 100%?
Above 82,860, there are two more defense lines: the 200-day moving average (around 85,000), and the major Fibonacci 0.382 level (84,329).
If the CPI data on May 12th is below expectations, combined with a smooth passage of the Clarity Act review on May 14th, there is still a very low probability (about 10-15%) that the price will pulse up to 84,000-85,000 to form a second top, then fall back.
This is not a reversal but the “ultimate trap” for inducing more shorts. 84,000-85,000 is the accumulation zone for shorts, not a buy zone, but an opportunity to sell and profit from the decline!
4. Two possible future price trajectories for Bitcoin
Scenario 1: Double top induced buying (50-55% probability)
CPI or Clarity Act catalysts push the price to 82,000-83,500, forming a second top, then retreat. The second top is the golden zone for short entries.
Scenario 2: Gradual decline and bottoming (35-40% probability)
Volume cannot expand, and after oscillating weakly between 78,000-81,000, the price tests down to 75,000-78,000.
5. Only for reference: trading strategies, not investment advice
Medium-term shorts placed in batches at 82,000-84,500. Stop-loss set at 86,000.