


$BEAT – Is It Going to Stop Traders' Heartbeat?
#Audiera has been one of the most aggressive performers of the year, rallying from approximately 0.129 to an all-time high of 11.57 in just five months. That's an extraordinary move of nearly 90x, turning early buyers into massive winners and attracting huge speculative interest along the way. However, after such a parabolic rise, sharp corrections become a normal part of the market cycle. What we're seeing now is the first serious test of whether this rally was built on sustainable demand or pure momentum.
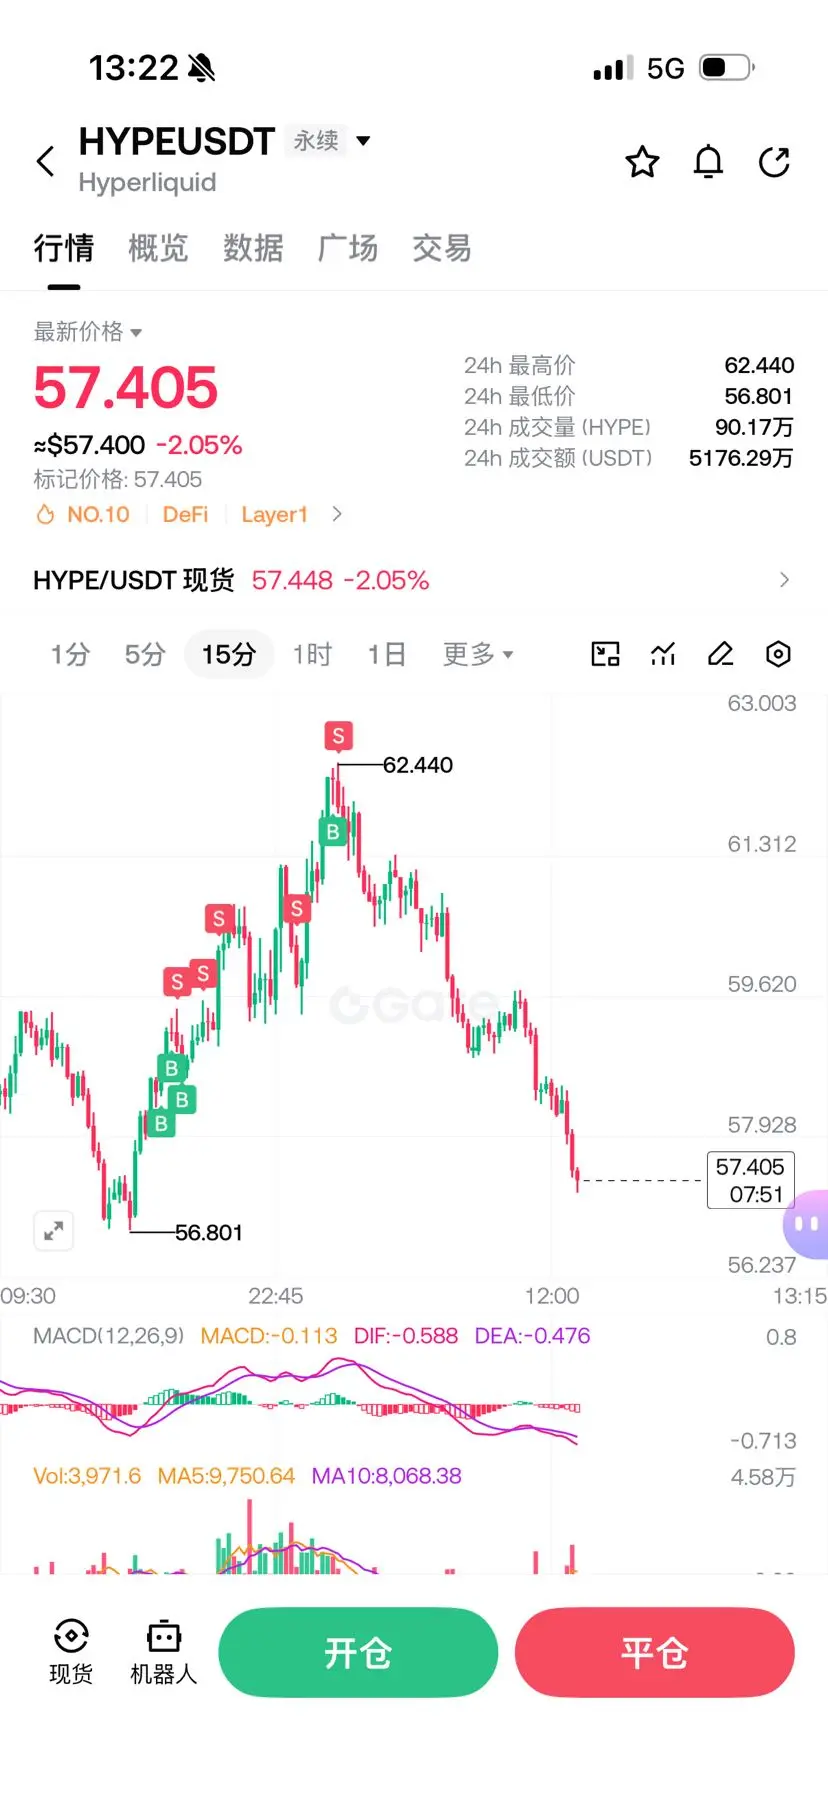
15-Minute Chart Analysis
The 15-minute chart remains heavily bearish in the short term. Price has lost the MA7 and MA25 support zones, while MACD continues printing negative momentum. RSI has fallen into oversold territory, showing panic selling rather than healthy rotation. Buyers are stepping in around the 6.2-6.5 region, but there is still no convincing reversal structure. For short-term sentiment to improve, BEAT needs a strong green impulse candle supported by volume and a reclaim of the 7.5-8.0 zone.
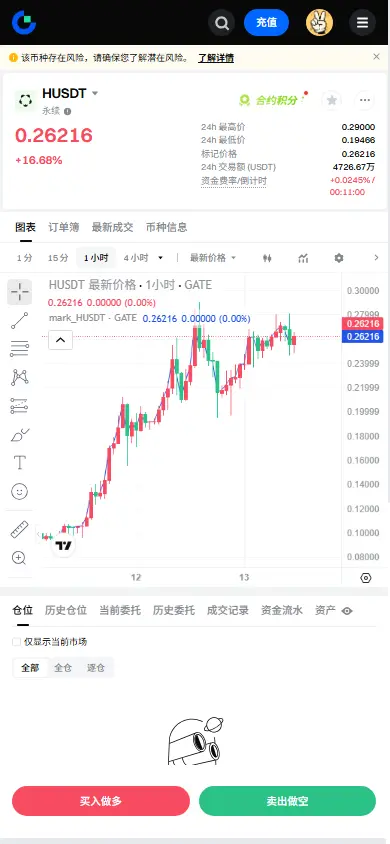
1-Hour Chart Analysis
The 1-hour timeframe is currently sitting at a critical decision point. Price has fallen directly into the MA99 support area after rejecting from the ATH region. This moving average is often a major trend support during strong rallies. If buyers defend this region successfully, the current drop can be classified as a healthy correction within a larger bullish trend. However, losing the MA99 decisively would open the door for a much deeper retracement.
MACD remains bearish, and RSI is approaching oversold levels, suggesting sellers still control momentum for now.
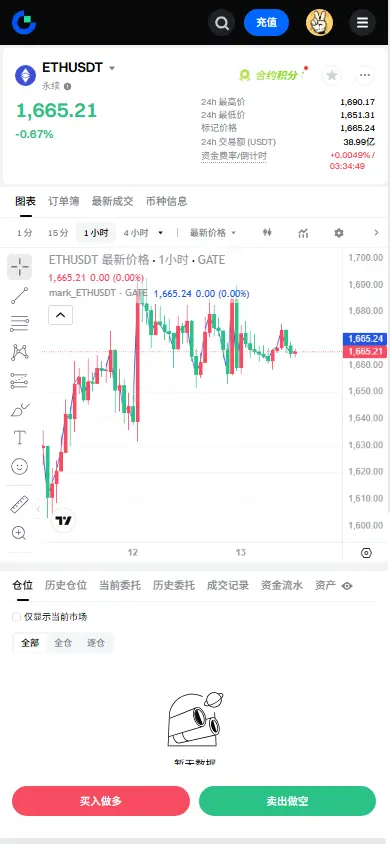
4-Hour Chart Analysis
The 4-hour chart shows price testing the MA25 support after a vertical rally. The previous bullish structure is damaged but not completely broken. The market needs consolidation and accumulation before attempting another leg higher. Volume during the decline has increased, showing that many traders are locking in profits after the massive run.
Daily Chart Analysis
The daily chart still looks surprisingly strong despite the correction. Price remains above the Daily MA7 and significantly above the MA25, MA99, and MA200. This means the larger trend remains bullish until proven otherwise. MACD remains positive on higher timeframes, although momentum is cooling rapidly. RSI has moved down from overbought territory, allowing the market to reset.
Key Levels
Support Zones
• 6.0 major psychological support
• 5.0 secondary support zone
• 3.0-5.0 deep correction region if 6 fails
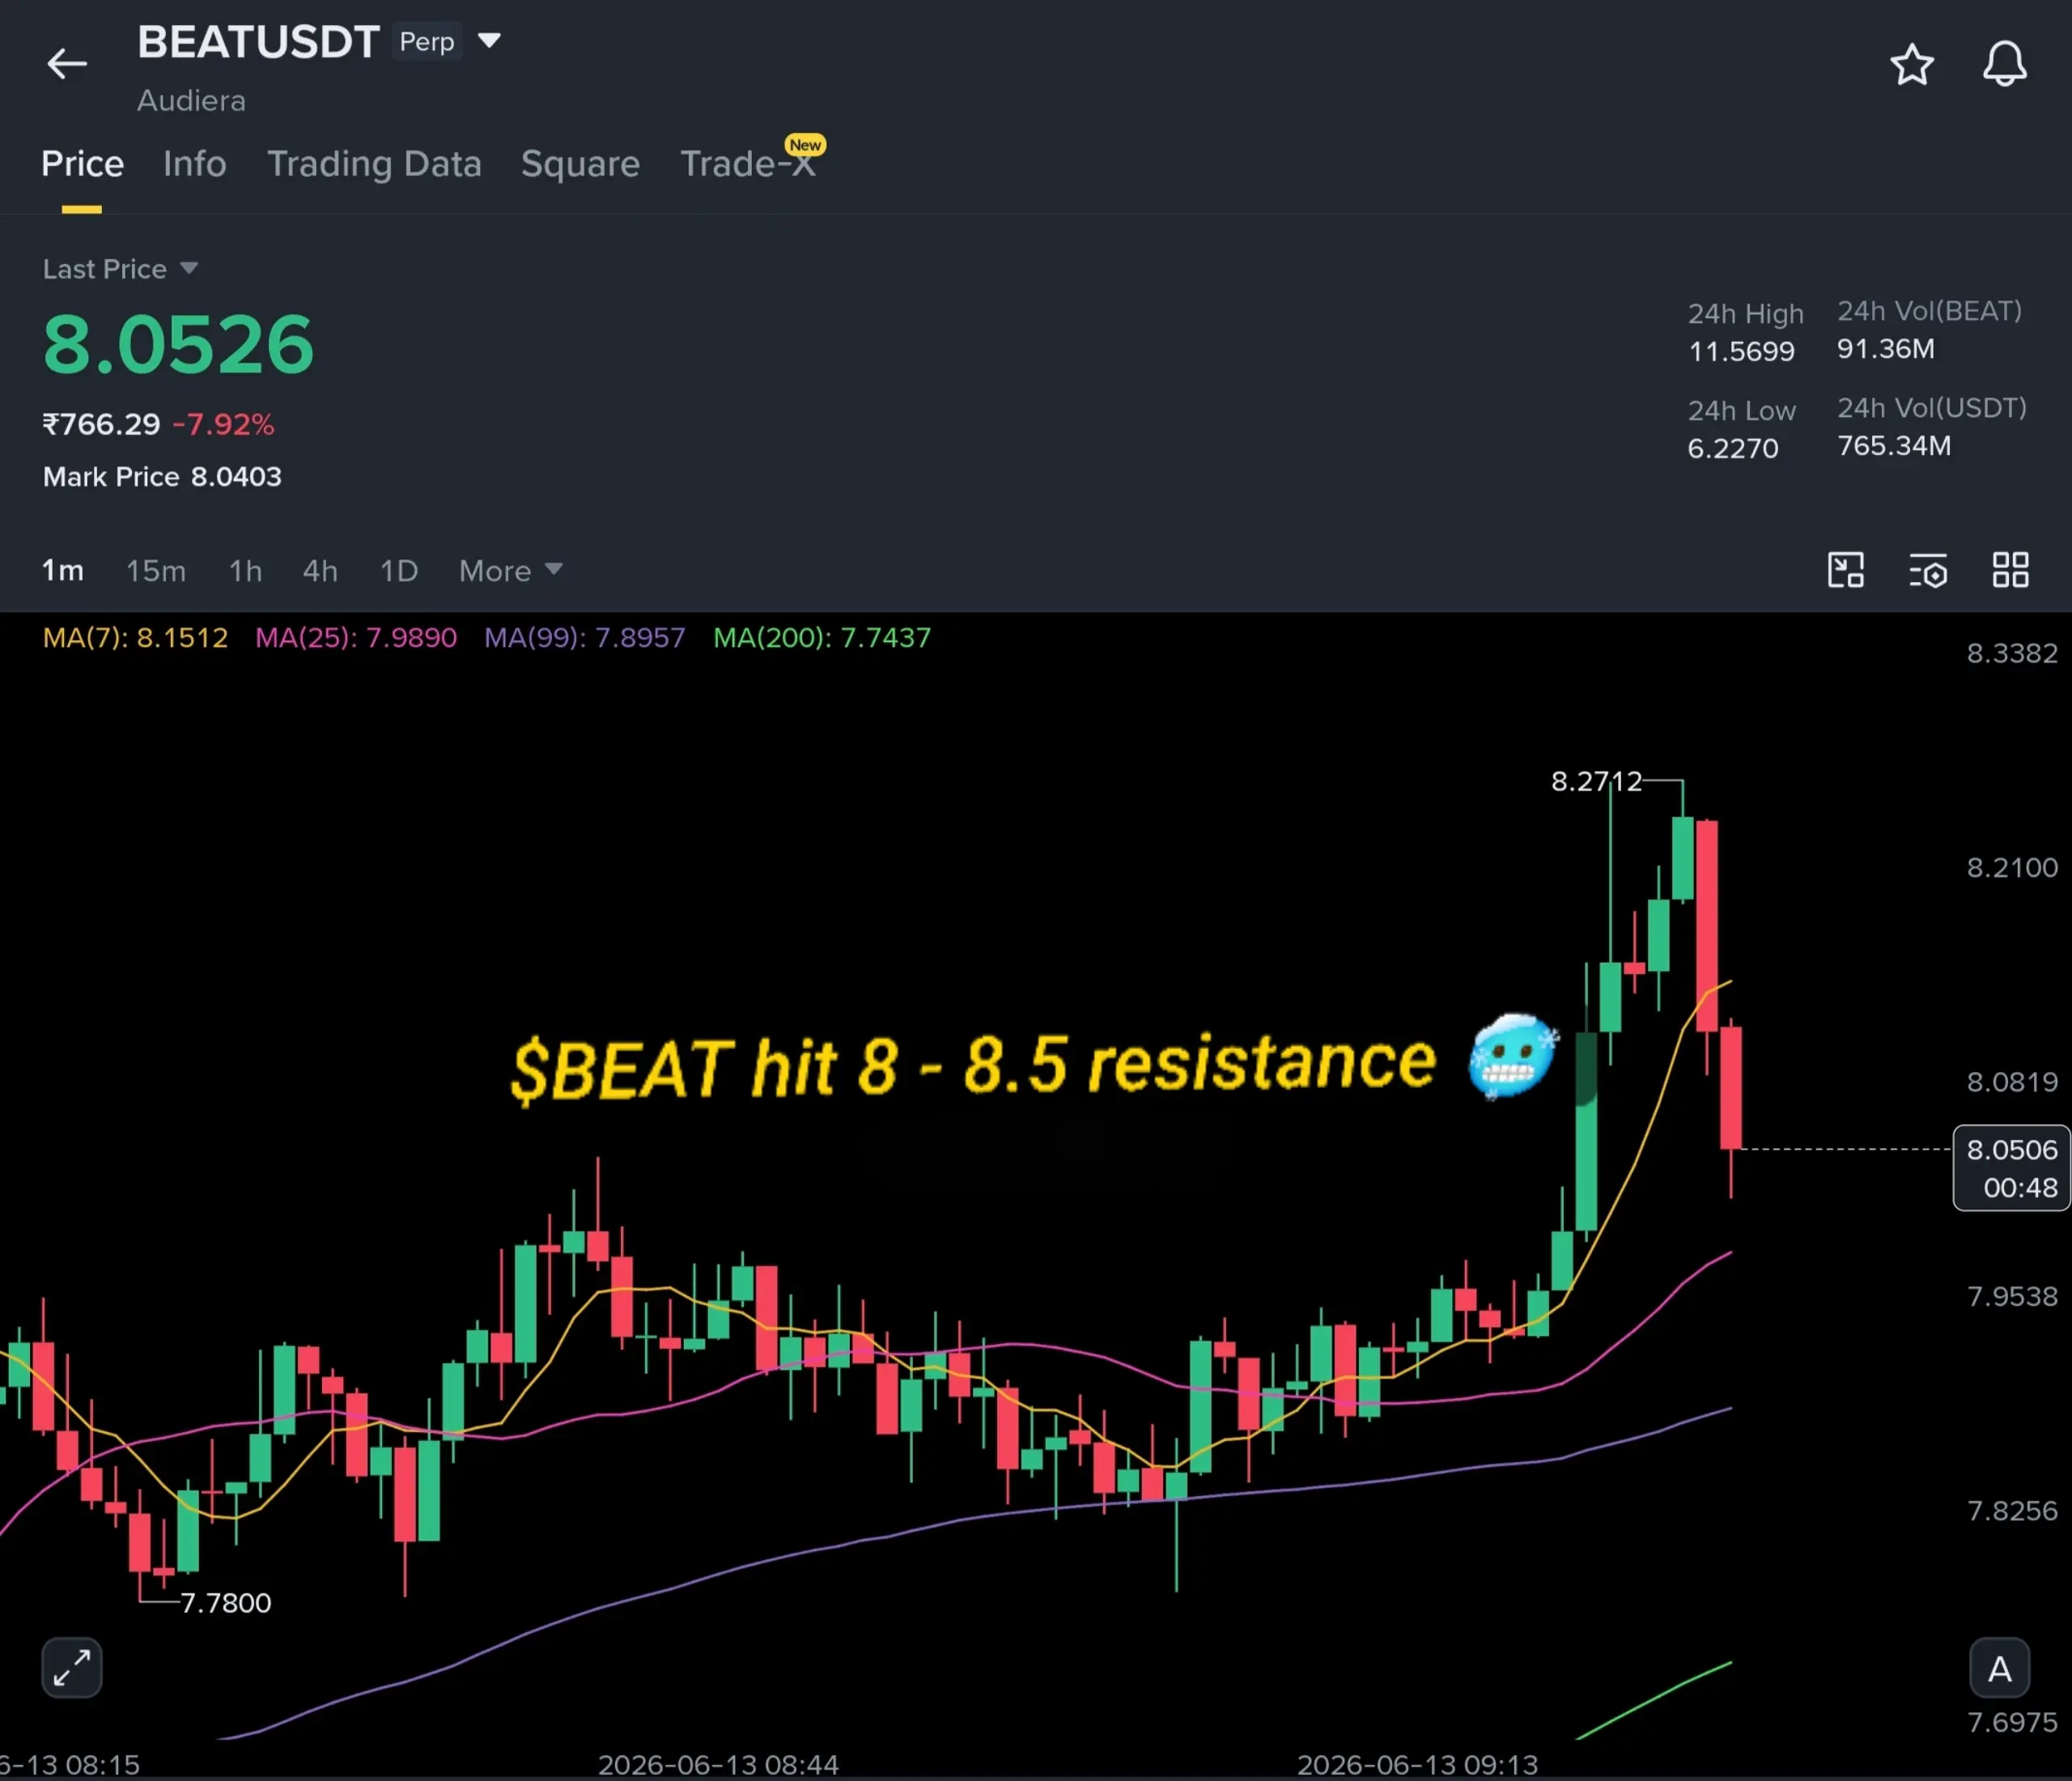
Resistance Zones
• 8.0-8.5 immediate resistance cluster
• 10.0 major breakout barrier
• 11.57 ATH resistance
Conclusion
Right now, #BEAT looks like a runner catching its breath after an incredible sprint. A move from 0.129 to 11.57 in five months is not sustainable without periods of correction and consolidation. The market is currently deciding whether this is simply profit-taking or the beginning of a larger trend reversal.
If the 6.0 support holds and buyers step in with strong volume, this correction can be viewed as healthy. Reclaiming 8.0-8.5 would be the first major sign that momentum is returning, potentially opening the path toward 15 and eventually 20.
However, if 6.0 breaks decisively, the probability of a deeper retracement toward the 3-5 region increases significantly. For now, the focus should remain on support retention, volume recovery, and whether bulls can produce the strong green candles needed to restore confidence in the trend.
#MyGateTradeStory
#Audiera has been one of the most aggressive performers of the year, rallying from approximately 0.129 to an all-time high of 11.57 in just five months. That's an extraordinary move of nearly 90x, turning early buyers into massive winners and attracting huge speculative interest along the way. However, after such a parabolic rise, sharp corrections become a normal part of the market cycle. What we're seeing now is the first serious test of whether this rally was built on sustainable demand or pure momentum.
15-Minute Chart Analysis
The 15-minute chart remains heavily bearish in the short term. Price has lost the MA7 and MA25 support zones, while MACD continues printing negative momentum. RSI has fallen into oversold territory, showing panic selling rather than healthy rotation. Buyers are stepping in around the 6.2-6.5 region, but there is still no convincing reversal structure. For short-term sentiment to improve, BEAT needs a strong green impulse candle supported by volume and a reclaim of the 7.5-8.0 zone.
1-Hour Chart Analysis
The 1-hour timeframe is currently sitting at a critical decision point. Price has fallen directly into the MA99 support area after rejecting from the ATH region. This moving average is often a major trend support during strong rallies. If buyers defend this region successfully, the current drop can be classified as a healthy correction within a larger bullish trend. However, losing the MA99 decisively would open the door for a much deeper retracement.
MACD remains bearish, and RSI is approaching oversold levels, suggesting sellers still control momentum for now.
4-Hour Chart Analysis
The 4-hour chart shows price testing the MA25 support after a vertical rally. The previous bullish structure is damaged but not completely broken. The market needs consolidation and accumulation before attempting another leg higher. Volume during the decline has increased, showing that many traders are locking in profits after the massive run.
Daily Chart Analysis
The daily chart still looks surprisingly strong despite the correction. Price remains above the Daily MA7 and significantly above the MA25, MA99, and MA200. This means the larger trend remains bullish until proven otherwise. MACD remains positive on higher timeframes, although momentum is cooling rapidly. RSI has moved down from overbought territory, allowing the market to reset.
Key Levels
Support Zones
• 6.0 major psychological support
• 5.0 secondary support zone
• 3.0-5.0 deep correction region if 6 fails
Resistance Zones
• 8.0-8.5 immediate resistance cluster
• 10.0 major breakout barrier
• 11.57 ATH resistance
Conclusion
Right now, #BEAT looks like a runner catching its breath after an incredible sprint. A move from 0.129 to 11.57 in five months is not sustainable without periods of correction and consolidation. The market is currently deciding whether this is simply profit-taking or the beginning of a larger trend reversal.
If the 6.0 support holds and buyers step in with strong volume, this correction can be viewed as healthy. Reclaiming 8.0-8.5 would be the first major sign that momentum is returning, potentially opening the path toward 15 and eventually 20.
However, if 6.0 breaks decisively, the probability of a deeper retracement toward the 3-5 region increases significantly. For now, the focus should remain on support retention, volume recovery, and whether bulls can produce the strong green candles needed to restore confidence in the trend.
#MyGateTradeStory