


If I could teach every beginner just one indicator, it would be RSI.
Why?
Because price tells you what the market is doing…
But RSI tells you how strong that move really is. 🧠
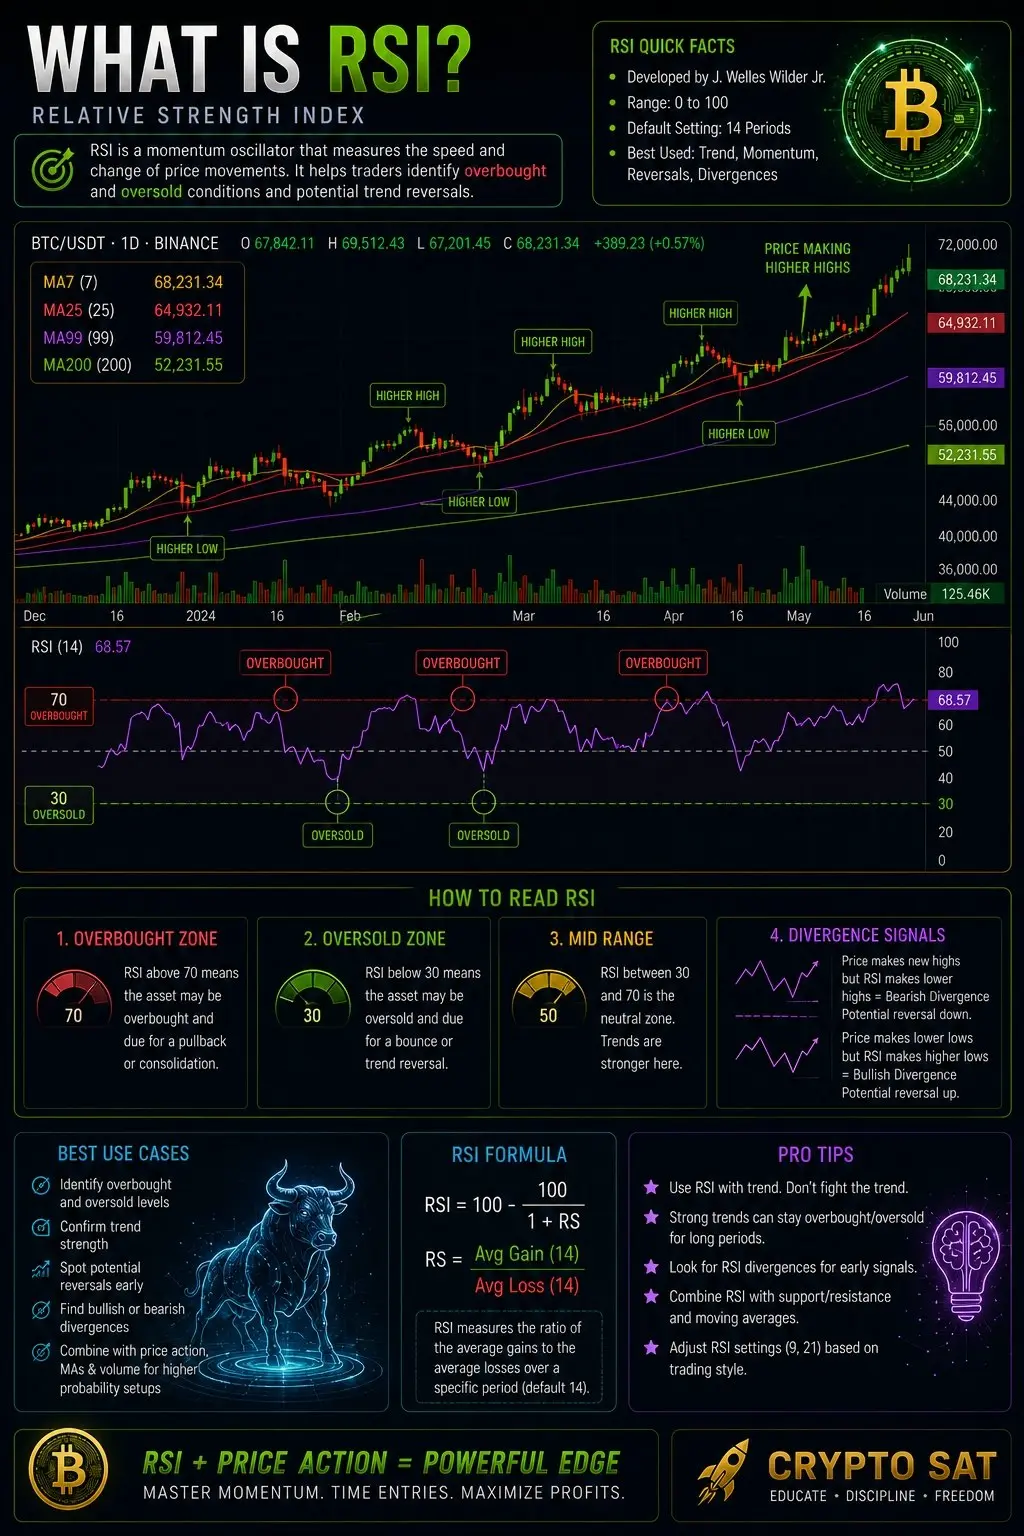
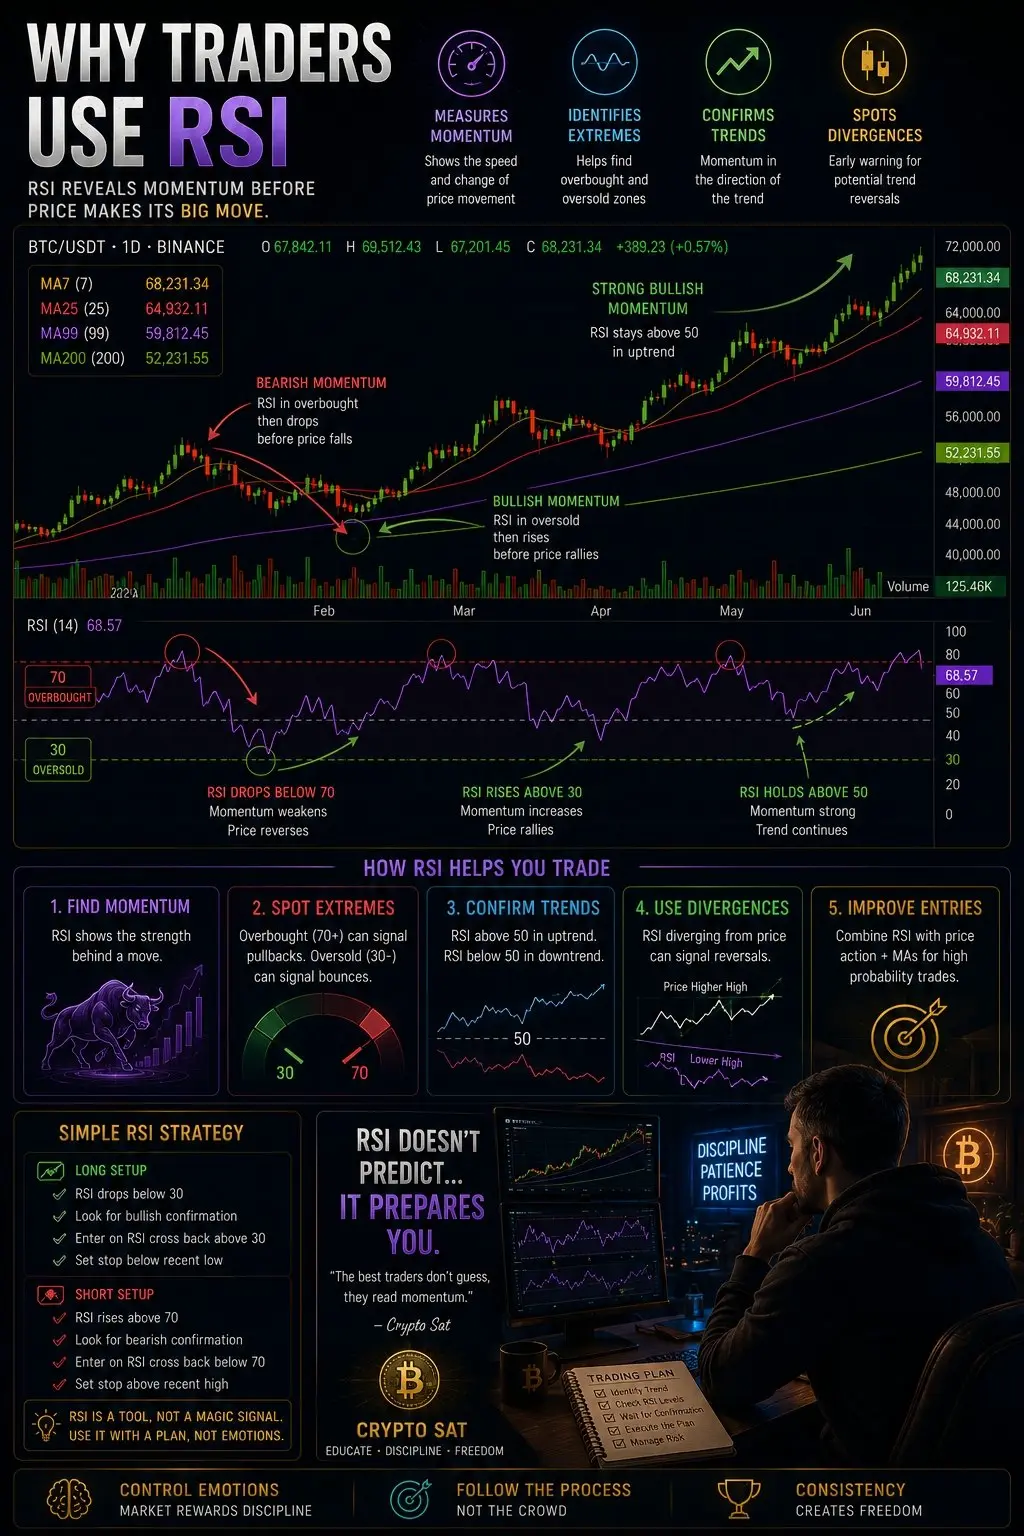
RSI stands for Relative Strength Index.
Simply put, it measures momentum.
It shows whether buyers or sellers currently have more strength.
The RSI scale moves between:
🔹 0 = Extremely weak momentum
🔹 100 = Extremely strong momentum
Most traders pay attention to these levels:
▫️ Above 70 = Market may be overheated or overbought.
▫️ Below 30 = Market may be oversold and losing selling pressure.
But here's the important lesson:
▪️Overbought doesn't automatically mean sell.
▪️Oversold doesn't automatically mean buy.
Momentum can stay strong for much longer than people expect.
📈 Let's use $BTC as an example.
Imagine BTC rallies from $100K to $110K.
Price looks expensive.
Many beginners instantly short because RSI reaches 75.
Then BTC keeps climbing to $115K and liquidates them.
Why?
Because price and momentum are not the same thing.
Price tells you where the market is.
Momentum tells you how aggressively it's moving.
A strong trend can keep RSI elevated for a long time.
This is why professional traders use RSI as a confirmation tool, not a prediction tool.
For example:
🟢 BTC above major Moving Averages + RSI rising above 50
= Bullish momentum supporting the trend.
🔴 BTC losing support + RSI falling below 50
= Momentum weakening.
The best traders don't ask: "Is RSI overbought?"
They ask: "Is momentum supporting my trade idea?"
📌 RSI won't predict the future.
But it will help you understand the strength behind the current move.
And understanding momentum is one of the biggest steps toward becoming a better trader.
Save this post and start looking at momentum differently. 🧠
#PreIPOsSeason2OpenAISubscription
Why?
Because price tells you what the market is doing…
But RSI tells you how strong that move really is. 🧠
RSI stands for Relative Strength Index.
Simply put, it measures momentum.
It shows whether buyers or sellers currently have more strength.
The RSI scale moves between:
🔹 0 = Extremely weak momentum
🔹 100 = Extremely strong momentum
Most traders pay attention to these levels:
▫️ Above 70 = Market may be overheated or overbought.
▫️ Below 30 = Market may be oversold and losing selling pressure.
But here's the important lesson:
▪️Overbought doesn't automatically mean sell.
▪️Oversold doesn't automatically mean buy.
Momentum can stay strong for much longer than people expect.
📈 Let's use $BTC as an example.
Imagine BTC rallies from $100K to $110K.
Price looks expensive.
Many beginners instantly short because RSI reaches 75.
Then BTC keeps climbing to $115K and liquidates them.
Why?
Because price and momentum are not the same thing.
Price tells you where the market is.
Momentum tells you how aggressively it's moving.
A strong trend can keep RSI elevated for a long time.
This is why professional traders use RSI as a confirmation tool, not a prediction tool.
For example:
🟢 BTC above major Moving Averages + RSI rising above 50
= Bullish momentum supporting the trend.
🔴 BTC losing support + RSI falling below 50
= Momentum weakening.
The best traders don't ask: "Is RSI overbought?"
They ask: "Is momentum supporting my trade idea?"
📌 RSI won't predict the future.
But it will help you understand the strength behind the current move.
And understanding momentum is one of the biggest steps toward becoming a better trader.
Save this post and start looking at momentum differently. 🧠
#PreIPOsSeason2OpenAISubscription