The PPO measures momentum through the percentage difference between two exponential moving averages, while a separate EMA identifies broader trend direction. For crypto swing traders and active momentum traders, understanding their interaction helps distinguish trend continuation from temporary price movements. The approach covers indicator settings, entry confirmation, multiple timeframes, and risk management.
Key Takeaways
-
A PPO EMA strategy combines momentum confirmation with trend identification to filter weaker trading signals.
-
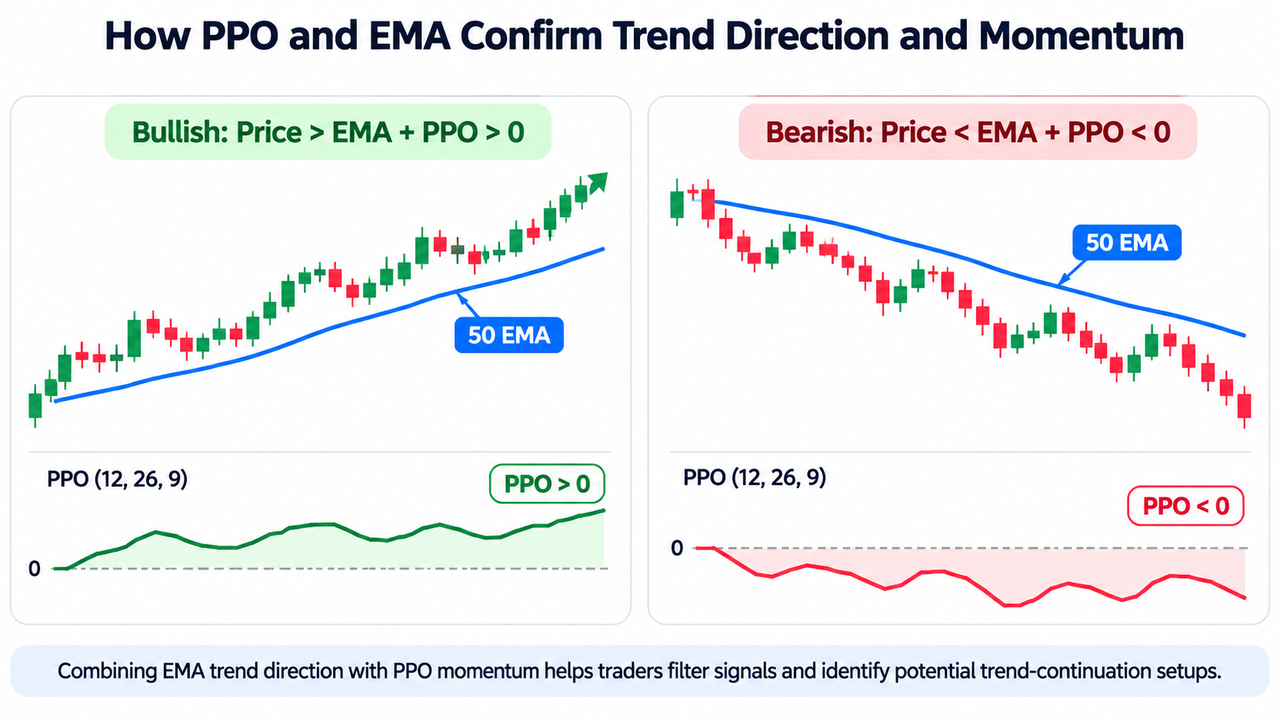
PPO readings above zero suggest bullish momentum, while negative readings indicate bearish momentum.
-
Price above a rising EMA supports bullish setups; price below a falling EMA supports bearish setups.
-
Signal line crossovers, price action, and volume analysis can strengthen entry confirmation.
-
Sideways markets, indicator lag, and market volatility can produce misleading signals even when both indicators agree.
How PPO and EMA Work Together as Momentum Indicators
The Percentage Price Oscillator measures the percentage difference between fast and slow exponential moving averages. Unlike the Moving Average Convergence Divergence (MACD), which expresses the difference in price units, PPO normalizes momentum as a percentage.
Its standard calculation is:
PPO = [(12-period EMA − 26-period EMA) / 26-period EMA] × 100
A nine-period EMA of the PPO forms its signal line. The default setting is commonly written as PPO (12, 26, 9).
According to StockCharts' Percentage Price Oscillator documentation, positive readings indicate that the shorter EMA exceeds the longer EMA. Negative readings indicate the opposite.
PPO isn't restricted to a −1 to +1 range. Its percentage-based calculation allows traders to compare momentum strength across assets with different prices.
The PPO indicator measures momentum shifts, while the EMA establishes directional context.
An EMA assigns greater weight to recent prices than older observations. A 50-period EMA can help identify intermediate market trends, while a 200-period EMA provides a longer-term reference.
The distinction between EMA 20 and EMA 50 for swing trading matters because shorter moving averages react faster but tend to produce more noise.
How to Combine PPO and EMA to Filter Momentum With Trend Direction
A practical PPO EMA strategy follows three stages: identify the prevailing trend, confirm momentum, and validate price action before considering potential entry points.
Step 1: Identify Trend Direction With Exponential Moving Averages
Begin with a 50-period EMA on the trading chart.
-
Bullish trend: Price holds above a rising EMA.
-
Bearish trend: Price remains below a declining EMA.
-
Unclear trend: Price repeatedly crosses a relatively flat EMA.
For longer-term position trading, traders sometimes use the 50-day and 200-day moving averages.
A golden cross occurs when the 50-day EMA crosses above the 200-day EMA, although traditional golden-cross analysis frequently uses simple moving averages.
Traders can also evaluate dynamic support and resistance using moving averages to determine whether price respects the broader trend.
Step 2: Confirm Market Momentum With PPO
Once trend direction is established, inspect the PPO zero line and signal line crossovers.
| Market condition |
EMA confirmation |
PPO confirmation |
| Bullish continuation |
Price above rising EMA |
PPO above zero and strengthening |
| Bearish continuation |
Price below falling EMA |
PPO below zero and weakening |
| Bullish recovery |
Price reclaiming EMA |
PPO crossing above signal line |
| Bearish reversal risk |
Price breaking below EMA |
PPO turning negative |
| Sideways conditions |
Flat EMA with repeated crossings |
Frequent zero-line crossovers |
A bullish PPO signal line crossover can indicate improving momentum before a zero-line crossover occurs. The reverse applies to bearish signals.
These are different trading signals. A crossover above the signal line while PPO remains negative may indicate an early recovery, not an established bullish trend.
The PPO versus MACD comparison shows why percentage normalization is useful when comparing different financial markets.
Step 3: Use Price Action Analysis for Entry Confirmation
Suppose a trader examines the BTC/USDT spot chart on Gate.com.
In a hypothetical setup, Bitcoin trades at $70,000 while its rising 50-period EMA sits at $69,200. PPO reads +0.8%, and its signal line stands at +0.5%.
The configuration suggests bullish momentum aligned with trend direction.
But entering immediately may expose the position to a temporary price spike.
A pullback toward the EMA followed by a higher low and bullish candle close would provide additional price confirmation.
The breakout confirmation and retest approach can help distinguish sustained buying pressure from brief breakouts.
How Multiple Timeframes Improve Trend Identification
Multiple time frame analysis compares price action across different chart periods. A top-down approach starts with the highest timeframe before examining lower charts for entries.
One practical arrangement is:
| Trading horizon |
Timeframe |
Purpose |
| Higher |
Daily |
Identify prevailing trend |
| Medium |
4-hour |
Confirm PPO momentum |
| Lower |
1-hour |
Refine entry and stop placement |
A common heuristic separates neighboring timeframes by approximately four to six times, although no fixed ratio guarantees more accurate signals.
For example, when daily price action supports an uptrend, a four-hour positive PPO reading may reinforce trend continuation. A one-hour bullish signal can then help identify trading pullbacks.
The multiple-timeframe trading approach also highlights why lower-timeframe signals should be interpreted within broader market structure.
Too many timeframes can create conflicting signals and analysis paralysis.
Momentum Trading Strategies and Additional Confirmation
PPO and EMA work best when additional indicators answer a different question.
The Relative Strength Index measures momentum on a 0–100 scale. RSI readings above 70 commonly indicate overbought conditions, although strong trends can remain overbought for extended periods.
A stochastic oscillator can identify shorter momentum swings, while volume analysis helps determine whether participation supports price movements.
Other momentum trading strategies include breakout momentum, volume-weighted momentum, and sector rotation in traditional financial markets.
For crypto, price, volume, and momentum confirmation can provide a more complete assessment than adding several similar oscillators.
Importantly, PPO is a conventional technical indicator. It isn't the same as proximal policy optimisation, a reinforcement learning algorithm.
How to Detect Momentum Shifts and Potential Trend Reversals
Divergence occurs when price movements and PPO readings disagree.
A bearish divergence forms when price establishes a higher high while PPO makes a lower high. This suggests weakening bullish momentum, even if the prevailing trend remains positive.
Likewise, bullish divergence occurs when price records a lower low while PPO forms a higher low.
Divergence doesn't guarantee a reversal. Traders commonly seek additional confirmation through EMA breaks, market structure changes, or expanding volume.
Comparing MACD momentum across consecutive price swings uses similar reasoning to evaluate momentum strength.
Risk Management in a PPO EMA Strategy
Proper risk management techniques matter because momentum indicators react to historical prices and can lag sudden market changes.
For long positions, stop-loss placement below a recent swing low may provide a structural invalidation level. For shorts, the equivalent reference is above a swing high.
Profit targets can be based on previous resistance, support zones, or a predefined risk-reward ratio.
The ATR volatility indicator helps estimate normal price fluctuations, allowing traders to assess whether their stops are unusually tight.
Market volatility can still produce slippage or execution beyond intended stop prices. The FINRA explanation of stop-order risks describes why stop orders cannot guarantee a particular execution price.
Range-bound markets present another problem. Flat EMAs and frequent PPO crossovers can trigger repeated buy signals and sell signals without meaningful trend continuation.
Traders can paper trade crypto on Gate.com to assess settings before risking capital.
Track performance metrics such as win rate, average reward-to-risk ratio, transaction costs, and maximum drawdown. No reliable general evidence establishes that PPO alone reduces drawdown by a fixed percentage.
Conclusion
Combining PPO with EMA helps traders align momentum signals with the prevailing trend. EMA establishes directional bias, while PPO measures whether momentum supports that direction.
The strategy is most useful in trending markets with clear price structure. During sideways conditions, multiple indicators may agree without producing a reliable opportunity. Consistent risk management, price confirmation, and ongoing monitoring remain essential.
FAQs
What are the best PPO and EMA settings for swing trading?
PPO (12, 26, 9) combined with a 50-period EMA is a common starting configuration. Settings should be evaluated against the asset, volatility, and trading horizon rather than treated as universally optimal.
Can PPO and EMA identify buy and sell signals?
Yes. Price above a rising EMA with PPO above zero suggests bullish alignment. Price below a falling EMA with PPO below zero suggests bearish alignment, but neither condition guarantees profitable entries.
Is PPO better than MACD for momentum trading?
PPO expresses moving average convergence divergence as a percentage, making cross-asset comparisons easier. MACD expresses the EMA difference in price units and may be more intuitive when examining one asset.
Does the PPO EMA strategy work in sideways markets?
It is generally less reliable in range-bound markets. Repeated EMA crossings and PPO fluctuations around zero can create false signals without sustained directional movement.
Can PPO EMA strategies improve trading success?
Combining trend and momentum filters can make trading decisions more structured, but improved risk-adjusted performance must be demonstrated through testing. Results depend on market conditions, trading costs, position sizing, and execution.
Disclaimer: This content is educational and does not constitute investment advice. Technical indicators and historical performance cannot guarantee future trading results. Cryptocurrency trading carries substantial risk, including potential loss of capital.