For traders deciding which indicator fits a crypto chart, the comparison goes beyond the formula. The key differences involve signal-line crossovers, zero-line behavior, histogram readings, divergence, cross-asset comparison, and the risk of false signals during sideways price action. Understanding those tradeoffs helps clarify when PPO's percentage-based structure adds useful context and when MACD's simpler absolute reading is enough, while also showing why neither indicator should be used without price action and other technical analysis tools.
Key Takeaways
-
PPO and MACD use similar moving-average logic, but PPO converts the EMA difference into a percentage.
-
PPO readings can be compared more meaningfully across securities with very different price levels.
-
Both indicators use zero-line or centerline crossovers, signal-line crossovers, histograms, and divergence to assess momentum.
-
PPO isn't designed specifically to identify overbought and oversold levels in the way RSI or the stochastic oscillator is.
-
Neither PPO nor MACD should be treated as a standalone buy signal or sell decision because both can produce false signals during sideways price movements.
Percentage Price Oscillator vs. MACD: The Main Difference
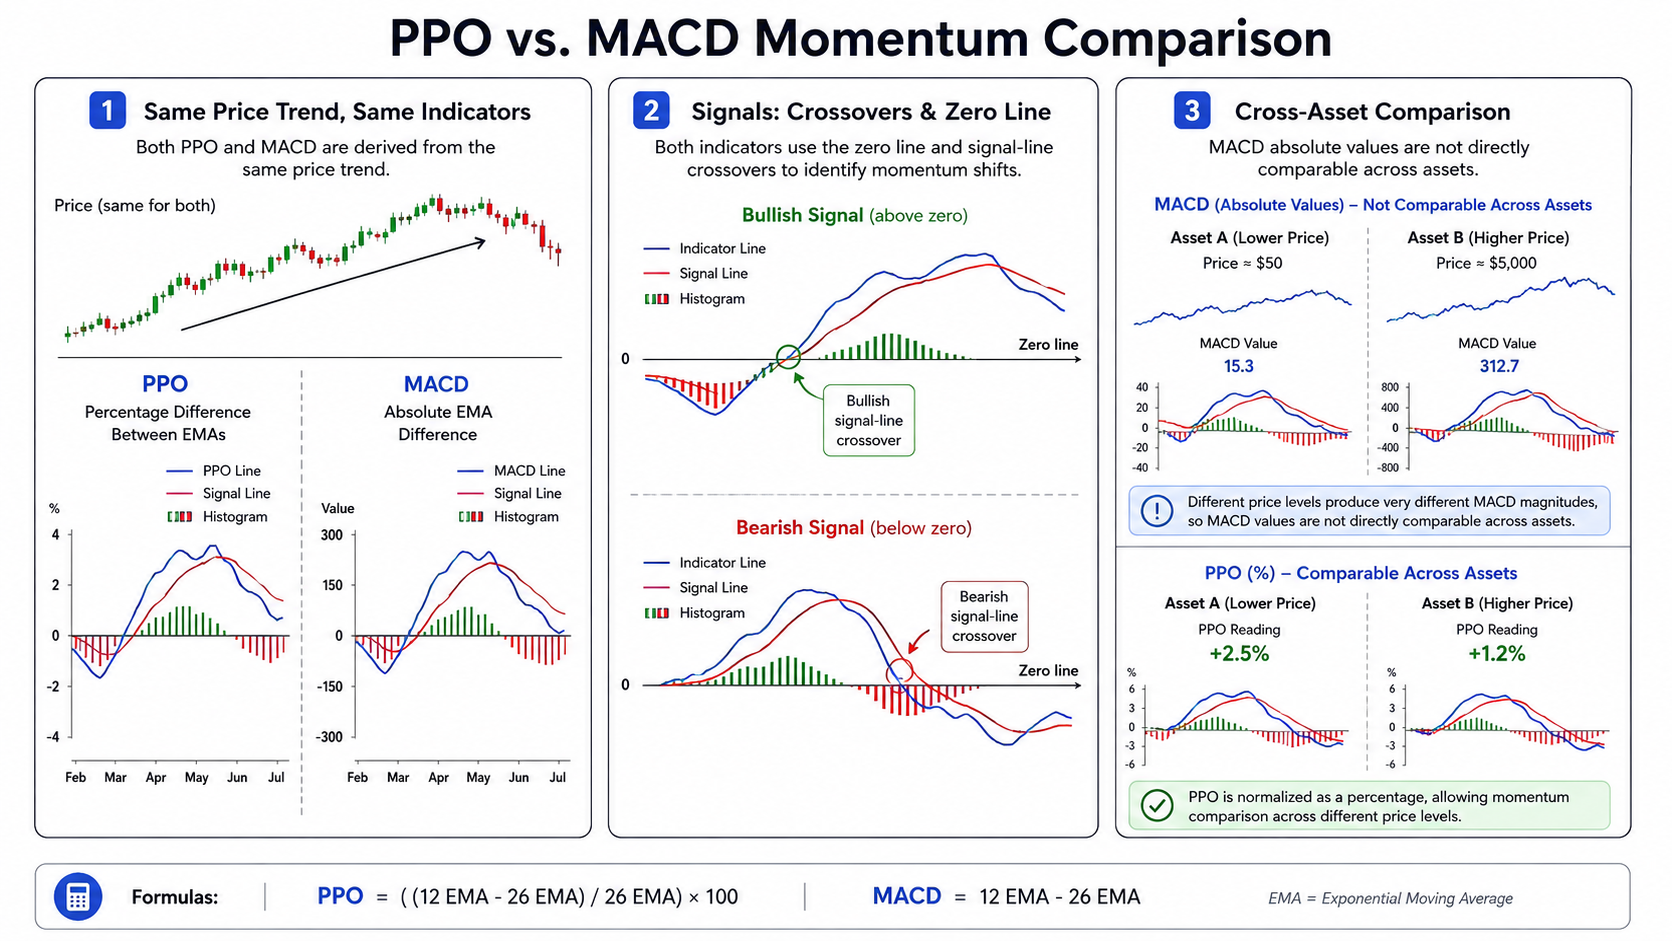
The Percentage Price Oscillator PPO compares a shorter exponential moving average with a longer EMA and divides that difference by the longer moving average.
A common configuration is:
PPO = ((12-day EMA − 26-day EMA) / 26-day EMA) × 100
If the 12-period EMA is above the 26-period EMA, the PPO value is positive. If it falls below, PPO moves into negative territory. The standard setup then applies a nine-period EMA to the PPO line to create the signal line.
MACD begins with essentially the same two exponential moving averages:
MACD = 12-period EMA − 26-period EMA
The difference is normalization. MACD measures the absolute distance between the moving averages in price units, while PPO shows the percentage difference. Gate Learn's explanation of the Percentage Price Oscillator and its overview of the MACD indicator illustrate this distinction directly.
| Feature |
PPO |
MACD |
| Calculation |
EMA difference as percentage |
Absolute EMA difference |
| Typical inputs |
12, 26, 9 |
12, 26, 9 |
| Zero line |
Yes |
Yes |
| Signal line |
Yes |
Yes |
| Histogram |
PPO minus signal line |
MACD minus signal line |
| Cross-asset comparison |
Stronger |
Less suitable |
| Price-level dependence |
Normalized |
Affected by price level |
| Overbought/oversold scale |
No fixed levels |
No fixed levels |
Why Percentage Terms Matter When Comparing Large Price Changes
PPO's main advantage appears in a direct comparison between assets.
Suppose one cryptocurrency trades near $1 while another trades near $10,000. A $20 difference between two moving averages would be enormous for the first asset and negligible for the second. Raw MACD levels can't be compared cleanly because MACD is affected by the underlying security's price.
PPO solves that problem by expressing the moving-average gap as a percentage. A PPO reading of +3% has the same mathematical meaning regardless of whether the asset price is $2, $200, or $20,000.
This also helps when analyzing one asset over extended periods during which its price rises substantially. A MACD value that looked unusually large at a lower price may become routine after a major price expansion.
PPO can consequently appear more volatile than MACD in percentage terms when relative price changes are large. That doesn't automatically mean the underlying market is more volatile; it reflects how the indicator scales price movements.
How PPO Signal Line Crossovers Create a Buy or Sell Signal
The PPO line crosses its signal line in much the same way MACD crosses its own signal line.
A commonly interpreted buy signal occurs when the PPO line crosses above the PPO signal line. It suggests short-term momentum is improving relative to the smoothed momentum trend.
A sell signal occurs when the PPO line crosses below its signal line, indicating weakening momentum.
The PPO histogram displays the difference between the PPO line and signal line. A widening positive histogram means the PPO line is moving further above its signal line, while a shrinking histogram can indicate that upward momentum is slowing.
MACD uses the same basic line crossover structure. This is why the two indicators can produce very similar trade signals when applied to the same security with identical settings.
The catch is that a signal line crossover is an already extant signal derived from moving averages. It reacts to price changes that have already happened rather than predicting the next move.
Zero Line, Centerline Crossovers and Identifying Trends
The zero line gives PPO and MACD another useful trend reference.
A positive PPO indicates that the shorter EMA is above the longer EMA. That generally points to upward momentum. Negative PPO readings indicate the short EMA has moved below the long EMA, which is associated with downward trend momentum.
A move through zero can therefore act as a broader trend signal:
-
PPO above zero: shorter EMA above longer EMA
-
PPO below zero: shorter EMA below longer EMA
-
Rising positive PPO: upside momentum may be strengthening
-
Falling negative PPO: selling pressure may be strengthening
MACD uses the same centerline logic. Traders who want a deeper foundation in the underlying calculation can compare how an exponential moving average weights recent price data more heavily than a simple moving average.
Bullish and Bearish Divergence Can Flag Potential Reversals
Both PPO and MACD can identify divergence between momentum and price action.
A bullish divergence may form when price creates a lower low while PPO forms a higher low. Momentum is declining less aggressively even though price continues lower, which can warn of a potential price reversal.
A bearish divergence occurs when price reaches a higher high while the momentum oscillator forms a lower high. That can indicate weakening upward momentum.
Divergence is not confirmation of a trend reversal. Strong trends can maintain divergence for extended periods before price responds, and sometimes no meaningful reversal follows at all.
This is one reason traders may combine momentum signals with price structure, support and resistance, volume, or broader technical indicators instead of treating divergence as an automatic entry or exit point.
PPO vs. MACD for Comparing Momentum Across Assets
For compare momentum use cases, PPO has the clearer advantage.
Imagine BTC and a much lower-priced altcoin both show strengthening momentum. Comparing their MACD levels doesn't say which has experienced the larger relative shift because those values depend partly on price levels.
PPO readings are standardized. A trader can compare +1%, +3%, and +5% PPO values across different markets far more directly.
For example, someone examining BTC/USDT and ETH/USDT on an exchange like Gate can apply the same PPO settings and compare relative momentum rather than comparing raw dollar-based MACD values. Both Gate market pages include live market charts that can be used for this type of technical analysis.
MACD remains useful when the goal isn't to compare assets. A trader concentrating on one security may care more about direction, line crossover behavior and changes in its MACD histogram than whether MACD levels are comparable with another market.
PPO, Overbought and Oversold Levels, and Bollinger Bands
Neither PPO nor MACD has fixed overbought and oversold levels.
That's different from the Relative Strength Index, which uses a bounded scale, or the stochastic oscillator, which evaluates closing prices relative to a recent trading range.
A very high positive PPO shows a large percentage separation between its moving averages, but it doesn't create a universal level at which an asset becomes "overbought."
Other technical analysis tools can fill different roles. Bollinger Bands, for example, use a moving average with volatility-based bands and can help traders examine whether price movement is expanding or contracting. Gate Learn's broader technical-indicator framework describes Bollinger Band width as a measure of changing volatility rather than directional momentum.
False Signals and Sideways Price Movements
The biggest weakness shared by PPO and MACD appears when price stops trending.
Small price changes can repeatedly push the short and long moving averages across one another. The result may be a sequence of PPO crossovers, MACD line crossover signals and centerline crossovers without a sustained move.
These false signals become particularly troublesome when traders interpret every crossover as a buy signal or sell signal.
Because PPO consists of smoothed historical price data, it also carries lag. By the time a crossover appears, part of the price movement may already have occurred. MACD has the same limitation because its signals are also moving-average based.
Price structure can help filter that noise. So can indicators designed to answer different questions. For instance, TSI vs. RSI compares smoothed momentum with a bounded momentum scale, while Awesome Oscillator vs. MACD contrasts median-price momentum with an EMA-based trend-momentum model.
PPO vs. MACD Indicator: Which Is Better for Momentum Trading?
PPO is generally better when traders need percentage-based momentum that can be compared across assets, securities, price levels or long periods of major price change. MACD is often sufficient when the goal is to analyze trend momentum within one market.
Neither indicator has an inherent advantage for every trading strategy. Their line crossovers, zero-line signals, histograms and divergences are closely related because both originate from exponential moving averages.
The deciding feature is scale. PPO shows relative movement; MACD shows absolute movement.
For practical momentum trading, that distinction matters most when comparing assets. For identifying trends within a single chart, the difference may be much less important. In either case, past performance and historical momentum signals don't guarantee future results, and neither indicator should replace price action, risk controls or independent confirmation.
FAQ
Is PPO better than MACD?
PPO can be better when comparing different securities because its values are expressed as percentages. MACD may be perfectly adequate when analyzing one asset without needing cross-asset comparisons.
What does a positive PPO value mean?
A positive PPO means the shorter exponential moving average is above the longer EMA. With the standard 12- and 26-period settings, it means the 12-period EMA is above the 26-period EMA and momentum is generally in positive territory.
What is the PPO histogram?
The PPO histogram is the difference between the PPO line and its signal line. Positive and expanding histogram bars indicate strengthening momentum relative to the signal line, while contraction can indicate that momentum is slowing.
Does PPO generate buy and sell signals?
A PPO line crossing above its signal line is commonly interpreted as a potential buy signal, while a cross below can act as a potential sell signal. Crossovers can fail during sideways markets, so they don't guarantee profitable trade signals.
Can PPO identify overbought and oversold conditions?
Not through standardized thresholds. PPO isn't bounded and has no universal overbought or oversold levels. RSI and stochastic-based indicators are more directly designed for that type of analysis.
Why is PPO easier to compare across assets than MACD?
PPO divides the difference between two EMAs by the slower EMA and expresses the result as a percentage. MACD retains the absolute difference, making its numerical values dependent on the security's price level.
Disclaimer: This content is for educational purposes only and does not constitute financial or investment advice. Technical indicators use historical data and can produce false signals. Past performance does not guarantee future results.







