For crypto traders planning pullback entries, exits, or trend continuation trades, the challenge is recognizing meaningful price reactions without mistaking every moving average touch for a trading signal.
Key Takeaways
-
Moving averages act as dynamic support below price and dynamic resistance above price, particularly in trending markets.
-
The 20, 50, 100, and 200-period moving averages provide different perspectives on market trends.
-
EMA reacts faster to recent price movements, while SMA produces smoother signals.
-
Price action, trading volume, and historical support and resistance levels help confirm potential reactions.
-
Sideways markets, sudden volatility, and false breakouts can weaken moving average signals.
What Is Dynamic Support and Resistance?
Dynamic support and resistance refer to changing price zones where buying or selling pressure may interrupt an existing trend.
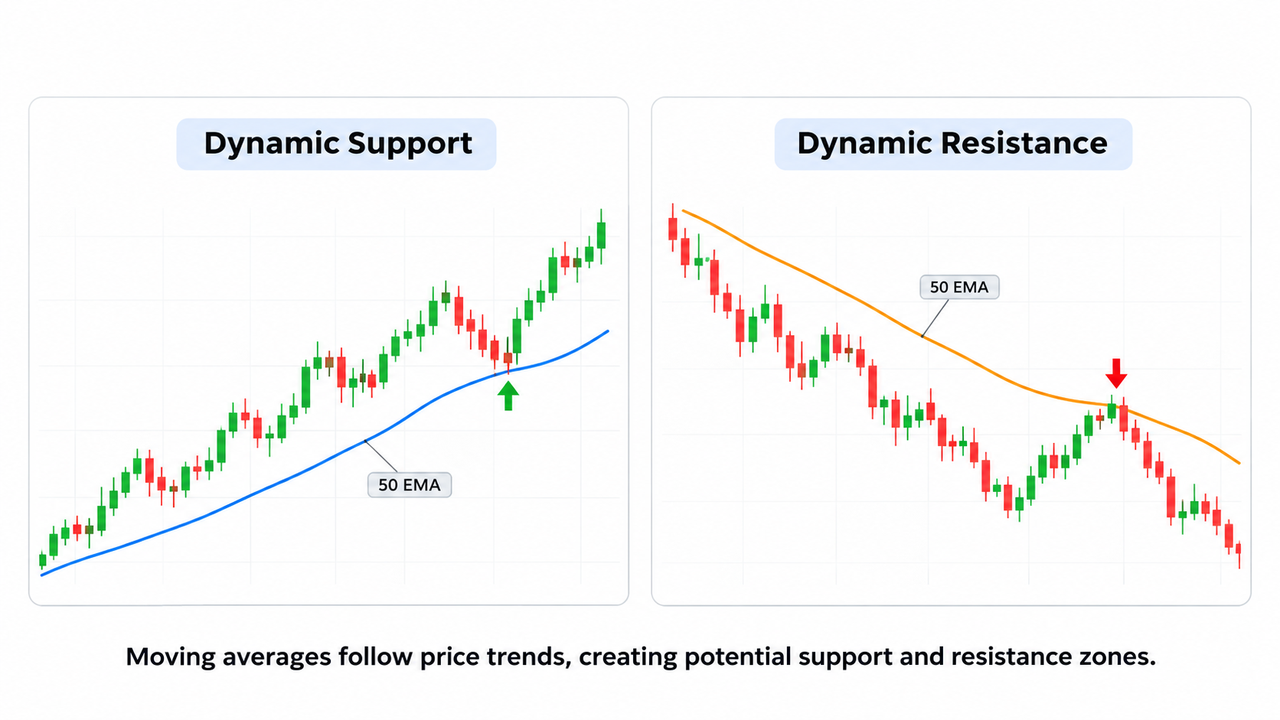
Dynamic support develops when price approaches a rising indicator from above and buyers begin defending the area. Dynamic resistance appears when price approaches a falling indicator from below and sellers limit further advances.
Unlike static support and resistance, which generally follow horizontal levels established through historical data, dynamic levels move continuously.
| Feature |
Static Support and Resistance |
Dynamic Support and Resistance |
| Price level |
Usually fixed |
Changes over time |
| Identification |
Previous highs, lows, horizontal zones |
Moving averages, trend lines |
| Best application |
Range trading, breakout trading |
Trend continuation, pullbacks |
| Main limitation |
Historical levels can become outdated |
Indicator lag and false signals |
According to CME Group's support and resistance education, moving averages, trend lines, and previous price extremes can establish potential support and resistance zones.
These levels reflect market psychology. Traders watch familiar price areas, but no indicator guarantees that buyers or sellers will intervene.
How Moving Averages Create Dynamic Support and Resistance
Moving averages smooth historical closing prices to reveal the underlying market direction.
In an uptrend, price frequently remains above a rising average. Pullbacks toward that average may attract buying interest, making it potential dynamic support.
During a downtrend, the reverse applies. A falling average can behave as dynamic resistance when selling pressure returns during temporary rallies.
Two common technical indicators are:
-
Simple Moving Average (SMA): Calculates the arithmetic average of closing prices across a specified period.
-
Exponential Moving Average (EMA): Assigns greater weight to recent prices, responding more quickly to changing market conditions.
The CME Group explanation of moving averages describes how traders use different periods to observe shorter-term and longer-term support and resistance.
A faster EMA may reveal earlier changes in price behavior, although its sensitivity can produce additional false signals.
Which Moving Averages Help Identify Support?
The appropriate moving average depends on trading style, market volatility, and time frame.
| Moving Average |
Typical Application |
What Traders Watch |
| 20-period |
Short-term momentum |
Shallow pullbacks |
| 50-period |
Intermediate trend |
Deeper corrections |
| 100-period |
Broader trend structure |
Secondary support zones |
| 200-period |
Long-term trend |
Major trend boundaries |
These periods are conventions, not guaranteed support levels.
For example, the EMA 20 indicator may track short-term price changes more closely than the 200-period average.
Day traders sometimes prefer faster averages, while swing traders examine the 50-period and 200-period averages on four-hour or daily charts.
A weighted moving average strategy offers another method of emphasizing recent closing prices.
How to Identify Dynamic Support and Resistance Step by Step
Step 1: Identify the Market Trend
Start with price structure.
Higher highs and higher lows suggest an uptrend. Lower highs and lower lows suggest a downtrend.
Compare this structure with the moving average slope. A rising average supports a bullish interpretation, while a declining average suggests bearish conditions.
Using multiple timeframes in crypto trading helps distinguish short-term fluctuations from broader market direction.
Step 2: Identify Support Near Moving Averages
Look for previous occasions when price approached an average and reversed.
Suppose BTC trades at $68,000 while its rising 50-period EMA stands at $66,500.
Price falls toward $66,500, briefly trades below the average, and closes back above it.
That rejection identifies potential dynamic support. A subsequent higher low provides stronger evidence than the initial touch.
For a practical chart example, traders can observe moving averages, price behavior, and volume on the BTC/USDT spot market on Gate.com.
The prices in this example are hypothetical.
Step 3: Identify Dynamic Resistance
Dynamic resistance follows the opposite process.
In a downtrend, price rallies toward a declining moving average but struggles to close above it.
Upper candle wicks, weak momentum, and renewed selling pressure may indicate resistance.
However, a single rejection doesn't establish a reliable level.
Step 4: Confirm With Price Action and Volume
Moving averages identify potential reaction areas. Confirmation comes from actual market behavior.
Traders commonly examine:
-
Candlestick rejection and closing prices.
-
Increasing volume during rebounds or breakdowns.
-
Higher lows or lower highs near the average.
-
Alignment with historical horizontal levels.
Volume analysis and buying or selling pressure can reveal whether a reaction has meaningful participation.
A moving average overlapping with validated support and resistance levels may deserve attention, although several indicators derived from the same price data aren't independent confirmation.
Dynamic Support and Resistance in Breakout Trading
Breakout trading involves price moving beyond an established support or resistance area.
A clear candle close below a rising moving average can signal weakening bullish momentum. But one close doesn't automatically confirm a trend reversal.
Traders may wait for price to retest the broken average.
If the former dynamic support begins acting as dynamic resistance, the reaction suggests a possible role reversal.
Similarly, a move above declining resistance followed by a successful retest may establish new support.
The same principle applies to horizontal levels: old resistance can become support, while old support can become resistance.
Breakout confirmation using retests can help distinguish sustained price breaks from temporary fluctuations.
How Market Psychology and Fibonacci Levels Affect Moving Averages
Moving averages can attract attention because many market participants monitor similar technical indicators.
Yet their apparent effectiveness also depends on prevailing price trends, order flow, and broader market expectations.
Traders sometimes combine averages with Fibonacci levels such as 38.2%, 50%, and 61.8%.
A 50-period EMA overlapping with a Fibonacci retracement and historical support zone creates an area of technical confluence.
CME Group's Fibonacci education also cautions that these levels require supporting evidence.
Such combinations identify possible reaction zones, not predetermined reversal prices.
Using Dynamic Levels for Entry and Exit Points
Dynamic support and resistance can help organize trading strategies around clear invalidation conditions.
A hypothetical long setup might involve entering after bullish confirmation near a rising 50-period EMA.
The trader could place a protective stop below the relevant swing low, rather than directly on the moving average.
Potential take profit orders may target previous resistance zones, while exit points can also depend on weakening momentum or a confirmed breakdown.
Risk management techniques should account for volatility, stop distance, and position size.
For example, with $100 allocated as maximum planned risk and a $500 difference between entry and stop prices, the theoretical position size is 0.2 BTC, before fees and slippage.
The SEC's investor bulletin on stop orders explains why stop execution prices can differ from stop triggers in securities markets. Similar execution risks exist in crypto.
Common Mistakes When Trading Dynamic Support and Resistance
The most common mistake is treating a moving average as an exact price barrier.
Price can overshoot or undershoot an average before reversing. Some crypto traders may tolerate small deviations, while forex traders might describe similar distances in pips.
Other mistakes include:
-
Using moving averages repeatedly in a sideways market without recognizing whipsaws.
-
Ignoring market news, volume, and sudden changes in liquidity.
-
Assuming every price break signals a new trend.
-
Treating overbought conditions as automatic reversal signals.
-
Placing stops too close to moving averages or ignoring position size.
During range trading, horizontal support and resistance zones may provide clearer reference points than constantly crossing moving averages.
Conclusion
Dynamic support and resistance help traders identify changing price zones through moving averages. The strongest practical application is usually monitoring pullbacks within established trends, then evaluating price action and volume for confirmation.
Moving averages remain lagging indicators. They can support entry and exit planning, but neither historical reactions nor technical signals guarantee future price movements.
FAQ
Which moving average is best for dynamic support and resistance?
The 20 and 50-period moving averages are commonly used for shorter and intermediate trends, while the 100 and 200-period averages provide broader context. The appropriate choice depends on timeframe, volatility, and trading objectives.
Can moving averages become both support and resistance?
Yes. A moving average below price may act as support, while the same average can become resistance after price breaks beneath it. This role reversal requires confirmation through subsequent price behavior.
Are dynamic support levels more reliable than static support?
Neither is consistently superior. Dynamic support can help interpret trending markets, while static horizontal levels may be more useful in sideways conditions. Combining both can reveal overlapping reaction zones.
Does closing below a moving average confirm a downtrend?
No. A close below an average may indicate weakening momentum, but additional evidence such as lower highs, declining volume-adjusted momentum, or failed retests is needed to assess a possible downtrend.
How can traders reduce false signals near moving averages?
Traders can compare multiple timeframes, examine candlestick closes, assess volume, and wait for retests. These filters may reduce some false signals but can also delay entries.
Disclaimer: Moving averages and historical price patterns cannot guarantee future trading results. Crypto trading involves volatility, liquidity risks, and potential capital losses.