For crypto day traders and swing traders, this helps distinguish potential continuation entries from developing reversals. The process combines trend identification, support zones, market structure and risk management, although no combination eliminates false signals.
Key Takeaways
-
Start with the higher timeframe to establish the primary trend before evaluating pullbacks.
-
Use an intermediate timeframe to identify key support and monitor retracement structure.
-
Confirm potential trend resumption through lower timeframe price action, momentum and volume.
-
Plan entries around structural invalidation levels rather than assuming every dip will recover.
-
Timeframe alignment improves decision-making context but cannot guarantee trading outcomes.
Why Multi Timeframe Analysis Matters for Pullbacks
A pullback is a temporary move against an established trend. In a bullish trend, price retreats before potentially continuing higher. In a bearish trend, the equivalent movement is a temporary rally.
The difficulty is determining whether that countertrend movement remains temporary.
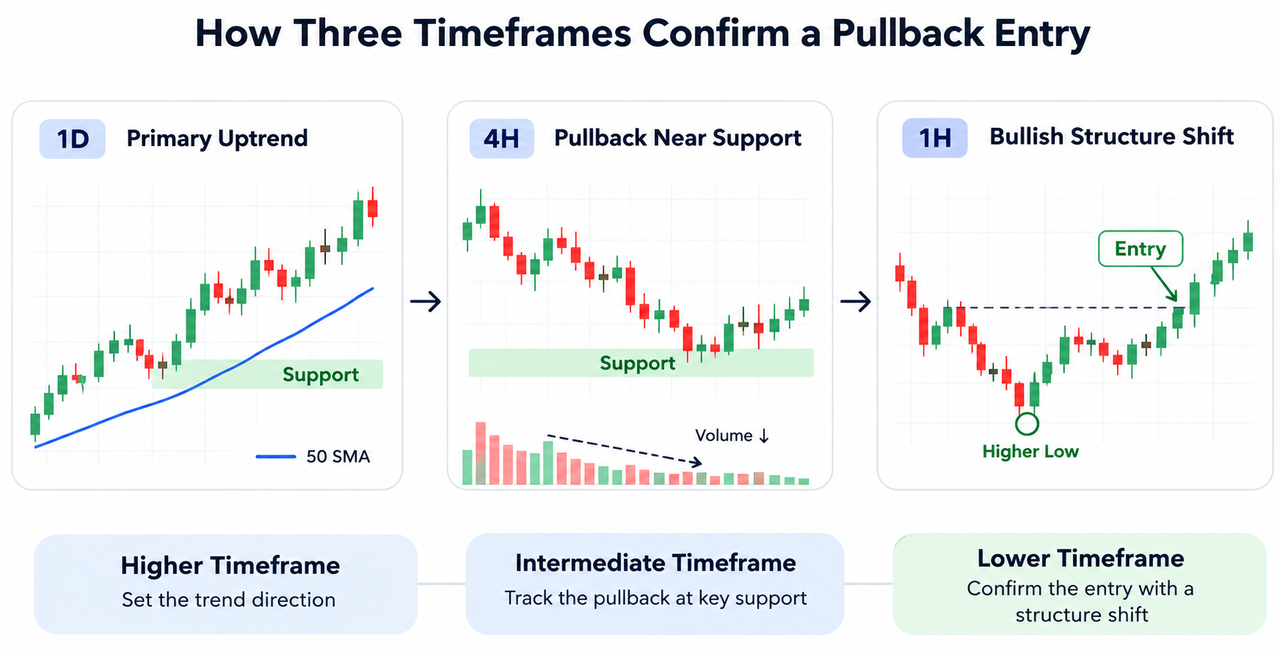
Multi timeframe analysis compares price behavior across different trading timeframes. The higher timeframe establishes broader market direction, the intermediate timeframe tracks the retracement, and the lower timeframe identifies possible entry and exit points.
This top-down approach helps traders avoid treating every short-term bullish signal as a buying opportunity.
A basic multiple timeframe analysis framework establishes directional context. Pullback confirmation goes further by requiring evidence that the retracement is ending before considering an entry.
A practical multi timeframe trading strategy uses three charts with distinct responsibilities.
| Timeframe |
Swing Trading |
Intraday Trading |
Main Purpose |
| Higher timeframe |
Weekly chart |
4-hour chart |
Identify primary trend |
| Intermediate timeframe |
Daily chart |
1-hour chart |
Locate pullback zones |
| Lower timeframe |
4-hour chart |
15-minute chart |
Fine tune entries |
A common starting convention is a ratio of approximately 4–6 between adjacent timeframes, although this isn't mandatory.
For example, a daily chart, 4-hour chart and 1-hour chart provide a relatively consistent hierarchy. The weekly-daily-4-hour combination is another practical option for longer holding periods.
The trading style determines which time frames matter. Day trading prioritizes shorter price movements, while swing traders need enough higher timeframe context to avoid reacting to ordinary volatility.
Analyze Market Structure on the Daily Chart
Market structure shows whether buyers or sellers continue controlling the larger trend.
In an uptrend, successive higher highs and higher lows indicate a bullish structure. A pullback becomes interesting when price approaches established support without breaking the swing low that defines the broader trend.
Traders can identify key support using previous breakout zones, horizontal support and resistance levels, a rising trend line or a key moving average.
The 20-period simple moving average (SMA) sometimes acts as dynamic support during a trending market. The 50-period average may provide slower-moving context. Neither is a guaranteed floor.
Validating support and resistance levels requires examining previous reactions and trading volume rather than relying on a single line.
Fibonacci retracement levels, including 38.2% and 61.8%, can identify additional areas to monitor. These levels don't predict future price movements independently.
Track Pullback Health on the Hour Chart
Once the higher timeframe direction is established, the intermediate chart helps determine whether the countertrend move is losing strength.
A relatively orderly bullish pullback may produce overlapping candles, decreasing downside momentum and lighter volume. However, falling volume alone doesn't establish that selling has finished.
A decline accompanied by accelerating volume, repeated bearish closes and broken major support suggests stronger selling pressure.
Comparing buying and selling pressure through price and volume helps separate an ordinary correction from a possible structural breakdown.
The relative strength index (RSI) can indicate weakening bearish momentum. Moving average convergence divergence (MACD) may provide further confirmation when its negative histogram contracts or a bullish crossover develops.
These technical indicators should support market structure, not replace it.
Use Lower Timeframe Market Structure to Fine Tune Entries
A potential pullback entry requires more than price reaching support.
On the short-term chart, traders can look for a shift from lower lows and lower highs toward a higher low followed by a break above a recent minor swing high.
This change suggests that short-term buying pressure is returning.
Three observations strengthen the setup:
-
Price reacts positively near a higher timeframe support zone.
-
A lower timeframe candle closes above a meaningful minor swing high.
-
Momentum or volume improves as the move develops.
A bullish signal from RSI, MACD or VWAP can contribute to confirmation. In intraday trading, reclaiming the volume-weighted average price may indicate improving session strength, depending on how VWAP is anchored.
Waiting for a completed candle and assessing a breakout retest before entry can reduce premature entries. The tradeoff is a later entry point.
Practical Example: Multi Time Frame Analysis of BTC/USDT
Consider a hypothetical BTC/USDT setup.
The daily timeframe shows an established uptrend, with Bitcoin trading above its rising 50-day moving average. Price then retreats from $100,000 toward a previous support zone around $96,000.
On the 4-hour chart, selling momentum weakens. RSI stabilizes, and trading volume contracts during the decline.
The 1-hour chart subsequently forms a higher low and breaks above a minor resistance level at $97,000.
A trader examining the BTC/USDT market on Gate.com could compare the daily trend, 4-hour retracement and hourly confirmation using the same historical period.
The proposed entry is near $97,000, with structural invalidation at $95,500. A hypothetical target of $100,000 creates $3,000 of potential upside against $1,500 of planned downside, or a 2:1 reward-to-risk ratio before fees and slippage.
This is an illustrative calculation, not a price forecast or recommendation.
Adapt the Trading Plan to Market Conditions
Timeframe alignment becomes less reliable when financial markets are moving sideways.
A range-bound market can repeatedly generate bullish crossovers without producing trend continuation. Strong bearish momentum on the daily timeframe can also overwhelm a bullish signal on the hour chart.
Traders should therefore distinguish a temporary retracement from a possible trend reversal. A decisive break of higher timeframe support may invalidate the original bullish thesis.
Risk management also requires planning for execution uncertainty. Stop orders can execute away from their trigger prices during volatile markets, as FINRA explains.
Technical analysis identifies conditional trading opportunities; it cannot forecast future price movements reliably in every market environment. The SEC's discussion of historical performance similarly cautions against treating past outcomes as predictions.
Conclusion
Multiple timeframe trading confirms potential pullbacks by aligning a dominant trend, an intermediate retracement and a lower timeframe structure shift.
The most useful confirmation comes when price respects higher timeframe support and buyers regain control on the execution chart. Traders still need a defined invalidation point, realistic reward-to-risk assumptions and awareness that a pullback can develop into a larger reversal.
FAQ
What is the best timeframe combination for confirming pullbacks?
The daily, 4-hour and 1-hour charts form one practical combination. Intraday traders may prefer 4-hour, 1-hour and 15-minute charts. The appropriate combination depends on holding period and market volatility.
Can multiple timeframe trading reduce false signals?
Comparing trend direction, support and lower timeframe confirmation can filter some false signals. However, correlated indicators and unexpected market movements can still produce losses.
How do traders distinguish a pullback from a reversal?
A pullback generally preserves the higher timeframe trend structure. A reversal becomes more plausible when significant swing levels break and opposing momentum strengthens.
Is RSI or MACD better for pullback confirmation?
RSI helps assess momentum exhaustion, while MACD tracks changes in trend momentum. Neither is consistently superior; both depend on price structure and market conditions.
Does timeframe alignment guarantee a profitable entry?
No. Even aligned trading signals can fail because of liquidity changes, volatility, unexpected news or broader market reversals.
Disclaimer: Cryptocurrency trading involves substantial risk, and technical indicators cannot guarantee future performance.