For crypto traders evaluating trend continuation or possible reversals, understanding how volume changes alongside price can improve trading decisions. Below are nine indicators, their signals, and practical applications. No single indicator reliably predicts future price movements.
Key Takeaways
-
Volume indicators assess market participation, helping determine whether price movements have meaningful trading activity behind them.
-
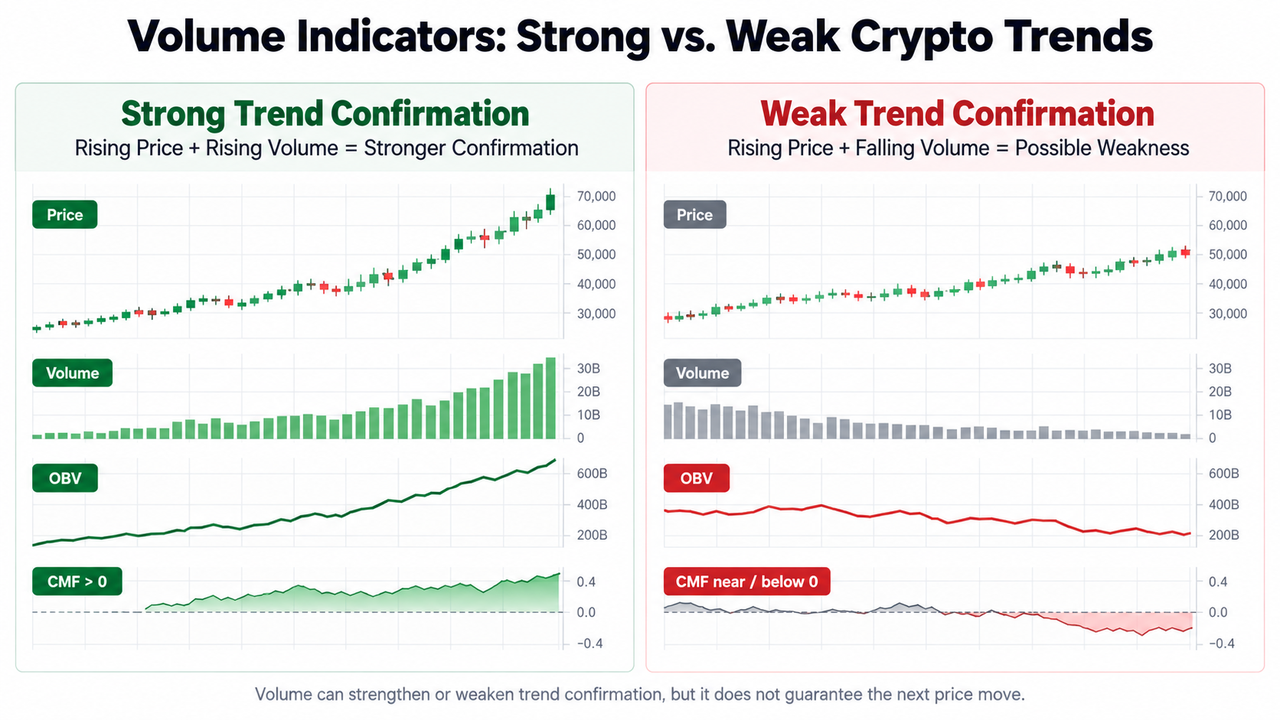
Rising prices accompanied by increasing volume generally support an upward trend, while weak volume raises questions about its strength.
-
OBV, MFI, and Chaikin Money Flow measure different aspects of buying and selling pressure.
-
VWAP and Volume Profile identify average price levels and high-volume zones useful for evaluating market structure.
-
Combining volume confirmation with momentum indicators, price action, and risk management can reduce reliance on misleading signals.
What Are Volume Indicators in Crypto Trading?
Volume indicators are technical analysis tools that use trading volume, or combined price and volume data, to evaluate market strength, participation, and potential trend changes.
Trading volume represents the quantity of an asset traded during a specific period. High trading volume indicates significant activity from buyers and sellers, although it doesn't establish which side will control subsequent price movements.
Consider three common situations:
-
Rising price with rising volume: Suggests stronger buying participation and supports a bullish trend.
-
Falling price with rising volume: Indicates increased activity during a decline and may reflect selling pressure.
-
Rising price with low volume: May suggest weak conviction, particularly near resistance.
These observations become more useful alongside trend indicators and momentum indicators, which measure market direction and the strength of price changes.
9 Best Volume Indicators for Crypto Trading
The following indicators cover four distinct purposes: confirming trends, measuring money flow, identifying important price levels, and tracking market participation.
| Volume Indicator |
Primary Function |
Best Application |
| Standard Volume + Moving Average |
Compares volume with historical activity |
Breakout confirmation |
| Relative Volume (RVOL) |
Measures unusual trading activity |
Volume spikes |
| On-Balance Volume (OBV) |
Tracks cumulative directional volume |
Trend confirmation |
| Money Flow Index (MFI) |
Combines price and volume momentum |
Potential reversals |
| Chaikin Money Flow (CMF) |
Measures accumulation and distribution |
Buying pressure |
| VWAP |
Calculates volume-weighted average price |
Intraday trend bias |
| Volume Profile |
Maps volume across price levels |
Support and resistance |
| Cumulative Volume Delta (CVD) |
Tracks aggressive buying versus selling |
Order flow analysis |
| Negative Volume Index (NVI) |
Tracks price changes during lower-volume periods |
Secondary trend confirmation |
-
Standard Volume With Moving Average: Confirming High-Volume Breakouts
Standard Volume displays trading activity as histogram bars, while a Volume Moving Average smooths activity over a specific period.
A common setup uses a 20-period moving average. Volume significantly exceeding this baseline suggests unusually high market participation.
For example, a Bitcoin breakout above key resistance accompanied by volume twice its recent average provides stronger confirmation than a price jump on weak volume.
However, volume spikes can also occur during liquidation events or temporary volatility.
-
Relative Volume (RVOL): Measuring Market Participation
Relative Volume compares current volume with historical average volume.
RVOL = Current Volume / Average Volume
An RVOL reading of 2.0 means trading activity is twice the selected historical average. A reading below 1.0 indicates below-average participation.
According to TradingView's Relative Volume methodology, the calculation compares volume with a moving average of previous periods.
Crypto traders can use RVOL to identify unusually active breakouts without assuming every volume spike represents sustained demand.
-
On-Balance Volume (OBV): Tracking Buying and Selling Pressure
On-Balance Volume tracks cumulative volume based on closing price direction.
The indicator adds volume when the closing price rises, subtracts volume when it falls, and remains unchanged when consecutive closing prices match.
If Bitcoin makes higher highs while OBV also rises, volume supports the upward trend.
When price makes new highs but OBV declines, the divergence can signal weakening participation.
Unlike the price volume trend indicator, which weights volume changes by percentage price movement, OBV counts the entire period's volume according to price direction.
-
Money Flow Index (MFI): Combining Price and Volume Momentum
The Money Flow Index is a momentum indicator combining typical price and trading volume.
Typical price equals the average of the high, low, and closing prices. MFI uses positive and negative money flow to produce readings between 0 and 100.
Common interpretations include:
-
Above 80: Potentially overbought conditions.
-
Below 20: Potentially oversold conditions.
-
Price-MFI divergence: Possible weakening momentum.
Unlike the Relative Strength Index, MFI incorporates volume directly.
Overbought conditions can persist during strong trends, so an extreme reading isn't automatically a reversal signal.
-
Chaikin Money Flow (CMF): Evaluating Market Strength
Chaikin Money Flow evaluates accumulation and distribution using closing prices relative to their trading ranges, weighted by volume.
The indicator generally fluctuates around a zero line.
-
Positive reading: Suggests accumulation based on closing-price position and volume.
-
Negative reading: Suggests distribution.
-
Zero-line crossings: May indicate changing buying or selling pressure.
A sustained positive CMF during an upward trend strengthens the accumulation interpretation.
The CMF and MFI comparison illustrates why their signals may differ despite both incorporating money flow.
-
VWAP: Finding the Average Price Weighted by Volume
Volume Weighted Average Price measures the average traded price weighted by volume during a selected session.
VWAP = Cumulative (Typical Price × Volume) / Cumulative Volume
Prices above VWAP often indicate a stronger intraday trading position relative to that benchmark, while prices below VWAP suggest weakness.
For example, a trader examining the BTC/USDT spot market on Gate.com can compare price action with a session-based VWAP to assess intraday direction.
Crypto trades continuously, making the selected VWAP reset time particularly important.
-
Volume Profile: Identifying High-Volume and Low-Volume Zones
Volume Profile displays trading volume at specific price levels instead of distributing it across time.
Its principal components include:
-
High-volume nodes: Price levels associated with substantial historical trading.
-
Low-volume nodes: Areas showing relatively limited trading activity.
-
Point of Control: The price level containing the highest volume.
-
Value Area: A price range containing a selected share of total volume, commonly 70%.
These features help traders identify potential support, resistance, and market acceptance zones.
The Volume Profile methodology also distinguishes volume allocation from actual buyer-initiated and seller-initiated transactions.
High-volume zones aren't guaranteed to hold as support or resistance.
-
Cumulative Volume Delta (CVD): Measuring Aggressive Order Flow
Cumulative Volume Delta measures the running difference between aggressive buying and selling volume.
CVD = Previous CVD + (Aggressive Buy Volume − Aggressive Sell Volume)
Rising CVD indicates greater aggressive buying activity, while declining CVD suggests stronger aggressive selling.
For instance, rising prices alongside falling CVD may indicate weakening aggressive buying participation.
Data limitations matter. Some chart implementations estimate delta from lower-timeframe price movements rather than actual trade-side classifications. This makes the distinction between net volume and volume delta especially relevant.
-
Negative Volume Index (NVI): Analyzing Low-Volume Price Trends
The Negative Volume Index updates when current volume falls below the previous period's volume.
It applies percentage price changes to its cumulative value during these lower-volume periods.
The Positive Volume Index follows similar logic but updates when trading volume increases.
Traders sometimes compare NVI with a long-term moving average to assess broader trends. However, its traditional interpretations originated in stock market analysis and aren't automatically reliable in cryptocurrency markets.
How to Combine Volume Indicators to Confirm Crypto Trends
A practical volume confirmation process begins with price structure.
Suppose Ethereum breaks above resistance. A trader might evaluate whether:
-
Relative Volume exceeds its historical average.
-
OBV moves upward alongside price.
-
CMF remains positive.
-
Price maintains the breakout level rather than immediately reversing.
Combining price action trading strategies with volume confirmation can help identify weak setups.
Avoid stacking indicators that measure nearly identical inputs. Different calculations don't necessarily provide independent confirmation.
Limitations of Volume Indicators
Crypto volume analysis has several limitations.
First, reported trading volume may be inflated through wash trading or other manipulative activity. SEC filings discussing digital asset market risks identify this concern.
Second, exchange-level data covers activity on a particular venue rather than the entire cryptocurrency market. Low-liquidity tokens are especially vulnerable to misleading volume spikes and sudden price changes.
Finally, high volume can accompany both trend continuation and reversals. Volume tools help assess participation, but they cannot eliminate false breakouts or substitute for position sizing and risk control.
Conclusion
The best volume indicators depend on the trading decision. OBV and CMF help assess trend strength, Relative Volume identifies unusual participation, MFI evaluates momentum, and VWAP or Volume Profile adds price context.
For reliable interpretation, compare volume with price direction, liquidity, and market structure. Strong participation improves the evidence behind a trend without guaranteeing its continuation.
FAQs
What is the best volume indicator for crypto trading?
On-Balance Volume is a useful starting point for trend confirmation because it tracks cumulative volume according to closing-price direction. Relative Volume is particularly helpful for evaluating breakout activity.
Does high volume always mean crypto prices will rise?
No. High volume reflects increased trading activity from buyers and sellers. Rising volume during falling prices can indicate selling pressure, liquidation activity, or a developing reversal.
How does low volume affect crypto trading signals?
Low volume during price increases may indicate limited market participation. In thin markets, relatively small trades can move prices substantially, making breakouts less reliable.
Can volume indicators predict crypto price reversals?
Volume divergence and unusual volume spikes can suggest potential reversals, but they cannot predict them consistently. Confirmation from price structure and momentum indicators remains useful.
Which volume indicators work best together?
Relative Volume and OBV form a straightforward combination for evaluating breakout participation and cumulative directional volume. Volume Profile can add support and resistance context, while MFI contributes price-volume momentum.
Disclaimer
This content is for educational purposes only and does not constitute financial or investment advice. Volume indicators can produce false signals, and historical market behavior does not guarantee future results. Cryptocurrency trading involves substantial risk, including volatility, liquidity constraints, and potential capital loss.







