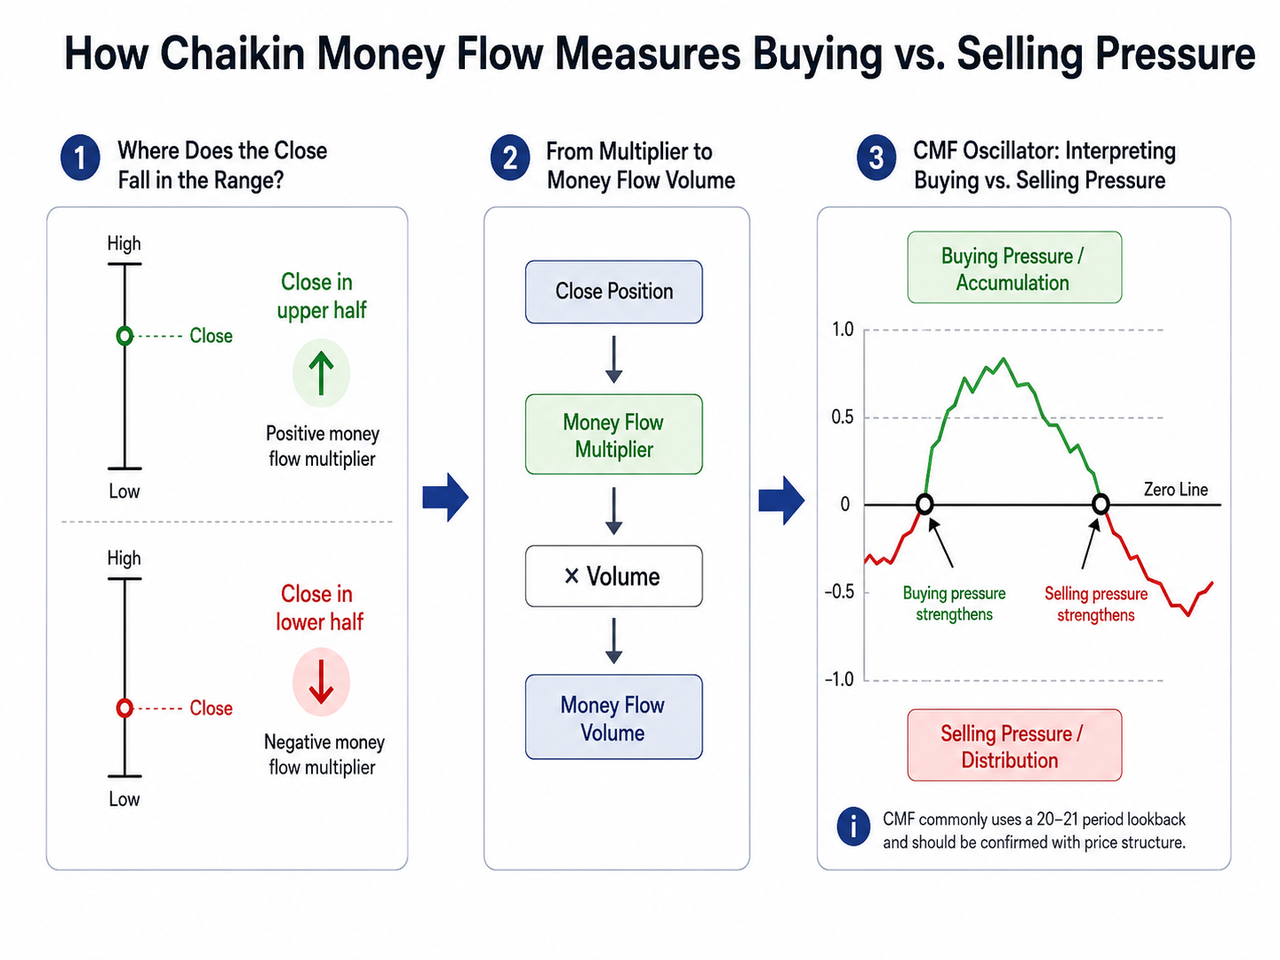
Chaikin Money Flow (CMF) is a volume-weighted technical analysis indicator that measures buying pressure and selling pressure by combining an asset’s closing price with trading volume over a set period. Developed by Marc Chaikin, the CMF indicator typically uses a 20- or 21-period lookback and fluctuates above and below a zero line. Positive CMF points to net buying pressure, while negative CMF points to net selling pressure.
For traders trying to determine whether price action has real volume support, that distinction matters. CMF can help confirm a breakout, question a weakening trend, or highlight divergence between price and money flow. It doesn’t predict where price must go next, though, and choppy markets can generate false signals.
Key Takeaways
Chaikin Money Flow combines price and volume to estimate accumulation and distribution.
CMF above zero generally represents buying pressure; CMF below zero represents selling pressure.
A zero line cross can signal a change in the balance between buyers and sellers.
Positive CMF during a price breakout can strengthen volume confirmation, while divergence can warn that price and money flow are no longer aligned.
CMF works best in conjunction with price structure and other indicators rather than as a standalone buy or sell signal.
What Is Chaikin Money Flow Indicator?
Chaikin Money Flow is an oscillator designed to measure how strongly volume is associated with closes near the high or low of each trading period. The basic idea is straightforward: a particular security repeatedly closing in the upper half of its range on high volume suggests accumulation, while repeated closes in the lower half suggest distribution.
Unlike On-Balance Volume, which adds or subtracts volume according to whether price rose or fell, CMF considers where the closing price sits inside each period’s high-low range. The Accumulation/Distribution indicator uses a closely related Money Flow Multiplier but builds a cumulative line instead.
CMF technically ranges between -1 and +1, although values near either extreme are rare. In practice, readings commonly fluctuate between roughly -0.50 and +0.50.
Calculating Chaikin Money Flow
Calculating Chaikin Money Flow starts by determining where each close occurred within its trading range.
Money Flow Multiplier:
[(Close − Low) − (High − Close)] ÷ (High − Low)
The multiplier is positive when the close falls in the upper half of the range and negative when it finishes in the lower half. A close at the midpoint produces a value around zero.
CMF = n-period Sum of Money Flow Volume ÷ n-period Sum of Volume
A 21-day period is a common default, although some charting systems use 20 periods.
These steps explain why high volume matters. A strong positive multiplier multiplied by high volume contributes more positive money flow than the same price position on low volume.
How the CMF Indicator Works Around the Zero Line
The zero line represents the balance point between buying and selling pressure.
CMF Reading
Common Interpretation
Above 0
Buying pressure dominates
Below 0
Selling pressure dominates
Crosses above 0
Buying pressure is strengthening
Crosses below 0
Selling pressure is strengthening
Near 0
Buying and selling pressure are relatively balanced
A rising positive CMF during an upward price move suggests buyers are supporting the trend with volume. Conversely, negative CMF while price continues to rise can indicate that the advance has weaker money flow support.
A zero line cross isn't automatically a reversal signal. CMF may repeatedly cross zero when the market is moving sideways, creating whipsaws rather than a sustained change in trend.
Buying Pressure, Selling Pressure and Divergence
CMF becomes particularly useful when compared directly with price.
Suppose price breaks above resistance while CMF is positive and rising. The combination suggests that the breakout is accompanied by accumulation rather than price movement alone. Fidelity similarly describes positive CMF as a way of confirming an upside breakout.
The opposite relationship can also matter. If price reaches a higher high while CMF makes a lower high, the bearish divergence suggests buying pressure is weakening. A bullish divergence occurs when price falls to a lower low while CMF forms a higher low.
For a live crypto example, a trader could examine the BTC/USDT market on Gate.com, compare CMF with support and resistance, and then check whether volume-weighted money flow agrees with the apparent price trend. Gate's spot interface includes candlestick charts and trading-pair information that can provide the price and volume context needed for this type of analysis.
Chaikin Money Flow vs. Money Flow Index and Chaikin Oscillator
CMF shouldn't be confused with the Money Flow Index. MFI combines typical price and volume and normalizes the result on a 0–100 scale, whereas CMF evaluates accumulation and distribution around a zero line.
The Chaikin Oscillator is different again. It calculates the difference between short- and longer-term exponential moving averages of the Accumulation/Distribution Line, while CMF sums Money Flow Volume over a fixed lookback period.
Limitations of the Chaikin Money Flow Indicator
CMF can produce false signals during highly volatile or choppy price action. Repeated zero-line crosses may look meaningful without developing into a durable trend.
Significant price gaps are another limitation because CMF evaluates the closing price relative to the current period’s high-low range rather than fully incorporating the relationship with the previous close. As a result, money flow can sometimes disconnect from the apparent price move.
Using CMF alongside trend, momentum or volatility tools can add context. For example, ADX measures trend strength, while ATR measures absolute volatility. CMF answers a different question: is volume-weighted buying or selling pressure supporting what price appears to be doing?
Conclusion
Chaikin Money Flow measures the balance of volume-weighted buying and selling pressure by examining where each period closes within its range and weighting that position by volume. Positive readings indicate accumulation pressure; negative readings indicate distribution pressure.
Its strongest use is confirmation. CMF can support a breakout, expose weakening money flow during an existing trend, or flag divergence between price and volume. But zero-line crosses and divergences aren't guarantees. Market structure, volatility and other technical indicators still matter, and past performance doesn't determine future results.
FAQ
What does a positive Chaikin Money Flow indicate?
A positive CMF indicates that buying pressure has dominated selling pressure over the selected lookback period. The interpretation becomes stronger when positive CMF aligns with rising price or an upside breakout.
What does a negative CMF indicate?
Negative Chaikin Money Flow means volume has been weighted more heavily toward closes in the lower half of trading ranges. That is commonly interpreted as selling or distribution pressure.
What is the standard CMF period?
Twenty to 21 periods are commonly used. Fidelity identifies 21 days as the standard period, while some charting implementations default to 20 periods.
What happens when CMF crosses above zero?
A cross above the zero line indicates that the balance of money flow has shifted toward buying pressure. Traders often look for confirmation from price structure rather than treating the cross itself as an automatic buy signal.
Is Chaikin Money Flow the same as the Money Flow Index?
No. CMF measures accumulation and distribution around a zero line, while MFI uses price and volume to create a bounded 0–100 momentum oscillator. The two indicators therefore measure related but different aspects of market activity.
Can Chaikin Money Flow predict price reversals?
CMF can identify divergence or changing buying and selling pressure that may precede a reversal, but it cannot reliably predict one on its own. False signals and whipsaws are possible, particularly in volatile or sideways markets.
Disclaimer:This content is for educational purposes only and does not constitute investment advice. Technical indicators use historical market data and cannot guarantee future price movements.
Author: Jared
Disclaimer
* The information is not intended to be and does not constitute financial advice or any other recommendation of any sort offered or endorsed by Gate.
* This article may not be reproduced, transmitted or copied without referencing Gate. Contravention is an infringement of Copyright Act and may be subject to legal action.
DEX aggregators integrate order data, price information, and liquidity pools from multiple decentralized exchanges, helping users find the optimal trading path in the shortest time. This article delves into 8 commonly used DEX aggregators, highlighting their unique features and routing algorithms.
The report shows that in Q1 2026, the crypto market will reach a stage of structural maturity, with Derivative trading making up more than 90% of total trading volume, exceeding $20 trillion. As Spot demand weakens, liquidity will become even more concentrated in top exchanges, reflecting a more cautious market sentiment and a shift toward leveraged and institutional trading.