That difference matters for traders trying to understand who is pushing the market right now. Volume Delta can reveal aggressive buyers, aggressive sellers, absorption, and delta divergences that ordinary directional volume may miss. The catch is data quality. Accurate Volume Delta requires sufficiently detailed trade data, while Net Volume is easier to calculate and widely available.
For short-term traders, the practical question isn't necessarily which indicator should replace the other. It's which one answers the question being asked.
Key Takeaways
-
Volume Delta is usually more informative for order flow analysis because it measures the imbalance between aggressive buy and sell executions.
-
Net Volume is better suited to broad volume confirmation, showing whether volume associated with upward or downward price movement is dominant.
-
Volume Delta = Ask Volume − Bid Volume under a common convention, while Cumulative Volume Delta adds those delta values over time.
-
Delta can expose absorption, exhaustion, and divergence, but it depends heavily on accurate trade classification and shouldn't be treated as a standalone signal.
-
Using Net Volume with Volume Delta can separate two useful questions: “Is participation strong?” and “Which aggressor side is driving it?”
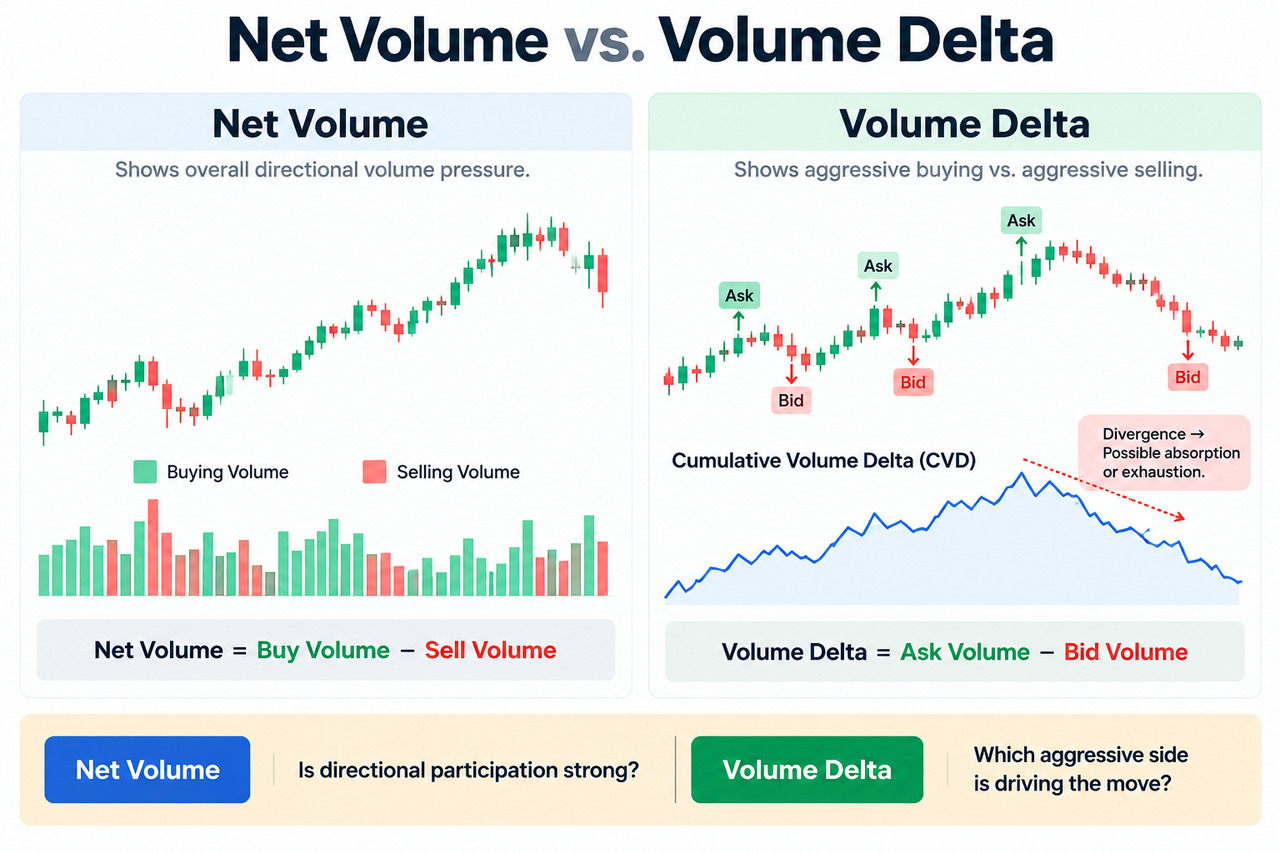
Net Volume vs. Volume Delta: Which Is Better for Order Flow Trading?
The main distinction is how buying and selling pressure is classified.
Net Volume measures directional trading activity, typically comparing volume associated with rising prices against volume associated with falling prices. It gives traders a relatively simple way to judge whether volume confirmation favors upward or downward price action.
Volume Delta goes deeper into trade execution. A common calculation is:
Volume Delta = Volume executed at the ask − Volume executed at the bid
Trades executed against the offer price are generally interpreted as aggressive buying because buyers crossed the spread to obtain immediate execution. Trades hitting the bid indicate aggressive selling.
This is why Volume Delta is usually the stronger order flow indicator. It focuses on initiative rather than simply associating volume with price direction.
| Feature |
Net Volume |
Volume Delta |
| Main purpose |
Directional volume confirmation |
Aggressive order-flow analysis |
| Measures |
Up-volume vs. down-volume |
Ask volume vs. bid volume |
| Data requirement |
Standard volume/price data |
Detailed execution data |
| Main strength |
Simple trend and breakout confirmation |
Shows aggressor imbalance |
| Divergence analysis |
Useful |
More granular |
| Main weakness |
Can hide absorption |
Highly dependent on data quality |
| Best role |
Confirmation |
Order-flow interpretation |
Regular volume answers another useful question: how much activity occurred? CME Group defines futures volume as the number of contracts traded during a given period and notes that volume can help identify price levels attracting market interest.
High total volume can therefore confirm that significant participation exists, but volume alone doesn't tell traders which side initiated those executions.
How Does Volume Delta Work?
Volume Delta examines buying versus selling aggression within a bar or another measurement interval.
Suppose a one-minute BTC bar contains:
The net delta is:
720 − 470 = +250 BTC
That positive Volume Delta indicates greater aggressive buying during the period. If bid-side selling were 800 BTC and ask-side buying 500 BTC, the delta would instead be −300 BTC, indicating greater aggressive selling.
Positive delta doesn't guarantee that price will rise. That's one of the most important points in order flow trading.
Imagine aggressive buyers repeatedly lifting the offer, producing strongly positive delta, yet price can't break resistance. Passive sellers may be absorbing those market buys with limit sell orders. The buying pressure is real, but the resulting price movement is weak.
That mismatch can reveal information Net Volume may obscure.
Cumulative Volume Delta and the CVD Indicator
Cumulative Volume Delta (CVD) converts individual delta bars into a running total:
CVD = Previous CVD + Current Volume Delta
A rising CVD means aggressive buying has exceeded aggressive selling over the selected period. A falling CVD shows the opposite.
The Cumulative Volume Delta indicator is particularly useful because individual lower-timeframe bars can be noisy. Cumulative delta makes the broader imbalance easier to see.
For example, price and CVD rising together can confirm trend strength. Price rising while CVD progressively falls tells a different story: the market is making higher prices even though aggressive buying is weakening.
CVD shouldn't be confused with Open Interest. Open Interest measures outstanding derivatives positions, while CVD tracks aggressive execution flow. Together, they can help distinguish participation from positioning.
Bullish Divergence, Bearish Divergence and Delta Divergences
Delta becomes especially interesting when it disagrees with price action.
Bullish Divergence
A bullish divergence may occur when price makes a lower low while CVD or net delta makes a higher low.
Aggressive sellers are still present, but their pressure isn't expanding with the new price low. Depending on market structure, that can be an early sign of seller exhaustion or passive buyers absorbing supply.
It isn't automatic proof of a major reversal.
Bearish Divergence
A bearish divergence can appear when price makes a higher high while CVD makes a lower high.
Price continues upward, but aggressive buying is losing strength. Traders may interpret that as buyer exhaustion, particularly around a major resistance or previous session high.
The value of these delta divergences comes from combining them with price levels. Session highs and lows, for example, can provide the structural location while delta indicates what aggressive market participants are doing around that level.
Does Volume Delta Reveal Absorption and Exhaustion?
Volume Delta can help identify both, though neither should be diagnosed from delta alone.
Absorption occurs when aggressive orders meet enough passive liquidity that substantial trading produces relatively little price movement.
Suppose BTC repeatedly trades at the offer and delta becomes strongly positive, yet price remains below resistance. Aggressive buying is present, but sellers are absorbing it. If price eventually breaks, buyers may have overwhelmed that liquidity. If buying weakens first, the failed push can become more important.
Exhaustion is different. It describes declining willingness to continue trading aggressively at new price extremes. Price may reach another high while positive delta weakens or CVD fails to confirm it.
CME's description of a central limit order book helps explain the distinction: bid and ask quantities represent resting buying and selling interest at different price levels, while executed volume records completed trades.
That distinction between passive liquidity and aggressive execution sits at the heart of real order flow analysis.
Net Volume Still Has an Important Role
Volume Delta's extra detail doesn't make Net Volume obsolete.
Net Volume works well when the goal is straightforward volume confirmation. A trader watching a breakout above key resistance might first ask whether participation expanded in the direction of the price break.
For example, daily highs and lows can define potential support and resistance. A price break accompanied by strongly positive Net Volume suggests increased upward directional participation.
A trader could then inspect Volume Delta to ask a second question: was that activity actually accompanied by aggressive buyers crossing the offer?
This two-stage approach prevents traders from asking one indicator to answer everything.
Similarly, VWAP measures intraday price relative to volume-weighted value, not aggressor behavior. Price above VWAP, positive Net Volume, and rising CVD together describe three different aspects of the same move: price location, directional participation, and aggressive execution.
Volume Delta in Futures Markets
Volume Delta has particularly strong roots in futures markets, where centralized exchange feeds can provide detailed transaction and order-book data.
CME Group's Market by Order data, for example, exposes individual order sizes, queue positions, and full order-book depth rather than only consolidated price-level data.
Crypto is more complicated because trading is fragmented across exchanges. A CVD indicator calculated from one venue represents order flow from that venue, not necessarily the entire crypto market.
That makes the data source important. Two platforms can produce different CVD readings when their trade feeds, aggregation rules, classification methods, or included exchanges differ. Volume Delta is therefore more sensitive to data quality than Net Volume.
For a practical market example, a trader using BTC/USDT on Gate.com can compare price, regular volume, trades and order-book behavior with a Volume Delta or CVD implementation. The purpose isn't to let one delta bar dictate a trading decision; it's to see whether execution behavior supports the price structure visible on the chart.
How to Manage Risk When Using the CVD Indicator
Order flow can reveal useful pressure beneath price, but it doesn't remove uncertainty.
A simple workflow is:
-
Start with price structure. Mark key support, resistance, session extremes, or breakout levels.
-
Check regular volume or Net Volume. Is participation expanding as price reaches the level?
-
Inspect Volume Delta or CVD. Are aggressive buyers or sellers supporting the move?
-
Look for disagreement. Divergence, absorption, or exhaustion can provide an early warning that price and order flow aren't aligned.
-
Manage risk from price, not from conviction. Define invalidation before acting on an order-flow interpretation.
A Session High/Low versus VWAP framework can also combine location with intraday value, while delta supplies the execution layer.
False signals remain possible. Aggressive buyers can dominate delta and still lose against large passive sellers. Divergence can persist while price continues trending. On lower timeframe bars, rapidly alternating positive and negative delta can simply reflect noise.
Conclusion
For Net Volume vs. Volume Delta, Volume Delta is generally the more precise tool for order flow trading because it separates aggressive buying from aggressive selling and can expose absorption, exhaustion, and divergence that broader directional volume may miss.
Net Volume has a different advantage: simplicity. It can quickly show whether directional participation supports a breakout, trend, or price move without requiring the same level of tick or execution data.
In practice, they work well together. Net Volume asks whether meaningful directional activity is present. Volume Delta asks which aggressive side is producing that activity. Cumulative Volume Delta then shows whether that imbalance is building or fading over time.
None of them should replace price structure or risk management. Order flow provides evidence about what market participants are doing; it doesn't guarantee what price will do next.
FAQ
Is Volume Delta better than Net Volume?
For detailed order flow analysis, generally yes. Volume Delta distinguishes aggressive buying from aggressive selling, while Net Volume provides a broader directional volume reading. Net Volume can still be useful for confirming participation.
What is Cumulative Volume Delta?
Cumulative Volume Delta is the running total of successive Volume Delta values. Rising CVD indicates net aggressive buying over the measurement period, while falling CVD indicates net aggressive selling.
Does Volume Delta predict price movements?
No. Positive delta shows aggressive buying and negative delta shows aggressive selling, but passive liquidity can absorb that pressure. Delta is evidence about execution behavior rather than a guaranteed prediction of future price.
What causes bullish divergence in CVD?
Bullish divergence can occur when price makes a lower low while CVD makes a higher low. It suggests aggressive selling isn't strengthening alongside the falling price and may indicate seller exhaustion or buyer absorption, though confirmation is still needed.
Does Volume Delta require tick data?
Accurate Volume Delta generally requires sufficiently granular trade data to determine whether executions occurred against the bid or ask. Approximated versions built from lower-resolution data may not represent true delta as precisely.
Can Net Volume and Volume Delta be used together?
Yes. Net Volume can confirm whether directional participation is expanding, while Volume Delta can show whether aggressive buyers or sellers are driving the activity. Combining them with price structure and other order flow tools can provide more context than either indicator alone.
Disclaimer: Technical indicators, Volume Delta, CVD, and historical market data cannot guarantee future price movements. Traders should independently assess market conditions and manage risk.







