For crypto traders and investors, identifying the current trend matters because a trading strategy that works during a strong bullish trend may fail in sideways markets. Some indicators measure trend direction, while others evaluate momentum, strength, or potential reversals.
Understanding how these tools complement one another helps traders make more informed trading decisions without overcrowding their charts.
Key Takeaways
-
Trend direction: Moving averages, SuperTrend, and Ichimoku Cloud help identify bullish and bearish price trends.
-
Momentum: MACD and RSI measure price momentum and highlight potential trend reversals.
-
Trend strength: ADX distinguishes strong trending markets from weak directional movements.
-
Confirmation: OBV helps evaluate whether trading volume supports current price movements.
-
Risk management: Combining complementary indicators with price action provides context, but no indicator guarantees accurate signals.
What Are Trend Indicators?
Trend indicators are technical analysis tools that process historical price data to identify market trends, evaluate direction, and measure momentum and trend strength.
These trading indicators typically use closing price, moving averages, trading volume, or price changes to smooth market fluctuations and reveal broader market behavior.
Unlike indicators focused exclusively on volatility or overbought and oversold conditions, trend-following tools primarily assess whether price movements support an established market trend.
Most traders combine directional indicators with momentum indicators and volume confirmation rather than expecting one calculation to predict every market reversal.
10 Best Trend Indicators for Trading
The following indicators serve different purposes. Their usefulness depends on trading timeframe, market volatility, and whether a particular asset is trending or consolidating.
| Indicator |
Primary Function |
Main Signal |
| Moving Averages |
Trend direction |
Price and MA crossovers |
| MACD |
Momentum and direction |
MACD and signal-line crosses |
| ADX |
Trend strength |
ADX above 25 |
| SuperTrend |
Direction and trailing levels |
Trend-line position changes |
| Ichimoku Cloud |
Trend structure |
Price above or below cloud |
| Aroon |
Emerging trends |
Aroon Up/Down crosses |
| Parabolic SAR |
Potential reversals |
Dots switch sides |
| RSI |
Momentum confirmation |
Readings and divergences |
| Bollinger Bands |
Volatility and trend behavior |
Band position and expansion |
| OBV |
Volume confirmation |
Price-volume agreement |
-
Moving Averages: Identify Average Price Direction
Moving Averages smooth out price data over a specified number of periods, making the underlying trend easier to recognize.
A Simple Moving Average (SMA) calculates an unweighted mean, while an Exponential Moving Average (EMA) gives more weight to recent prices.
When shorter moving averages rise above longer ones, traders commonly interpret the crossover as bullish. The opposite suggests bearish conditions.
For example, the EMA 20 and EMA 50 can help distinguish short-term momentum from a broader price trend.
The catch is lag. Moving averages confirm existing conditions rather than reliably predicting turning points.
-
Moving Average Convergence Divergence (MACD)
The Moving Average Convergence Divergence (MACD) indicator measures changes in price momentum using two exponential moving averages.
Common settings use the 12-period and 26-period EMAs to calculate the MACD line, alongside a nine-period signal line.
When the MACD line crosses above the signal line, it generates a potential bullish signal. A downward crossover may produce sell signals.
The average convergence divergence MACD histogram shows the difference between these lines, helping traders identify momentum shifts.
However, MACD versus RSI illustrates an important distinction: MACD evaluates trend momentum, while RSI measures the speed and magnitude of recent price changes.
-
Average Directional Index (ADX): Measure Trend Strength
The Average Directional Index (ADX) measures trend strength without independently identifying its direction.
The average directional index ADX uses three components:
-
ADX line: Measures overall trend strength.
-
Positive Directional Indicator (+DI): Reflects upward directional movement.
-
Negative Directional Indicator (-DI): Reflects downward directional movement.
Readings above 25 commonly suggest a strong trend, while readings below 20 indicate weak or non-trending conditions.
These thresholds follow conventional interpretations described in Fidelity's directional movement methodology.
If +DI exceeds -DI while ADX rises, bullish strength may be increasing. A rising ADX with -DI dominant indicates strengthening bearish movement.
-
SuperTrend: Follow the Current Price Trend
The SuperTrend indicator uses Average True Range (ATR) and a multiplier to construct a volatility-adjusted trend line.
An upward trend is commonly shown when price stays above the SuperTrend line. A move below it can indicate bearish direction.
SuperTrend is useful for trend trading because its line also provides a reference for trailing risk levels.
Still, sudden price moves and sideways conditions can trigger repeated direction changes, producing misleading entries.
-
Ichimoku Cloud: Identify Trend Structure
The Ichimoku Cloud indicator, also called Ichimoku Kinko Hyo, provides an equilibrium chart combining multiple price calculations and time-shifted lines.
Its components help identify trend direction, momentum, and potential support and resistance levels.
Prices above the cloud commonly indicate a bullish trend, while prices below suggest a bearish trend.
A thicker cloud can represent a wider projected support or resistance zone, although it doesn't guarantee that the level will hold.
The indicator combines several perspectives into one chart, but beginners may initially find its multiple lines difficult to interpret.
-
Aroon: Detect Emerging Market Trends
The Aroon indicator measures how recently an asset recorded its highest high or lowest low within a selected period.
Aroon Up and Aroon Down range between zero and 100.
When Aroon Up remains elevated above Aroon Down, recent price behavior favors an uptrend. The reverse suggests bearish market direction.
Frequent crossovers can identify unstable conditions rather than meaningful reversals. Aroon works best alongside observable trend lines and price structure.
-
Parabolic SAR: Identify Potential Trend Reversals
The Parabolic SAR indicator displays dots above or below the price chart.
Dots beneath price generally indicate an upward trend. When they move above price, the indicator signals a potential bearish reversal.
Traders sometimes use these dotted levels to manage trailing stops.
However, PSAR can generate frequent false signals during consolidation. Its sensitivity also depends on acceleration-factor settings.
-
Relative Strength Index (RSI): Confirm Momentum
The Relative Strength Index (RSI) measures momentum on a scale from zero to 100.
A relative strength index RSI reading above 70 traditionally indicates overbought conditions, while readings below 30 suggest oversold conditions.
These readings don't automatically predict reversals. During strong trends, RSI can remain elevated or depressed for extended periods.
Traders also monitor divergence between RSI and price action to identify potential trend reversals.
The stochastic oscillator and Stochastic RSI provide alternative momentum measurements, although adding multiple similar oscillators can create redundant signals.
-
Bollinger Bands: Measure Trend Behavior and Volatility
Bollinger Bands consist of a moving average surrounded by upper and lower bands calculated using standard deviation.
They help identify unusual price moves relative to recent average price behavior.
Prices repeatedly approaching the upper band can signal sustained buying momentum, while persistent lower-band activity may indicate selling pressure.
A touch of either band isn't automatically a reversal signal. Strong trends can continue along an outer band.
Band contraction often accompanies reduced market volatility, while expansion signals increasing price dispersion.
-
On-Balance Volume (OBV): Confirm Price Trends
On-Balance Volume (OBV) is a cumulative volume indicator that adds volume after higher closes and subtracts it after lower closes.
A rising OBV suggests increasing buying pressure. Falling OBV indicates greater selling pressure under this calculation.
When price reaches a new high but OBV fails to confirm it, weakening participation may signal an approaching trend reversal.
Fidelity's OBV methodology also identifies price-volume divergence as a possible warning of trend weakness.
Other tools, including the Money Flow Index (MFI), examine money movement using price and volume, although neither can reliably isolate institutional participation.
How to Combine the Best Trading Indicators
Effective trend analysis begins with three questions: Where is price moving? How strong is the movement? Does momentum or volume confirm it?
For example, a trader examining BTC/USDT on Gate.com could use EMA 50 to assess direction, ADX to measure strength, and OBV to evaluate volume confirmation.
If price remains above EMA 50, ADX exceeds 25, and OBV rises, several independent measurements support the bullish interpretation.
A trader can then assess support and resistance levels before planning an entry.
The Volume Weighted Average Price (VWAP) can add intraday context by measuring average traded price weighted by volume.
Market sentiment also matters. The Cboe Volatility Index (VIX) measures expected S&P 500 volatility, but isn't a direct cryptocurrency trend indicator or directional forecast.
Combining complementary signals is generally more useful than loading numerous technical indicators onto one chart.
How to Manage Risk When Using Trend Indicators
Technical indicators cannot eliminate uncertainty. They respond to historical observations, and changing market conditions can make previously effective signals unreliable.
Three risks deserve particular attention:
-
Lag: Trend confirmation may appear after substantial price movement.
-
False breakouts: Volatile or sideways markets can repeatedly invalidate signals.
-
Overlapping indicators: Similar calculations may create false confidence without independent confirmation.
Using structural stop-loss levels, appropriate position sizing, and price action trading strategies helps traders manage risk independently of indicator readings.
A strong trend can still reverse abruptly.
Conclusion
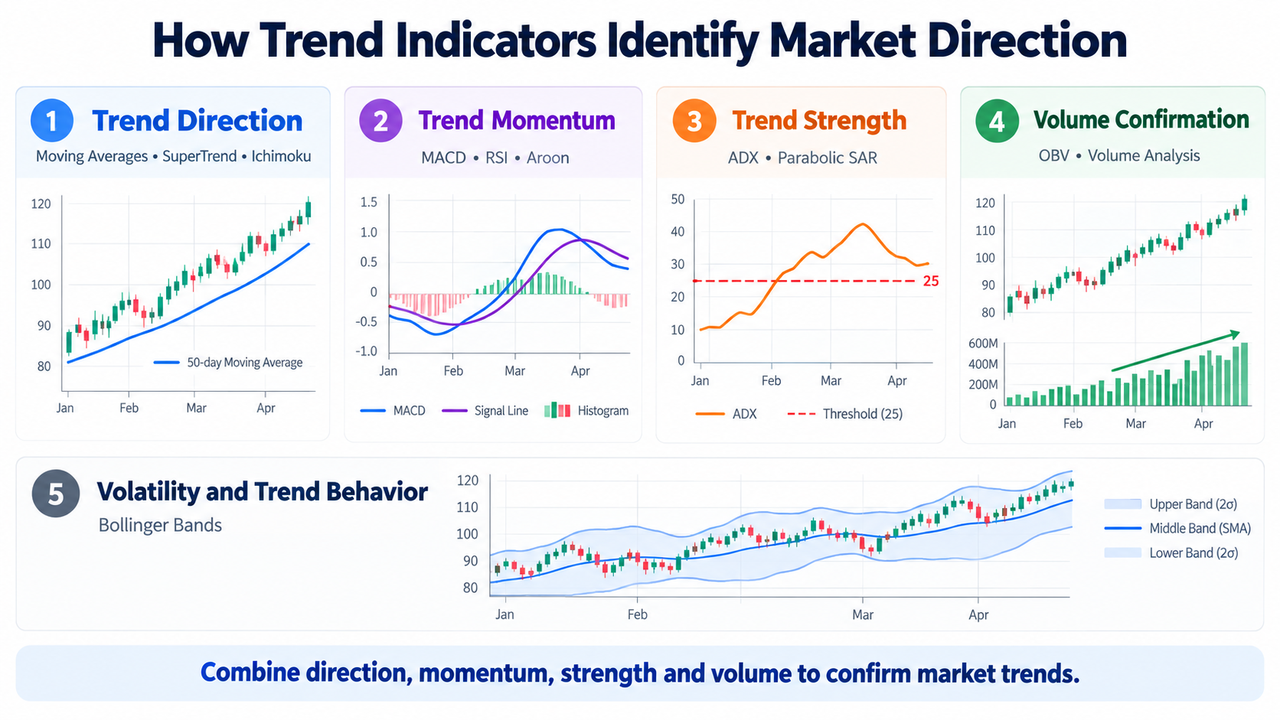
The best trend indicators combine directional analysis, momentum measurement, trend strength, and volume confirmation.
Moving averages and SuperTrend establish market direction, MACD and RSI gauge market momentum, ADX measures strength, and OBV evaluates participation.
No single tool identifies every turning point. Traders generally make more informed decisions by combining a small number of complementary indicators with price structure and consistent risk management.
Frequently Asked Questions
Which trend indicator is best for beginners?
Moving averages are among the easiest trend indicators to understand. EMA 20 and EMA 50 can help beginners recognize short-term and broader market direction without complicated calculations.
Is MACD better than ADX for identifying trends?
MACD evaluates trend momentum and direction, while ADX measures trend strength. Combining them can provide more information than relying on either indicator independently.
Which indicator identifies trend reversals?
MACD crossovers, RSI divergences, Parabolic SAR changes, and OBV divergence can signal potential trend reversals. None reliably confirms a reversal without supporting price action.
Can Bollinger Bands identify a strong bullish trend?
Yes. When prices repeatedly move near the upper Bollinger Band, sustained upward momentum may be present. However, upper-band contact alone doesn't establish whether the market is overbought or about to reverse.
How many trend indicators should traders use?
Two or three complementary indicators are often sufficient for an initial trading framework. One can measure direction, another strength, and a third momentum or volume confirmation.
Disclaimer: This content is provided for educational purposes only and does not constitute investment advice. Cryptocurrency trading involves substantial financial risk. Technical indicators, historical patterns, and trading signals cannot guarantee future market performance.







