For traders comparing 1-minute, 5-minute, hourly, and daily charts, the choice affects how quickly bands react to price volatility, how often signals appear, and how much market noise enters a trading strategy. The settings below provide practical starting points, not guaranteed trading signals.
Key Takeaways
-
The default Bollinger Bands settings are 20 periods and two standard deviations, commonly written as (20, 2).
-
Shorter settings, such as (9, 2) or (14, 2), react faster but can generate more false signals.
-
Longer settings, such as (20, 2.1) or (50, 2.1), smooth price movements but may identify changes later.
-
A Bollinger Band squeeze indicates low volatility and possible expansion, not a guaranteed breakout direction.
-
Combining Bollinger Bands with RSI, volume analysis, and price structure helps traders assess signal quality.
How Bollinger Bands Work: Middle Band, Upper and Lower Bands
Developed by John Bollinger, Bollinger Bands are a technical analysis tool that measures how far closing prices move from their recent average.
The Bollinger Bands indicator consists of three lines:
-
Middle band: A simple moving average (SMA), usually calculated over 20 periods.
-
Upper Bollinger Band: The middle band plus two standard deviations.
-
Lower Bollinger Band: The middle band minus two standard deviations.
Standard deviation measures how widely recent price data varies around its average. When price movements become larger, the outer bands widen. During low volatility, bands tighten.
The standard formula is:
Upper Band = SMA(20) + 2 × Standard Deviation(20)
Middle Band = SMA(20)
Lower Band = SMA(20) − 2 × Standard Deviation(20)
The period represents chart candles, not necessarily days. On a 5-minute chart, the 20-period middle line uses 20 five-minute candles. On a daily chart, it uses 20 daily candles.
These Bollinger Bands calculations explain why the same default settings behave differently across timeframes.
Although two-standard-deviation bands are sometimes associated with roughly 95% statistical coverage, crypto prices don't follow a consistently normal distribution. There is no dependable fixed percentage of price action that must remain inside the bands.
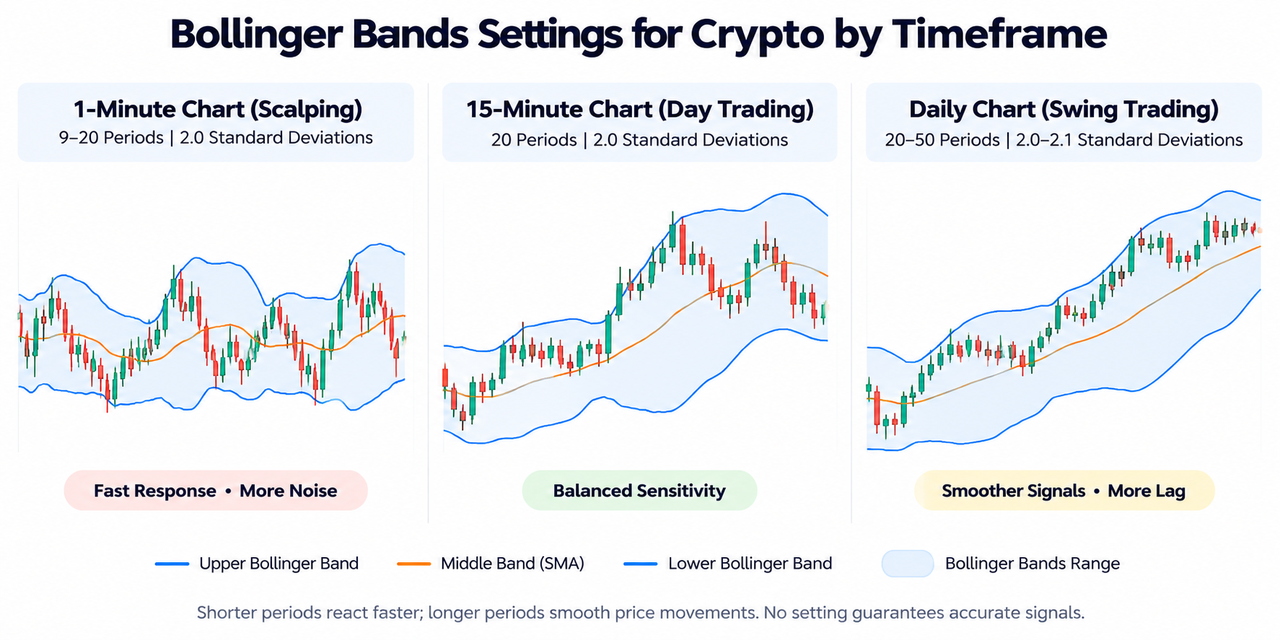
Best Bollinger Bands Settings for Crypto by Timeframe
The following settings are starting configurations for comparing sensitivity and smoothing. They aren't statistically established winners for every cryptocurrency.
| Chart Timeframe |
Suggested Settings |
Trading Application |
Main Tradeoff |
| 1-minute |
20, 2 or 9, 2 |
Fast scalping |
Frequent market noise |
| 5-minute |
14, 2 or 20, 2 |
Scalping and intraday trades |
Faster signals, more fluctuations |
| 15-minute |
20, 2 |
Intraday price movements |
Balanced sensitivity |
| 1-hour |
20, 2 |
Day trading and trend analysis |
Moderate signal delay |
| 4-hour |
20, 2 or 20, 2.1 |
Swing trading |
Slower reaction |
| 1-day |
20, 2 or 50, 2.1 |
Position and trend trading |
Fewer short-term signals |
1-Minute and 5-Minute Bollinger Bands Settings for Scalping
The standard (20, 2) configuration remains a reasonable baseline for 1-minute crypto scalping. It balances responsiveness against excessive sensitivity.
Aggressive scalpers sometimes experiment with 9- or 14-period settings. A shorter period responds quickly when price oscillates, but also makes the bands react to temporary fluctuations.
Some use deviations of 2.0–2.5 to widen the bands and filter minor excursions. However, higher deviations can delay signals, while shorter periods combined with wider bands produce a different balance of sensitivity and containment.
For a more consistent shorter-period adjustment, John Bollinger's published rules suggest approximately 1.9 deviations for a 10-period average.
Crypto scalpers can combine the bands with EMA settings for scalping to assess short-term direction before interpreting a band touch.
15-Minute and 1-Hour Settings for Day Trading
The (20, 2) configuration is a useful starting point for both 15-minute and hourly charts.
On a 15-minute chart, the indicator reflects approximately five hours of trading history. On an hourly chart, it reflects 20 hours.
These settings can help identify intraday price extremes, periods of consolidation, and volatility expansion.
For example, someone monitoring the BTC/USDT market on Gate.com can compare 15-minute and hourly Bollinger Bands to see whether a short-term breakout aligns with the broader price trend.
The best indicators for day trading crypto often combine volatility measurements with momentum and trend information.
4-Hour and Daily Settings for Swing Trading
Swing traders generally need smoother signals because individual intraday fluctuations matter less than sustained price movements.
A 20-period average with two standard deviations remains useful on the 4-hour and daily charts.
For longer analysis windows, traders may experiment with (50, 2.1). Longer averages respond more slowly, while the slightly higher deviation maintains a broader statistical envelope.
That combination follows Bollinger's guidance on adjusting deviations when increasing the period.
The middle band can also support moving average analysis across trading timeframes, particularly when identifying the direction of a sustained trend.
How to Adjust Bollinger Bands Settings for Market Volatility
Changing the period and standard deviation produces different results.
| Adjustment |
Effect on Bollinger Bands |
Practical Consequence |
| Shorter period |
Faster response |
More frequent signals and noise |
| Longer period |
Smoother bands |
Slower recognition of changes |
| Lower deviation |
Narrower outer bands |
More band touches |
| Higher deviation |
Wider outer bands |
Fewer band touches |
During a strong uptrend, price may repeatedly touch the upper band. During a bearish trend, prices can follow the lower band.
This behavior, called walking the bands, means touching an upper or lower band does not automatically establish overbought and oversold conditions that will reverse.
The upper Bollinger Band highlights relatively high prices, while the lower band identifies relatively low prices against the selected moving average.
For a separate measure of changing volatility, Bollinger Band Width tracks the distance between the outer bands relative to the middle band.
Bollinger Band Squeeze vs Bollinger Bounce
Two common trading approaches interpret band behavior differently.
Bollinger Squeeze: Identifying Potential Breakouts
A Bollinger Band squeeze occurs when the bands contract tightly, indicating low volatility.
If price breaks above resistance while the bands expand, a significant price move may be developing. The same expansion can accompany a downward breakout.
Volume confirmation matters. A price breakout supported by rising participation may carry different implications from one occurring on thin trading activity.
Traders can compare these signals with crypto breakout indicators to assess whether expanding volatility accompanies directional strength.
Bollinger Bounce: Trading Mean Reversion
The Bollinger Bounce strategy assumes that prices may return toward their moving average after reaching an outer band.
For example, in a sideways market:
-
Price approaches the lower band.
-
Selling momentum weakens.
-
Price moves back toward the middle band.
-
Traders evaluate whether the recovery is sustainable.
This mean-reversion approach is less reliable during powerful trends because price can continue moving along one band.
The RSI indicator and its timeframe settings can help distinguish weakening momentum from persistent directional pressure.
Combining Bollinger Bands With Other Technical Indicators
Bollinger Bands primarily measure relative price levels and volatility. Other technical indicators can help confirm signals.
RSI and MACD: RSI helps evaluate momentum and potentially overbought or oversold conditions. MACD measures changes in trend momentum. Neither guarantees reversals.
Volume indicators: Rising volume during a breakout may support the interpretation that more participants are involved. Volume indicators for crypto trading can help evaluate that participation.
Keltner Channels and ATR: Keltner Channels generally use average true range to construct volatility envelopes. Comparing Keltner Channels with Bollinger Bands can reveal differences between ATR-based and standard-deviation-based volatility measurements.
Some traders also use a Double Bollinger Band strategy, plotting two sets of bands with different deviations, commonly one and two. The inner and outer zones help classify relative price strength, but don't eliminate false signals.
Common Bollinger Bands Settings Mistakes
Using identical settings without considering market conditions can distort trading decisions.
A shorter period isn't automatically better for scalping. It can produce repeated signals without meaningful price movement.
Likewise, wider bands aren't automatically safer. They reduce band touches but may cause traders to overlook earlier changes in volatility.
The biggest mistake is treating every upper-band touch as a sell signal or every lower-band touch as a buy signal.
According to Charles Schwab's volatility analysis, narrowing bands help identify volatility compression, but they don't independently establish the direction of the next price move.
Traders should assess liquidity, transaction costs, position size, stop-loss placement, and historical signal behavior before relying on any configuration.
Conclusion
The (20, 2) Bollinger Bands settings are the most practical baseline for crypto across common timeframes.
Scalpers can test shorter periods for quicker reactions, while swing traders may experiment with longer averages for smoother analysis. The right configuration depends on the asset, timeframe, trading strategy, and market volatility.
Bollinger Bands are most useful for interpreting volatility contraction, expansion, and relative price extremes. No parameter combination is a universally reliable indicator of future price movements.
Frequently Asked Questions
What are the best Bollinger Bands settings for a 1-minute crypto chart?
The standard starting settings are 20 periods and two standard deviations. Aggressive scalpers sometimes test 9- or 14-period averages, but shorter configurations are more sensitive to temporary price fluctuations.
Is Bollinger Bands 20, 2 better than 14, 2?
Neither is universally better. The (20, 2) configuration produces smoother readings, while (14, 2) reacts faster to recent movements and may generate more false signals.
What standard deviation is best for crypto Bollinger Bands?
Two standard deviations remain the usual default. Lower values create narrower bands, while higher values widen them. The appropriate setting depends on the chosen period and market behavior.
Does a Bollinger Band squeeze guarantee a breakout?
No. A squeeze identifies unusually low volatility, which may precede expansion. It cannot reliably predict when the move will occur, its direction, or whether a breakout will continue.
Can Bollinger Bands identify overbought and oversold conditions?
They identify prices that are relatively high or low compared with recent trading activity. An upper-band touch may suggest an elevated price, but strong trends can keep prices near the outer bands without reversing.
What is the best Bollinger Bands setting for swing trading?
The (20, 2) configuration is a reasonable starting point for 4-hour and daily charts. Traders seeking a smoother long-term view can evaluate (50, 2.1) against historical results.
Disclaimer
This content is for educational purposes only and does not constitute financial or investment advice. Technical indicators use historical data and cannot guarantee future outcomes. Cryptocurrency trading involves volatility, liquidity risks, and potential capital losses. Past performance does not guarantee future results.