For traders buying and selling Bitcoin or altcoins within the same day, choosing indicators that react to changing market conditions matters more than filling a chart with technical tools. Crypto markets operate 24/7, and sudden price movements can quickly invalidate trading signals.
The most practical approach combines one trend indicator, one momentum indicator, and one volume indicator, supported by price action and risk management.
Key Takeaways
-
VWAP, EMA, and SuperTrend help identify intraday trend direction and potential support or resistance.
-
RSI and MACD measure market momentum, while Bollinger Bands and ATR track volatility.
-
OBV helps determine whether trading volume supports a price movement or breakout.
-
Three to four complementary indicators are generally enough for a practical trading setup.
-
No technical indicator consistently predicts future price movements or eliminates false signals.
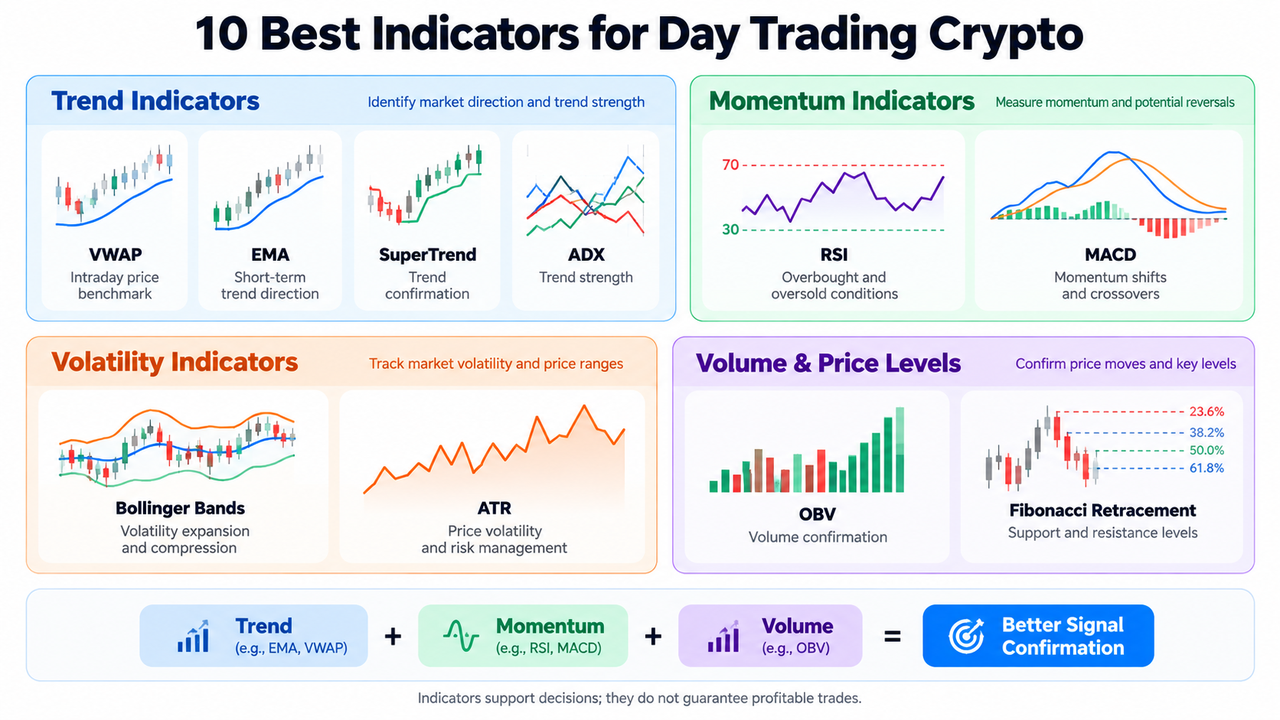
What Are Day Trading Indicators in Crypto Trading?
Day trading indicators are mathematical calculations based on historical price data, trading volume, or both. They help traders evaluate market trends, momentum, volatility, and buying or selling pressure.
Most technical indicators fall into four categories:
-
Trend indicators: Identify market direction using moving averages or price-following calculations.
-
Momentum indicators: Measure the speed and strength of price movements.
-
Volatility indicators: Show how widely prices fluctuate.
-
Volume indicators: Assess market participation behind price changes.
Some indicators are described as leading indicators because they highlight potential turning points early. Others are lagging indicators, confirming movements after they begin.
Neither category is consistently superior. As the CME Group's technical analysis course illustrates, traders commonly combine chart patterns, moving averages, support and resistance levels, and oscillators.
10 Best Day Trading Indicators for Crypto Markets
| Indicator |
Category |
Primary Use |
| VWAP |
Price and volume |
Intraday price benchmark |
| EMA |
Trend |
Short-term trend direction |
| RSI |
Momentum |
Overbought and oversold conditions |
| MACD |
Trend and momentum |
Momentum shifts and crossovers |
| Bollinger Bands |
Volatility |
Price extremes and compression |
| ATR |
Volatility |
Stop-distance planning |
| SuperTrend |
Trend |
Directional trend signals |
| ADX |
Trend strength |
Trending versus ranging conditions |
| OBV |
Volume |
Volume confirmation |
| Fibonacci Retracement |
Price levels |
Potential support and resistance |
-
Volume Weighted Average Price (VWAP)
The Volume Weighted Average Price (VWAP) calculates the average trading price weighted by volume during a selected session.
Price above VWAP suggests trading above the session's volume-weighted average, while price below it suggests the opposite.
VWAP can also act as dynamic support or resistance. Unlike exponential moving averages, it directly incorporates traded volume.
Best use: Establishing intraday directional bias.
Because crypto trades continuously, VWAP results depend on the chosen session reset.
-
Exponential Moving Averages (EMA)
An EMA identifies market trends by smoothing price data while assigning greater weight to recent prices.
Common intraday settings include:
-
9 EMA: Fast momentum and entry timing.
-
20 EMA: Short-term trend confirmation.
-
50 EMA: Broader intraday trend direction.
When the 9 EMA, 20 EMA, and 50 EMA align upward, traders may interpret the structure as bullish.
Moving averages can also provide dynamic support and resistance levels, although repeated crossovers in sideways markets create unreliable signals.
Best use: Identifying trends and pullback opportunities.
-
Relative Strength Index (RSI)
The Relative Strength Index (RSI) measures momentum on a scale from 0 to 100.
Common interpretations include:
-
Above 70: Overbought conditions.
-
Below 30: Oversold conditions.
-
Above 50: Relatively stronger bullish momentum.
-
Below 50: Relatively stronger bearish momentum.
An RSI reading above 70 doesn't automatically produce a sell signal. During a strong trend, momentum may remain elevated for extended periods.
Best use: Evaluating momentum exhaustion and potential trend reversals.
-
Moving Average Convergence Divergence (MACD)
The Moving Average Convergence Divergence (MACD) combines exponential moving averages to detect momentum shifts.
Its main components are the MACD line, signal line, and histogram.
A MACD line crossing above the signal line is commonly interpreted as bullish, while a downward crossover suggests bearish momentum. The zero line indicates whether the shorter EMA is above or below the longer EMA.
Because MACD relies on historical data, it can react late during sudden price movements.
Best use: Confirming momentum shifts within the current price trend.
-
Bollinger Bands
Bollinger Bands consist of three lines: a moving average and upper and lower bands typically positioned two standard deviations away.
Narrow bands indicate relatively low recent volatility, sometimes preceding a volatility expansion. Wider bands indicate greater price dispersion.
Price approaching an outer band may signal an extreme relative to recent activity, but it doesn't necessarily indicate an imminent price correction.
Best use: Identifying volatility compression and potential breakout conditions.
-
Average True Range (ATR)
The Average True Range (ATR) measures market volatility using recent trading ranges, including gaps between bars.
ATR doesn't predict market direction. Instead, it estimates how much an asset typically moves over the selected period.
For example, if Bitcoin's 15-minute ATR is $120, a hypothetical stop distance of 1.5 ATR equals $180. The appropriate distance still depends on chart structure and position risk.
Best use: Volatility-adjusted stops and position sizing.
-
SuperTrend Indicator
SuperTrend is an ATR-based trend indicator that plots a trailing line above or below price.
A bullish signal generally appears when price moves above the active SuperTrend line. A bearish signal develops when price moves below it.
The indicator performs differently depending on its ATR period and multiplier. During sideways markets, frequent direction changes can generate false signals.
Best use: Following established intraday trends.
Traders may compare SuperTrend with VWAP when assessing trend direction against the session's average trading price.
-
Average Directional Index (ADX)
The Average Directional Index (ADX) measures trend strength on a scale from 0 to 100 without indicating direction.
Readings above 25 are commonly associated with stronger trends, while readings below 20 often suggest weak directional conditions.
Those thresholds are conventions, not universal trading rules.
Best use: Deciding whether market conditions favor trend trading or range-based strategies.
-
On-Balance Volume (OBV)
On-Balance Volume (OBV) tracks cumulative trading volume by adding volume when price closes higher and subtracting it when price closes lower.
Rising OBV alongside rising prices suggests volume confirmation. If price breaks resistance while OBV weakens, participation may be insufficient to sustain the move.
Volume spikes can accompany meaningful breakouts, but they may also occur during short-lived speculation.
Best use: Confirming buying pressure, selling pressure, and breakout participation.
-
Fibonacci Retracement
Fibonacci Retracement identifies potential support and resistance levels using ratios such as 23.6%, 38.2%, 50%, and 61.8%.
Traders apply these levels between selected swing highs and lows to locate possible pullback zones.
The 50% level is widely used despite not being a Fibonacci ratio.
Unlike momentum tools, Fibonacci levels don't measure current market strength. Their usefulness depends heavily on the swing points selected.
Best use: Planning potential entries around price structure.
How Many Indicators Should Crypto Day Traders Use?
Three complementary indicators often provide a workable starting point: one trend tool, one momentum tool, and one volume tool.
Consider a hypothetical BTC/USDT setup:
-
EMA: The 20 EMA slopes upward, suggesting a bullish trend.
-
RSI: A reading of 55 indicates positive momentum without an extreme reading.
-
OBV: Rising volume accumulation supports the move.
-
ATR: Helps assess whether the intended stop distance fits the trade's risk budget.
A trader examining the BTC/USDT spot chart on Gate.com can compare these signals against actual candles, volume, and nearby resistance levels.
Adding several indicators that measure essentially the same thing may create analysis paralysis rather than meaningful confirmation.
Risks and Limitations of Day Trading Indicators
Technical indicators rely primarily on historical market information. Even when several signals agree, unexpected news, liquidity changes, or aggressive liquidations can reverse price direction.
Crypto trading also involves spreads, transaction fees, slippage, and potentially leverage-related losses.
The CFTC's virtual currency trading advisory highlights price volatility and leverage risks. FINRA's day-trading risk disclosure also explains the risks of frequent intraday trading, although its securities rules shouldn't automatically be applied to every crypto market.
Indicators should support a defined trading plan, not replace stop-loss planning or position sizing.
Conclusion
The best indicators for day trading crypto depend on what the trader needs to measure.
VWAP and EMA help establish market direction, RSI and MACD evaluate momentum, ATR measures volatility, and OBV provides volume confirmation.
For most intraday setups, combining a few complementary indicators with price action is more practical than accumulating signals. Their effectiveness remains conditional on market conditions, execution costs, and disciplined risk management.
FAQs
What is the most accurate indicator for crypto day trading?
No single indicator is consistently the most accurate. VWAP, EMA, RSI, and MACD measure different market characteristics, and their reliability depends on the asset, timeframe, and trading conditions.
Which indicators are best for beginners?
EMA, RSI, and VWAP provide a relatively accessible starting point. EMA shows trend direction, RSI measures momentum, and VWAP identifies the session's volume-weighted average price.
How many indicators should day traders use?
Three indicators are often sufficient, with a fourth added for a distinct purpose such as volatility measurement. Combining trend, momentum, and volume indicators reduces unnecessary signal duplication, although it doesn't guarantee fewer losing trades.
Are leading indicators better than lagging indicators?
Leading indicators may highlight potential turning points earlier but can generate more false signals. Lagging indicators generally provide later confirmation after price movement has already developed.
Which indicator is best for crypto scalping?
VWAP, fast EMAs, and RSI are commonly used for short-term scalping. Their settings require adjustment for liquidity, trading costs, and execution speed, especially on one-minute and five-minute charts.
Disclaimer
This content is for educational purposes only and does not constitute financial or investment advice. Cryptocurrency trading involves substantial risk, and technical indicators cannot guarantee future performance. Traders should assess market conditions, position sizing, trading costs, and applicable regulations before making financial decisions.







