For active day traders, the challenge is choosing settings that respond quickly without generating excessive false signals. Comparing timeframe-specific combinations, market volatility and confirmation methods helps determine which setup deserves testing before real capital is involved.
Key Takeaways
-
1-minute charts: The 9 and 21 EMAs provide quick momentum signals but are sensitive to market noise.
-
5-minute charts: The 9 EMA, 20 EMA and 50 SMA combine entry timing with trend identification.
-
15–30-minute charts: The 20 and 50 EMAs help identify sustained intraday trends.
-
Trend confirmation: Moving averages work better alongside price action, volume and support or resistance levels.
-
Risk management: Backtesting with commissions, slippage and different market conditions is necessary before live trading.
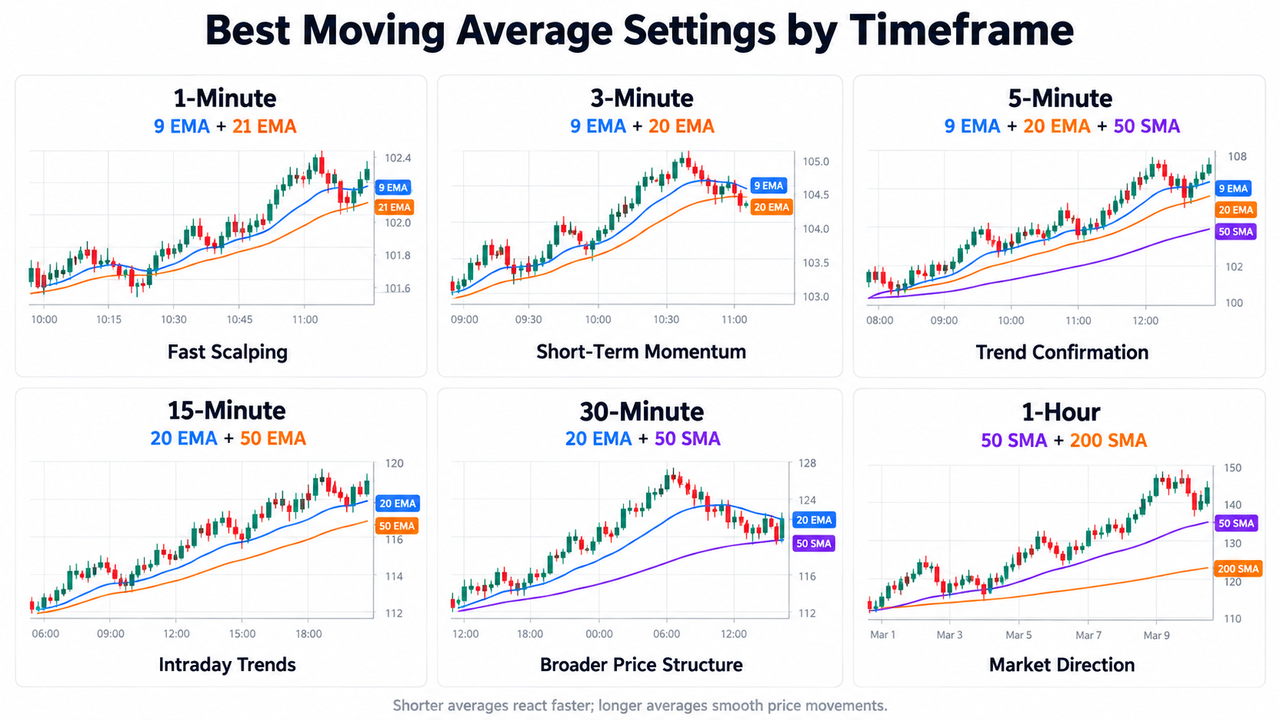
Best Moving Average Settings for Day Trading by Timeframe
Different minute charts require different approaches because each candle represents a different amount of price data. A 20-period EMA on a 1-minute chart tracks movements across approximately 20 minutes, whereas the same setting on a 15-minute chart represents 300 minutes, or five hours.
| Timeframe |
Suggested Moving Average Setup |
Primary Trading Use |
| 1-minute |
9 EMA + 21 EMA |
Fast scalping and momentum shifts |
| 3-minute |
9 EMA + 20 EMA |
Short-term trend confirmation |
| 5-minute |
9 EMA + 20 EMA + 50 SMA |
Entry timing and trend filtering |
| 15-minute |
20 EMA + 50 EMA |
Intraday trend identification |
| 30-minute |
20 EMA + 50 SMA |
Broader price structure |
| 1-hour |
50 SMA + 200 SMA |
Higher-timeframe market bias |
These are commonly used configurations, not statistically established universal winners. Their effectiveness depends on liquidity, volatility, trading costs and the underlying strategy.
1-Minute Charts: 9 EMA and 21 EMA for Fast Trading Signals
The 9 and 21 EMAs are useful starting points for traders monitoring short-term price movements. A rising 9 EMA above a rising 21 EMA suggests bullish momentum, while the opposite arrangement indicates bearish sentiment.
A 9 EMA crossing above the 21 EMA can generate a potential long-entry signal. However, high-frequency price fluctuations create whipsaws, where successive crosses occur without a meaningful trend.
Traders using scalping indicators often combine fast averages with nearby price structure rather than treating every crossover as an entry.
5-Minute Charts: 9 EMA, 20 EMA and 50 SMA
The 5-minute timeframe offers a balance between responsiveness and market noise. A 9 EMA tracks immediate momentum, the 20 EMA establishes the developing intraday trend, and the 50 SMA indicates broader directional bias.
For example, when price remains above a rising 50 SMA and the 9 EMA crosses above the 20 EMA, short-term momentum may be aligning with the underlying trend.
The 9 EMA, 20 EMA and 50 EMA operate at different speeds, making their arrangement useful for understanding trend development. Using a 50 SMA instead changes the weighting and crossover timing.
15–30-Minute Charts: 20 EMA and 50 EMA for Trend Identification
The 20 and 50 EMAs suit traders who prefer fewer signals and a broader perspective on intraday trading.
When both averages slope upward and price forms higher lows, the setup suggests strengthening bullish momentum. A pullback toward the 20 EMA may identify an area worth monitoring, particularly near an established demand zone.
On these timeframes, the 50 SMA can also act as dynamic support or resistance. It represents a slower measure of market direction, although price may cross it repeatedly during consolidation.
1-Hour Charts: 50 SMA and 200 SMA for Market Direction
The 50 and 200 SMAs provide higher-timeframe context. The 200-period SMA is commonly used as a major trend filter, while the 50 SMA responds to medium-term changes.
An important distinction: the 200 SMA on an hourly chart represents 200 hourly candles, not 200 trading days.
These longer averages are generally more useful for directional filtering than precise scalping entries.
Which Moving Average Type Fits Your Trading Strategy?
A moving average is a lagging technical analysis tool that smooths historical price data. Most calculations use each candle's closing price, although platforms may allow another price input.
| Moving Average |
Calculation Approach |
Main Characteristic |
| SMA |
Equal weight to each data point |
Smooth, slower response |
| EMA |
Exponentially more weight to recent prices |
Faster momentum tracking |
| WMA |
Typically linearly weighted recent prices |
Responsive to recent changes |
| SMMA |
Strong smoothing across past values |
Reduces short-term fluctuations |
| HMA |
Combines weighted averages to reduce lag |
Smooth but relatively responsive |
The simple moving average is useful for broader trends, whereas EMAs generally react faster to recent price changes.
Weighted moving averages and Hull Moving Averages offer alternative smoothing approaches. The HMA and EMA can produce different turning points even when their nominal periods match.
Some traders experiment with Fibonacci-number periods such as 8, 13, 21 and 34 to identify momentum shifts. Those lengths have no inherent predictive advantage.
Using Moving Averages as Dynamic Support and Resistance Levels
Moving averages can mark areas where prices repeatedly pause or reverse during trending markets.
For instance, price may pull back toward a rising 20 EMA before continuing higher. The 50 SMA may provide a slower support reference. In declining markets, these same averages can behave as resistance levels.
A potential bounce becomes more meaningful when it coincides with a previous swing low, demand zone or increased trading volume. The line itself does not create guaranteed support.
Support and resistance indicators help assess whether an average aligns with established price structure.
Combining Moving Average Crossovers With Trading Signals
A moving average crossover occurs when a faster average crosses a slower one. It may indicate changing momentum or an emerging trend reversal, but crossovers remain unreliable as standalone trading signals.
Consider a trader examining the BTC/USDT chart on Gate.com. The trader applies the 9 EMA, 21 EMA and 50 SMA to the 5-minute chart.
A potential bullish setup might require the following:
-
Price holds above the rising 50 SMA.
-
The 9 EMA crosses above the 21 EMA.
-
A candle closes above nearby resistance with supporting volume.
-
The stop-loss is positioned according to price structure and predefined risk.
The VWAP indicator adds another perspective by comparing price with the session's volume-weighted average, helping assess intraday strength.
This combination can filter some weak entries, although multiple indicators cannot eliminate losses.
Adjusting Moving Average Settings for Market Volatility
High market volatility increases sudden price changes and false signals, especially on 1-minute charts. Shorter averages such as the 5 or 9 EMA react quickly but frequently change direction.
Longer settings may help smooth market noise, though delayed signals can reduce entry quality.
In range-bound markets, repeated average crossovers often produce little useful information. Price boundaries and indicators for sideways markets may become more relevant than trend-following averages.
Many professional traders also evaluate volatility, liquidity and market structure rather than depending on a fixed moving average setup across every session.
Backtesting Moving Average Settings and Risk Management
Backtesting measures how a strategy would have performed on historical price data. Before using any moving average setup in live trading, traders should evaluate win rate, average profit and loss, maximum drawdown and trading costs.
A practical testing sequence involves:
-
Test the chosen timeframe and moving average periods on historical data.
-
Include realistic commissions, spreads and execution slippage.
-
Compare performance across trending, sideways and high-volatility markets.
-
Separate in-sample optimization from out-of-sample validation.
-
Apply walk-forward analysis to test whether settings remain useful over changing periods.
Optimizing only for the highest historical return risks overfitting. A strategy that performs well on one dataset may fail when market conditions change.
Automated trading systems face the same limitation. Higher trading frequency can make transaction costs especially damaging, a risk also highlighted in the SEC's day-trading guidance.
Conclusion
The best moving average settings for day trading vary by timeframe. The 9/21 EMA combination emphasizes speed on 1-minute charts, while 9/20 EMA with a 50-period filter provides a balanced starting setup on 5-minute charts. Longer averages help establish market direction on 15-minute and higher timeframes.
No combination guarantees accurate entries. Price confirmation, disciplined risk management and realistic backtesting matter more than finding a supposedly perfect moving average period.
Frequently Asked Questions
What is the best moving average for 5-minute day trading?
The 9 EMA and 20 EMA are common choices for short-term momentum, while the 50 SMA can provide a broader trend filter. The combination should be tested against actual trading costs and market conditions.
Is the 9 EMA or 21 EMA better for day trading?
The 9 EMA reacts faster to recent price movements, making it useful for entry timing. The 21 EMA smooths more market noise and can provide stronger trend confirmation, although neither is universally better.
Should day traders use the 200 SMA?
Yes, the 200 SMA can help establish higher-timeframe market direction. It generally serves as a broader trend filter rather than a precise entry indicator on short charts.
How many moving averages should traders use?
Two or three moving averages are usually sufficient for a practical trading setup. Additional averages may introduce overlapping signals and unnecessary complexity without improving accuracy.
Do moving averages work during sideways markets?
Moving averages become less reliable when prices fluctuate within narrow ranges. Repeated crossovers can generate whipsaws, so range boundaries, volume and price structure may provide better context.
Can moving averages predict market reversals?
Moving averages can help identify potential momentum changes, but they react to historical prices rather than predict future movements. A crossover becomes more informative when confirmed by volume, price structure and changing trend strength.
Disclaimer
This material is for educational purposes only and does not constitute financial or investment advice. Moving averages are lagging indicators, and historical backtesting does not guarantee future trading results. Cryptocurrency trading involves volatility, execution costs and potential capital losses.