These technical indicators help identify when cryptocurrency prices break important support and resistance levels and whether trading volume, volatility, and momentum support the move.
For traders navigating the highly volatile crypto market, the challenge isn't simply spotting a breakout. It's determining whether price can sustain the move or quickly return to its previous range.
Key Takeaways
-
Donchian Channels and Bollinger Bands identify potential breakouts from established price ranges.
-
Volume Profile and OBV help assess whether buying or selling pressure supports a breakout.
-
ATR measures price volatility, while MACD and RSI help evaluate momentum shifts.
-
Moving averages provide trend direction and potential dynamic support or resistance.
-
Combining price action, volume confirmation, and risk management reduces reliance on individual signals but cannot eliminate false breakouts.
What Are Breakout Indicators in Crypto Trading?
Breakout indicators are technical analysis tools used to identify when an asset moves beyond established resistance or support, potentially beginning a stronger directional move.
A bullish breakout occurs when price rises above resistance. A bearish breakdown happens when price falls below support.
Traders generally assess three conditions:
-
Price structure: Has the closing price moved beyond an established trading range?
-
Market participation: Is trading volume increasing during the move?
-
Momentum and volatility: Are price movements expanding in the breakout direction?
The CME Group's technical analysis education identifies support, resistance, moving averages, and momentum oscillators as established chart-analysis techniques.
No indicator makes price prediction certain. Their value comes from interpreting different aspects of market data together.
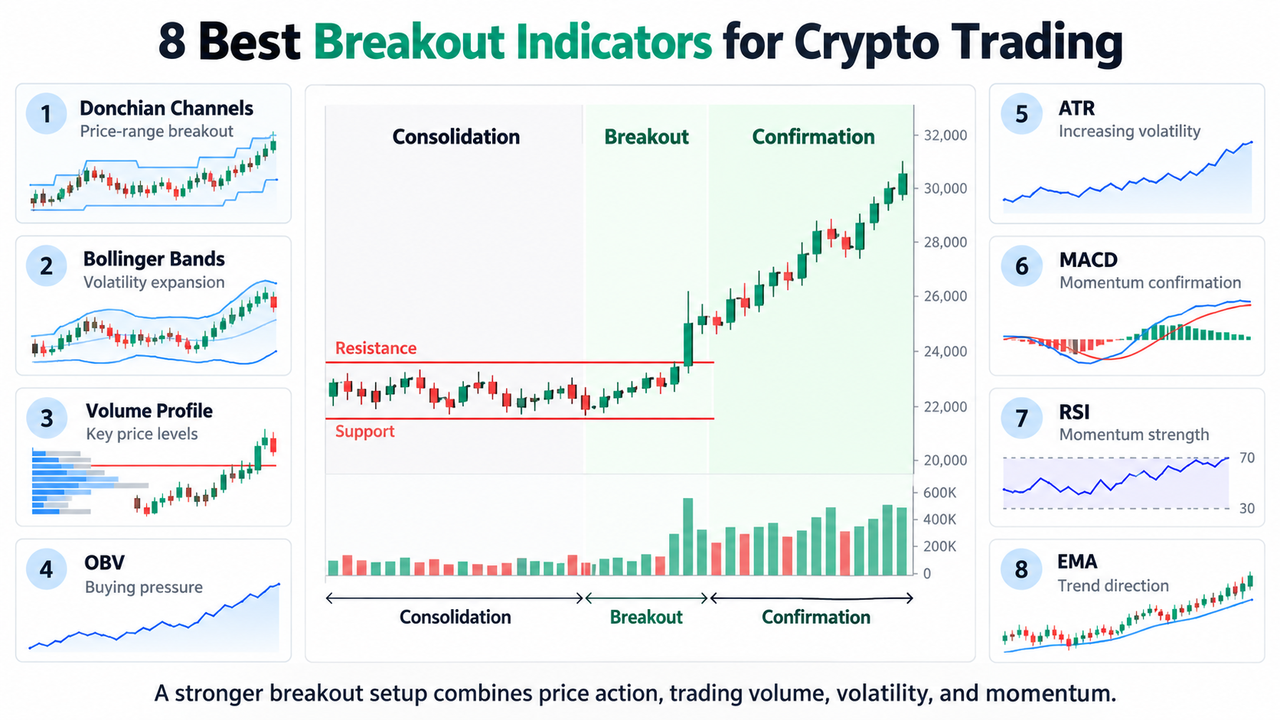
8 Best Breakout Indicators for Crypto Trading
| Indicator |
Primary function |
Breakout confirmation |
| Donchian Channels |
Price-range boundaries |
Close beyond prior channel |
| Bollinger Bands |
Volatility expansion |
Band expansion after compression |
| Volume Profile |
Price-volume structure |
Break beyond high-volume zones |
| OBV |
Buying/selling pressure |
OBV supports price breakout |
| ATR |
Price volatility |
ATR rises as the range expands |
| MACD |
Trend momentum |
MACD and signal-line alignment |
| RSI |
Momentum strength |
RSI supports directional movement |
| EMA |
Market direction |
Price holds beyond rising/falling EMAs |
-
Donchian Channels: Best for Price-Range Breakouts
Donchian Channels plot the highest high and lowest low over a selected lookback period, commonly 20 candles.
A bullish breakout occurs when the closing price moves above the preceding channel's upper boundary. A bearish breakdown occurs below its lower boundary.
The indicator works particularly well for identifying exits from consolidation because its boundaries follow actual price extremes.
The catch is that sideways markets can repeatedly trigger false signals. Volume confirmation helps distinguish meaningful expansion from temporary price fluctuations.
-
Bollinger Bands: Best for Volatility Breakouts
Bollinger Bands contain three lines: a middle moving average and upper and lower bands commonly positioned two standard deviations away.
Standard deviation measures how far prices fluctuate around their average price.
During low market volatility, the bands contract into a squeeze. When price moves outside the range and the bands widen, volatility may be expanding.
A price near the upper band can indicate relatively elevated prices, while the lower band suggests the opposite. Neither condition automatically generates a sell signal or buy signal.
The distinction between volatility compression and expansion also matters when comparing Bollinger Bands with Keltner Channels.
-
Volume Profile: Best for Support and Resistance Breakouts
Volume Profile displays historical trading volume distributed across price levels instead of time.
High-volume nodes identify prices where substantial trading occurred, potentially creating support and resistance zones. Low-volume areas show where comparatively little trading took place.
When price breaks a significant high-volume zone, traders watch whether it holds beyond that area or returns inside.
Volume Profile describes historical activity; it doesn't independently prove current buying strength. That requires examining fresh trading volume and price action.
-
On-Balance Volume: Best for Volume Confirmation
On-Balance Volume adds a candle's trading volume when its closing price rises and subtracts volume when it falls.
A rising OBV indicates that more volume is associated with positive closing-price changes, commonly interpreted as increasing buying pressure.
If Bitcoin breaks resistance while OBV also reaches a new high, the two signals support a bullish interpretation.
However, divergence between rising prices and falling OBV can suggest weakening participation or potential trend reversals.
Unlike Volume Profile, OBV tracks cumulative volume direction rather than volume concentrated at individual prices.
-
Average True Range: Best for Breakout Volatility
Average True Range (ATR) measures the average true price range over a selected period, commonly 14 candles.
High ATR indicates substantial price fluctuations. Low ATR reflects relatively quiet market conditions.
When ATR rises during a breakout, it supports the interpretation that price expansion is occurring. It doesn't establish whether that expansion will continue.
According to Charles Schwab's ATR explanation, traders can also use ATR to evaluate stop placement and position sizing.
For example, a hypothetical $100 asset with a $3 ATR has an average true range equal to 3% of its current price.
-
MACD: Best for Momentum Shifts and Trend Confirmation
Moving Average Convergence Divergence (MACD) compares two exponential moving averages.
Its standard calculation subtracts the 26-period EMA from the 12-period EMA. A nine-period EMA of the resulting MACD line forms the signal line.
A bullish crossover occurs when the MACD line crosses above the signal line, suggesting improving price momentum.
A crossover above the zero line can provide additional evidence of bullish market direction, although MACD remains a lagging indicator.
The CME Group's oscillator material also identifies RSI and the Stochastic Oscillator as useful momentum tools.
-
RSI: Best for Measuring Breakout Momentum
The Relative Strength Index (RSI) measures the balance of recent upward and downward price changes on a scale from 0 to 100.
Readings above 70 traditionally indicate overbought conditions, while readings below 30 suggest oversold conditions.
However, strong cryptocurrency market trends can maintain elevated or depressed RSI readings for extended periods.
During bullish breakouts, RSI moving above 50 and maintaining strength can support momentum confirmation.
The Stochastic Oscillator uses different calculations, with readings above 80 and below 20 traditionally interpreted as overbought and oversold.
-
Exponential Moving Averages: Best for Market Direction
Exponential moving averages assign greater weight to recent prices than simple moving averages, making them more responsive to changing market conditions.
Traders commonly use the 20-period and 50-period EMA to identify market trends and dynamic support and resistance levels.
When a shorter EMA crosses above a longer EMA, the bullish crossover suggests improving trend direction. Price holding above both averages after breaking resistance offers additional context.
A trader examining BTC/USDT on Gate.com's spot trading chart can compare the EMA position, breakout candle, and trading volume before interpreting the setup.
How to Combine Breakout Indicators for Crypto Trading
Successful breakout strategies usually combine indicators measuring different market characteristics.
Consider a hypothetical cryptocurrency consolidating between $95 and $100.
-
Breakout level: A candle closes at $102, above the $100 resistance.
-
Volume confirmation: OBV rises alongside stronger trading activity.
-
Momentum confirmation: MACD remains above its signal line.
-
Volatility assessment: ATR increases, indicating wider price ranges.
-
Risk planning: Traders identify the invalidation level before considering entry and exit points.
Some traders wait for a successful retest of former resistance rather than entering immediately.
The relationship between volume and open interest can provide additional participation context in derivatives markets.
Historical resistance, recent swing highs, and measured-range projections may inform price targets. Fibonacci retracement levels, including 23.6%, 38.2%, and 61.8% derived from Fibonacci ratios and the golden ratio, can help identify potential pullback zones.
Common Mistakes When Using Breakout Indicators
The biggest mistake is treating a single indicator as confirmation.
A Bollinger Band breakout without supporting volume may reverse. MACD crossovers can arrive late, while rising ATR can accompany either buying or selling pressure.
Liquidity also matters. Thin order books can produce sudden price spikes and slippage, particularly during volatile market conditions.
Technical analysis should be supported by sensible risk management, and fundamental analysis can help assess whether wider market developments support the move.
Conclusion
The best breakout indicators for crypto combine price-range analysis, volume confirmation, volatility measurement, and momentum assessment.
Donchian Channels identify breakout boundaries, OBV evaluates market participation, and ATR measures expanding volatility. MACD, RSI, and moving averages add directional context.
No combination guarantees a successful breakout. Waiting for candle confirmation, assessing liquidity, and defining risk before entering are more practical than relying on isolated buy or sell signals.
Frequently Asked Questions
What is the most accurate breakout indicator for crypto trading?
No breakout indicator is universally the most accurate. Donchian Channels identify price-range breaks clearly, while OBV and ATR help evaluate participation and volatility. Accuracy depends on market conditions, timeframe, and confirmation rules.
Which momentum indicators confirm crypto breakouts?
MACD, RSI, and the Stochastic Oscillator are commonly used momentum indicators. MACD evaluates changes in trend momentum, while RSI and Stochastic readings help assess the strength and positioning of recent price movements.
Can Fibonacci retracement levels identify breakouts?
Fibonacci retracement levels mainly identify potential support and resistance during pullbacks. Traders often monitor 23.6%, 38.2%, 50%, and 61.8% levels, although 50% isn't a Fibonacci ratio. These levels require price-action confirmation.
How can traders avoid false breakouts?
Traders can wait for a candle close beyond support or resistance, assess volume confirmation, and monitor whether price holds the broken level. These steps may filter weak signals but cannot prevent every fakeout.
Is VWAP useful for intraday breakout trading?
Yes. Volume-Weighted Average Price (VWAP) calculates the average traded price weighted by volume. Price holding above VWAP during an upward breakout can support an intraday bullish interpretation, but VWAP alone doesn't establish breakout strength.
Does ADX help confirm breakout strength?
The Average Directional Index (ADX) measures trend strength without indicating direction. A rising ADX can support an emerging breakout trend, while falling ADX may signal weakening trend strength. Directional indicators or price structure are still needed.
Disclaimer
This content is for educational purposes only and does not constitute financial or investment advice. Cryptocurrency trading involves significant market risk. Technical indicators rely on historical price and volume data and cannot guarantee future performance. Trading products and availability may differ by jurisdiction.







