
Square
Following
Hot
News
Notifications
Profile
Share your thoughts
placeholder
Article
Crypto traders moving into US stocks should know some of the rules. For example, US stock market halts follow specific rules, and big moves up or down can affect trading🤑🤓
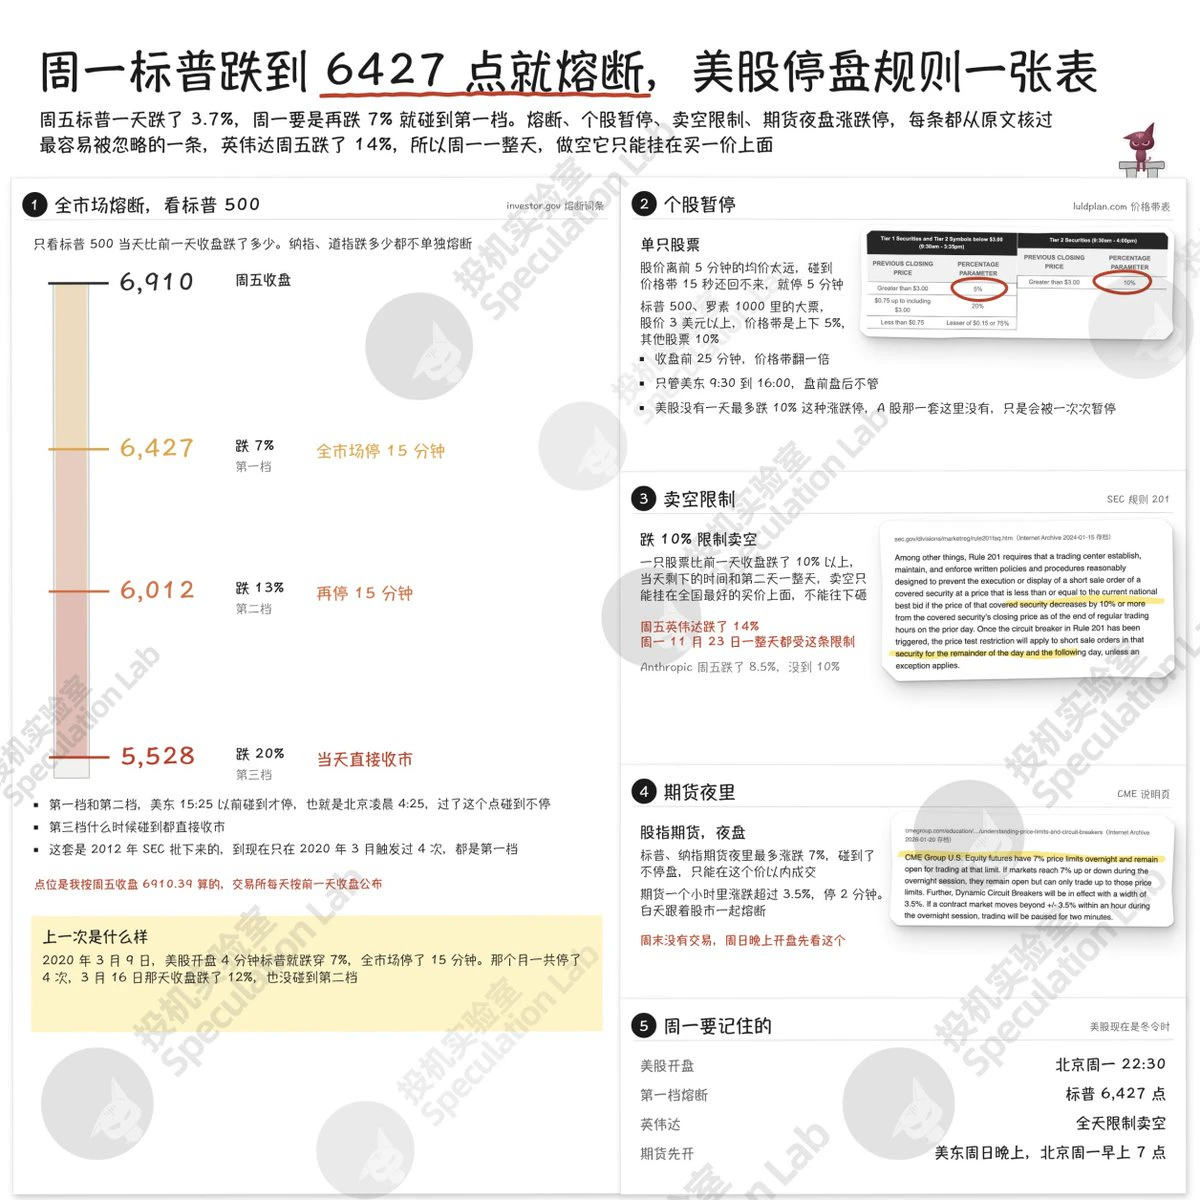
The S&P 500 fell 3.7% on Friday. If it falls another 7% on Monday, to 6427 points, the entire US market will halt for 15 minutes. Nvidia fell 14% on Friday, so shorting it will be restricted all day Monday.
I’ve compiled the US stock market halt rules into a table.
Market-wide circuit breakers are based only on the S&P 500: a 7% drop from the previous day’s close triggers a 15-minute halt, a 13% drop triggers another 15-mi
post-image
SPX+0.33%
NVDA-13.84%
  • 1
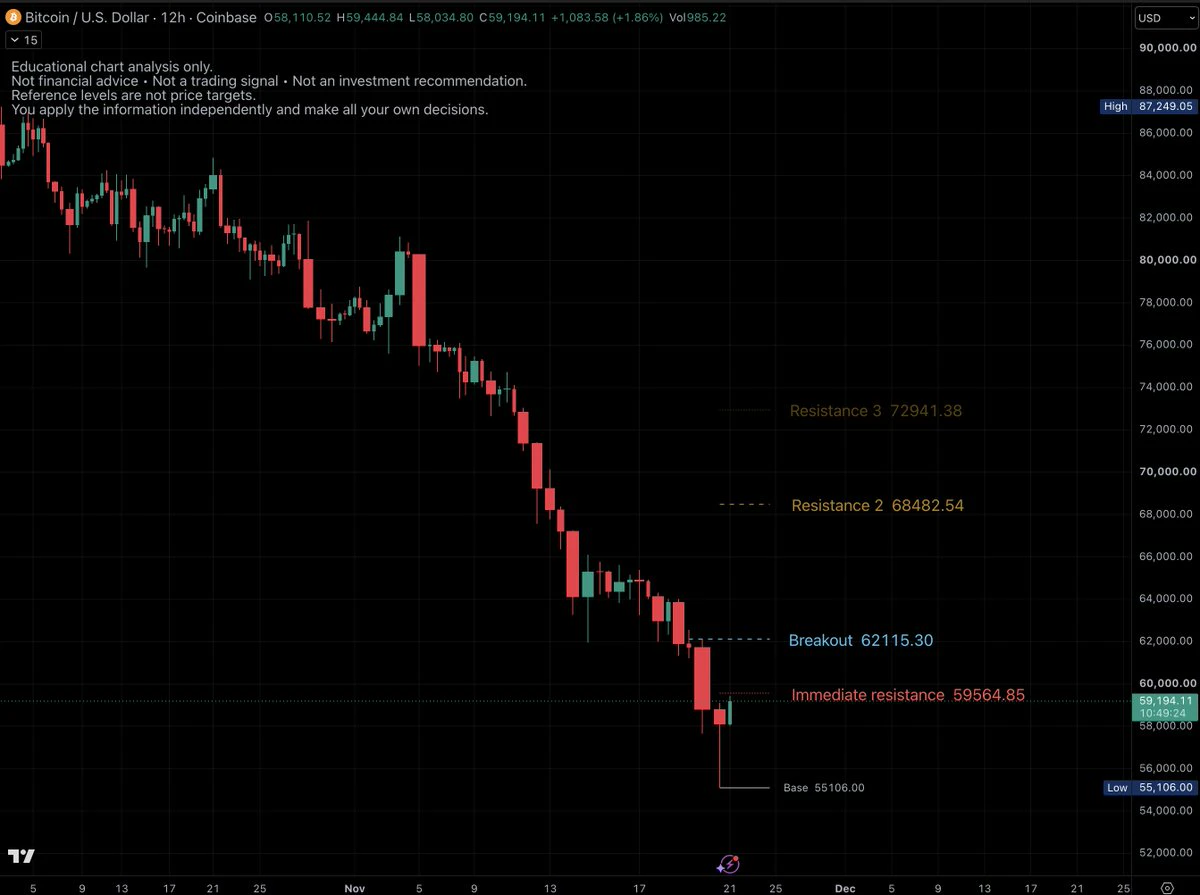
BTC:
No new daily close.
A new low happens when tons of stops near a major support push the price lower.
$68k has a higher probability.
#Bitcoin #Crypto
post-image
BTC-0.67%
Trenches
FIONA
F
bade
b
FIONA
B34n...pump
Market Cap
$.
Change
.
24h Vol
$.
Holders
.
PIEVERSE
P
bade
b
PIEVERSE
0x0e...25a9
Market Cap
$.
Change
.
24h Vol
$.
Holders
.
mihao
m
bade
b
mihao
4Cxj...pump
Market Cap
$.
Change
.
24h Vol
$.
Holders
.
IDOL
I
bade
b
IDOL
0x3b...ab07
Market Cap
$.
Change
.
24h Vol
$.
Holders
.
CLAUDIA
C
bade
b
CLAUDIA
2j5S...W2ZM
Market Cap
$.
Change
.
24h Vol
$.
Holders
.
#NvidiaDropsNearly14Percent #ShareWeekly

NVIDIA at $128.45: Is This a Recovery Attempt or Just a Temporary Bounce After a Historic Sell-Off?

NVIDIA is entering a critical phase. After one of its most painful trading sessions in years, NVDA has moved back to approximately $128.45, showing some recovery from Friday's closing price of $125.53. However, the bigger question is whether buyers are finally returning or whether the market is simply taking a short break before another potential decline.

In my view, this is no longer just a technical correction. It is a combination of changing invest
NVDA-13.84%
BTC-0.67%
This Week’s Live Trading Summary
33 trades this week: 29 wins and 4 losses, capturing 252 points of profit!

This week, I mainly followed the trend and took short positions. I accurately gauged intraday highs and lows, and successfully banked profits on every swing trade. I strictly followed risk controls and take-profit rules, with no aggressive, impulsive entries. Trading remained steady, and overall returns grew consistently this week. $XAU #黄金 #BTCETFOutflowsExtendTo3Days
XAU+0.38%
Another one entering the market $BLESS
Give me a happiness candle 💰, it rose 22% in a few seconds. Keep a close eye on it and lock in your profits. Congratulations 🎉🤑💰👇 has reached 0.012000; if it breaks through, it will continue rising to 0.0 10500
post-image
BLESS-2.00%
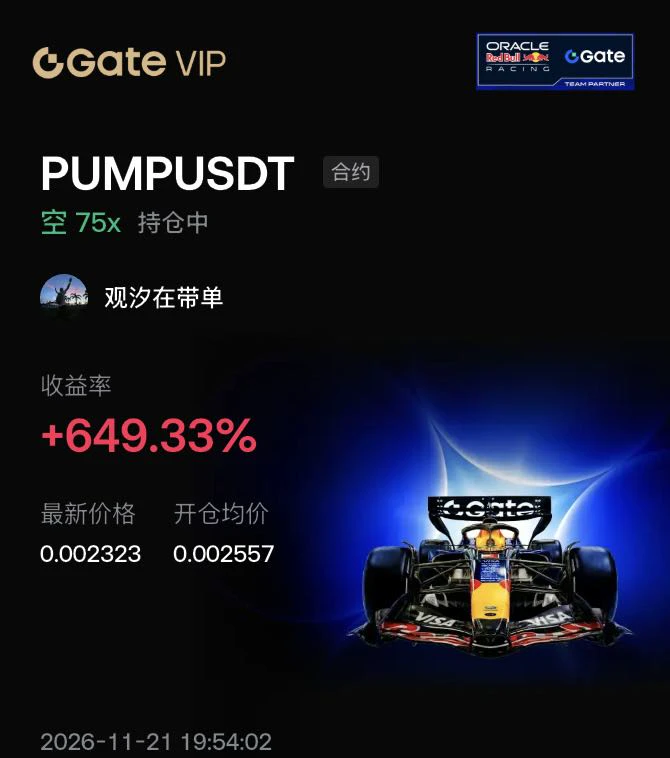
This PUMP trade, a 75x short has gained 649%!

Bro, I just made a cup of coffee and took a look at PUMPUSDT—this market is a real roller coaster.

The current price is 0.002323, and our average entry price is 0.002557. We’re holding a 75x leveraged short, with a bright red +649.33% return—so satisfying.
$BTC
Entry: Around 0.002557, with a bearish crossover confirmed by the candlestick chart; placed a short near the highs.

Take-profit: At the current 0.002323, some profits have already been secured; the next target is the previous low support.

Stop-loss: Set strictly above the previous high
post-image
BTC-0.65%
ETH-1.23%
SOL-0.74%
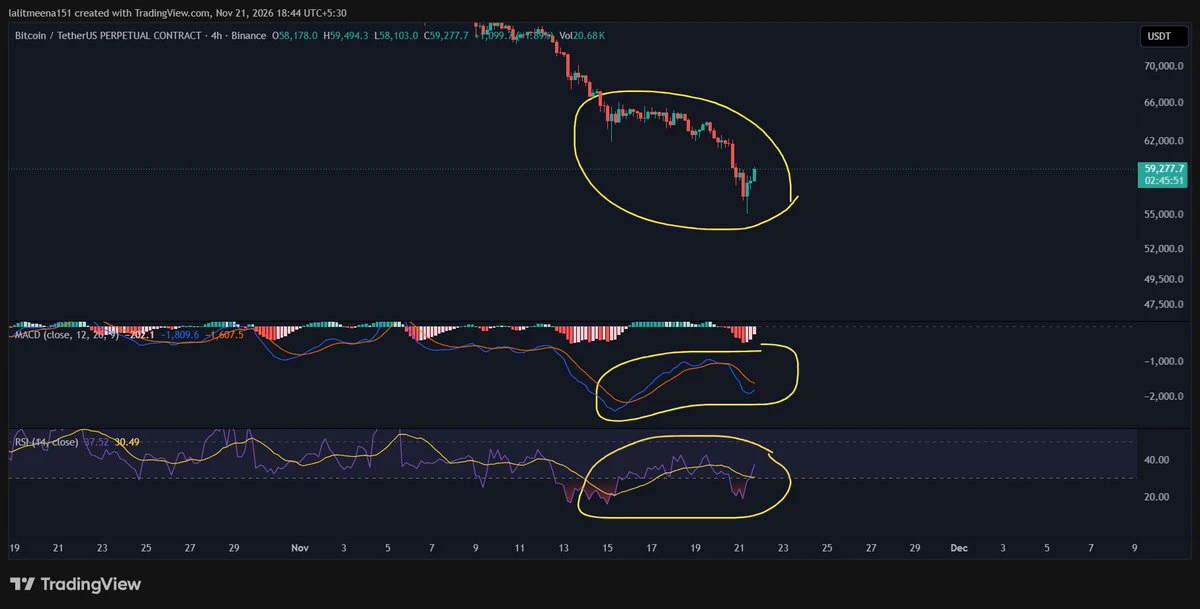
$BTC Bullish Divergence may form if MACD take Crossover
post-image
BTC-0.67%
You shouldn't touch projects Sun Ge is behind
You really should listen more to what Sun Ge says
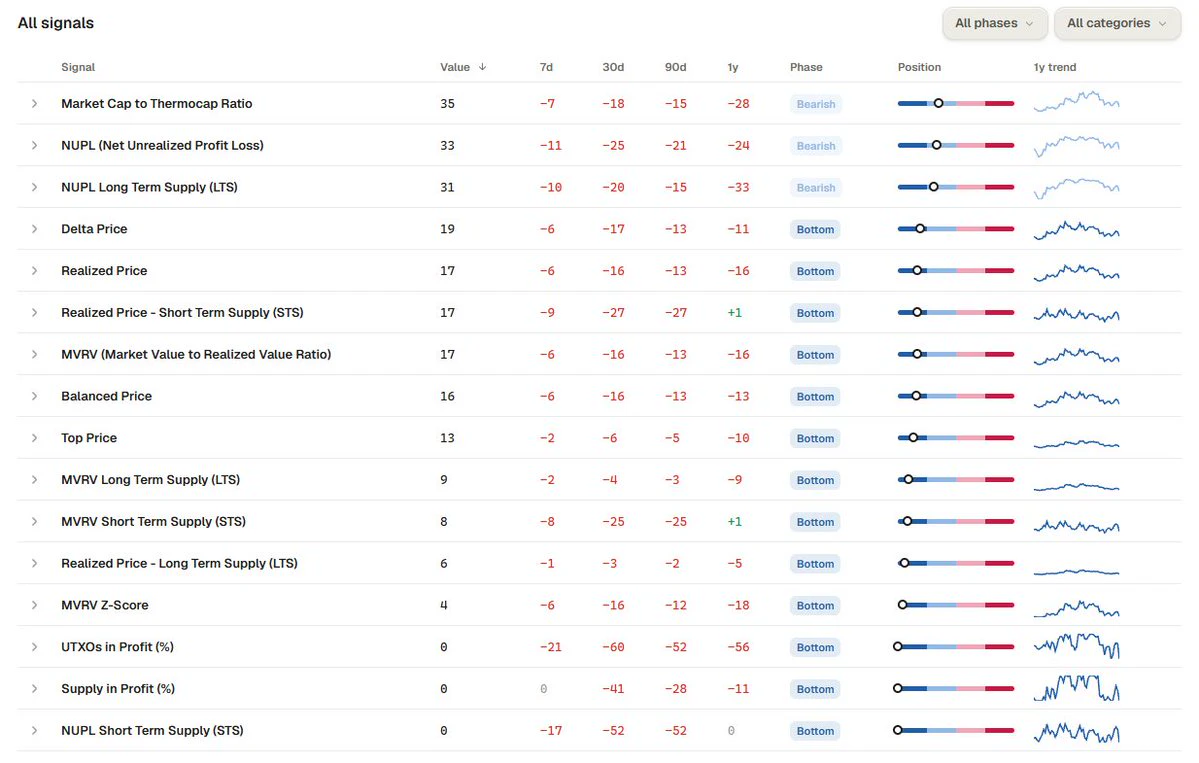
Given that we’re still following the 4 year cycle despite this cycle being longer,

It’s worth noting that 81% of historical cycle metrics are signalling that
$BTC
is close to a macro bottom.

Now that the 57K low has been swept, we could bottom anywhere between 40K and 55K.
post-image
BTC-0.67%
  • 2
#BTCBreaksBelow60K

BITCOIN BELOW $60,000: THE MARKET IS TESTING WHO IS STILL WILLING TO BUY

📊 BEFORE VS. NOW: WHAT HAS CHANGED?

Before November 20, Bitcoin was trading above the psychologically important $60,000 mark. That level represented more than a round number. It was also a point where market participants could measure confidence, demand and the strength of the ongoing recovery.

Now, the situation is different. Bitcoin has fallen below $60,000 for the first time since July, bringing a new challenge for buyers. The November 20 decline happened alongside weakness in technology stocks
post-image
BTC-0.67%
IBIT-5.97%
URGENT BTC EMERGENCY: Fed Rate Hike Fear & ETF Outflows Spark Massive Dump!
live-cover
LIVE1,726
BTC-0.67%
Arbitrum One’s Stablecoin Market Cap Increased by $327.4 Million Over the Past 7 Days
live-cover
LIVE2,049
BTC-0.67%
ETH-1.26%
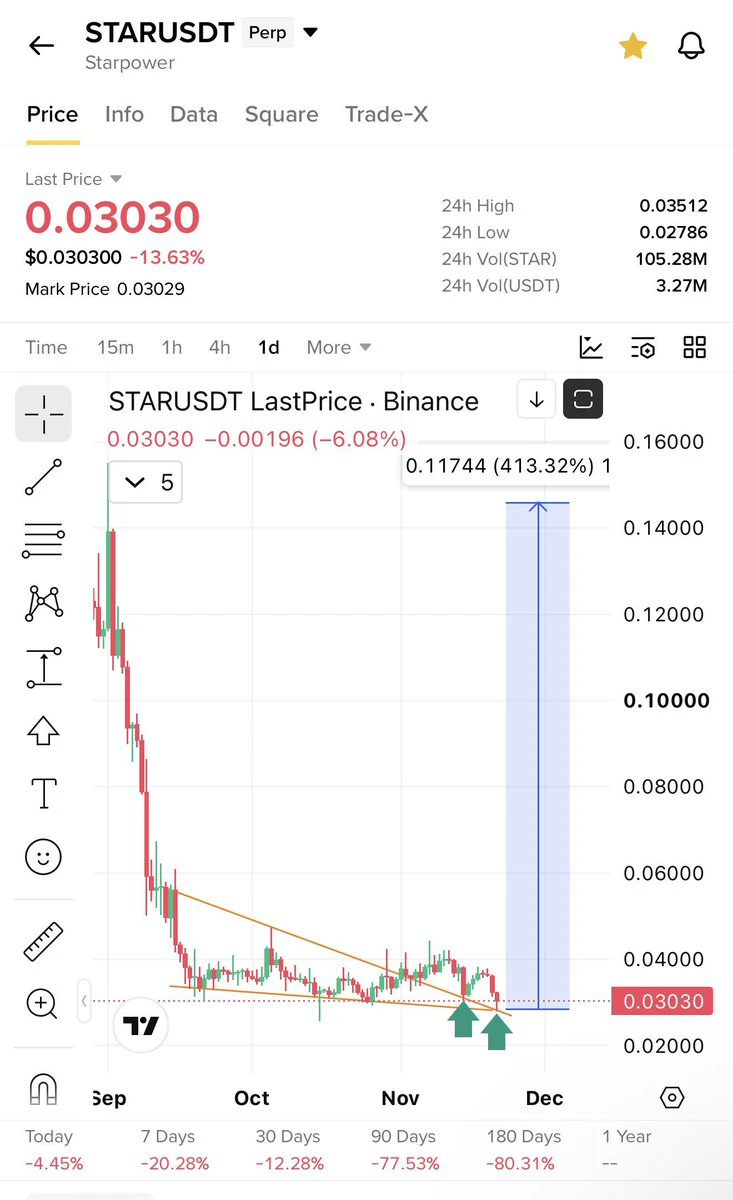
$Star still one of the best retest coin
With fully bottomed like $Evaa
Added more here near absolute bottom
Will see u guys up few xs
post-image
EVAA-0.49%
$HOT — Short entry: 0.0003461 Take-profit 1: 0.0003374 Take-profit 2: 0.0003288 Stop-loss: 0.0003599 Selling pressure has dominated recent price action, so any rebound may struggle to hold its gains.
post-image
HOT-1.97%
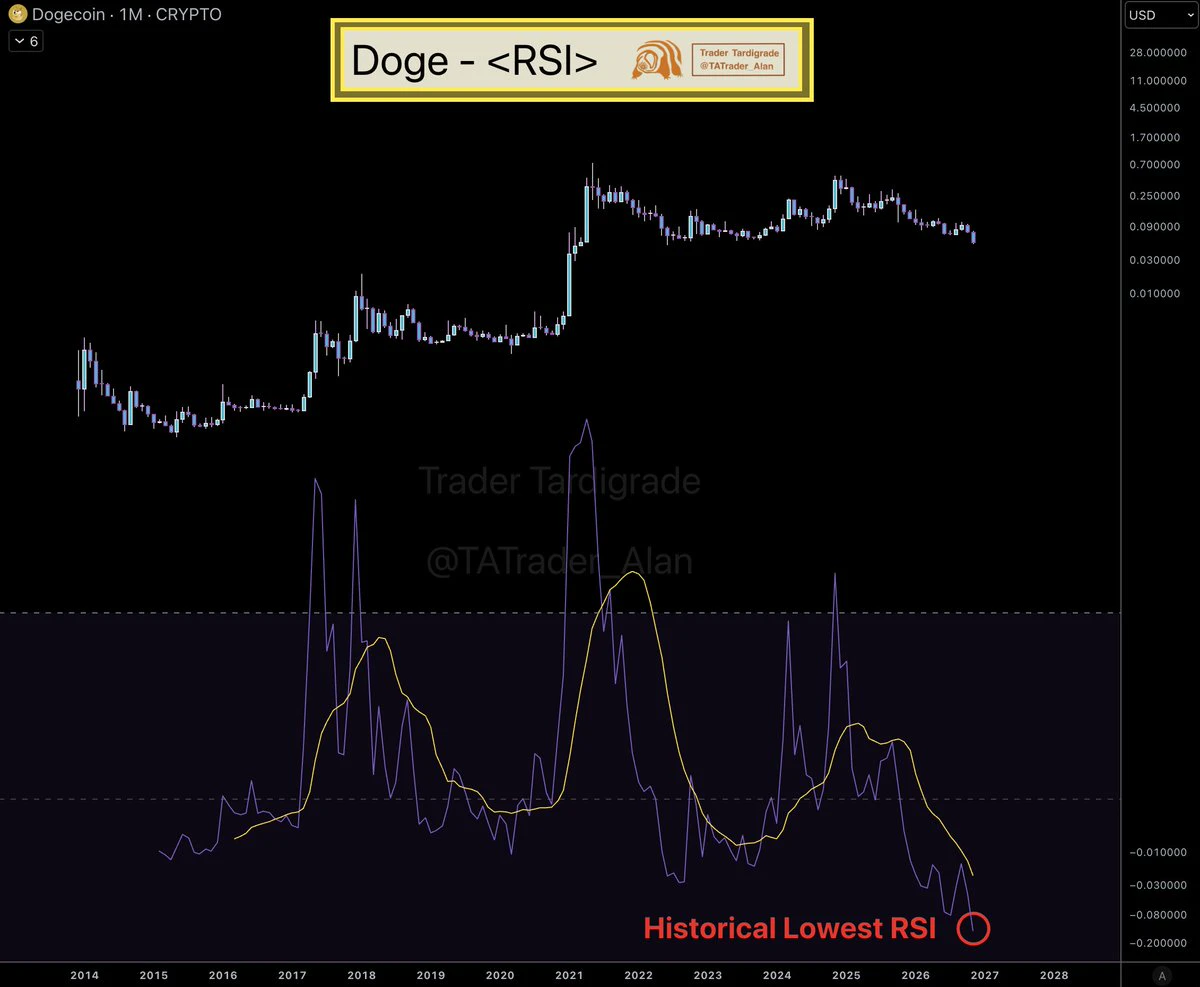
$DOGE /monthly
RSI is printing its lowest reading in history ❇️
Even the 2015 and 2022 lows never got this low. Price hasn't dropped into the oversold zone like this before.
No guarantee, but I won't sell here. I'm buying 🚀
post-image
DOGE-0.22%
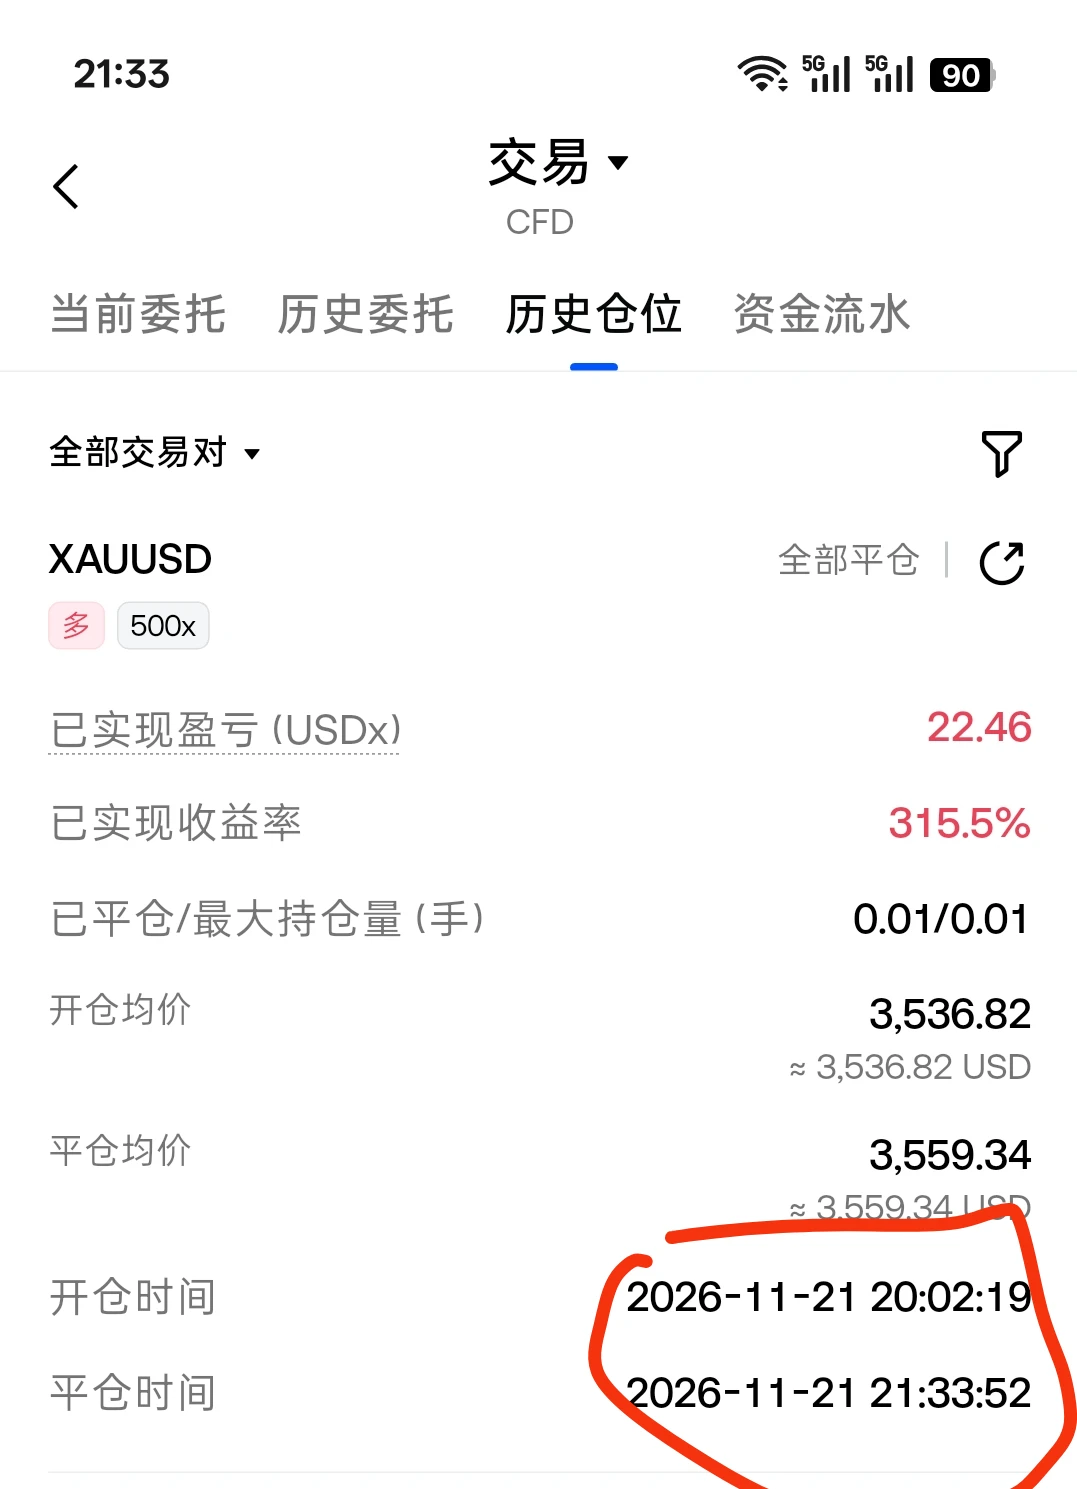
I can make money just by analyzing price action, without looking at any news or other market information. With technical analysis this solid, I easily banked 22 points, okay? An hour and a half into the trade, analyst Lin Yan is on the move
post-image
#GateDirectIPOPhase3ANTAllocates92100Shares #ShareWeekly

ANT After the IPO: $200 Billion in Unlocked Liquidity, Massive Share Supply, and What Comes Next?

The end of the $ANT IPO trading period marks the beginning of a much more complicated phase for the market. While the listing attracted enormous attention and generated significant trading activity, the more important question now is not simply how high or low ANT can trade. It is how much liquidity has been released, how much additional supply is approaching, and whether institutional demand can absorb the selling pressure over the comin
ANT+0.00%
  • 1
Ad · 🖤 Last call: LuxAlgo's Black Friday ends Sunday 11:59 PM ET. Up to 75% off yearly, and Ultra adds up to $350 of Quant AI usage 👉
post-image
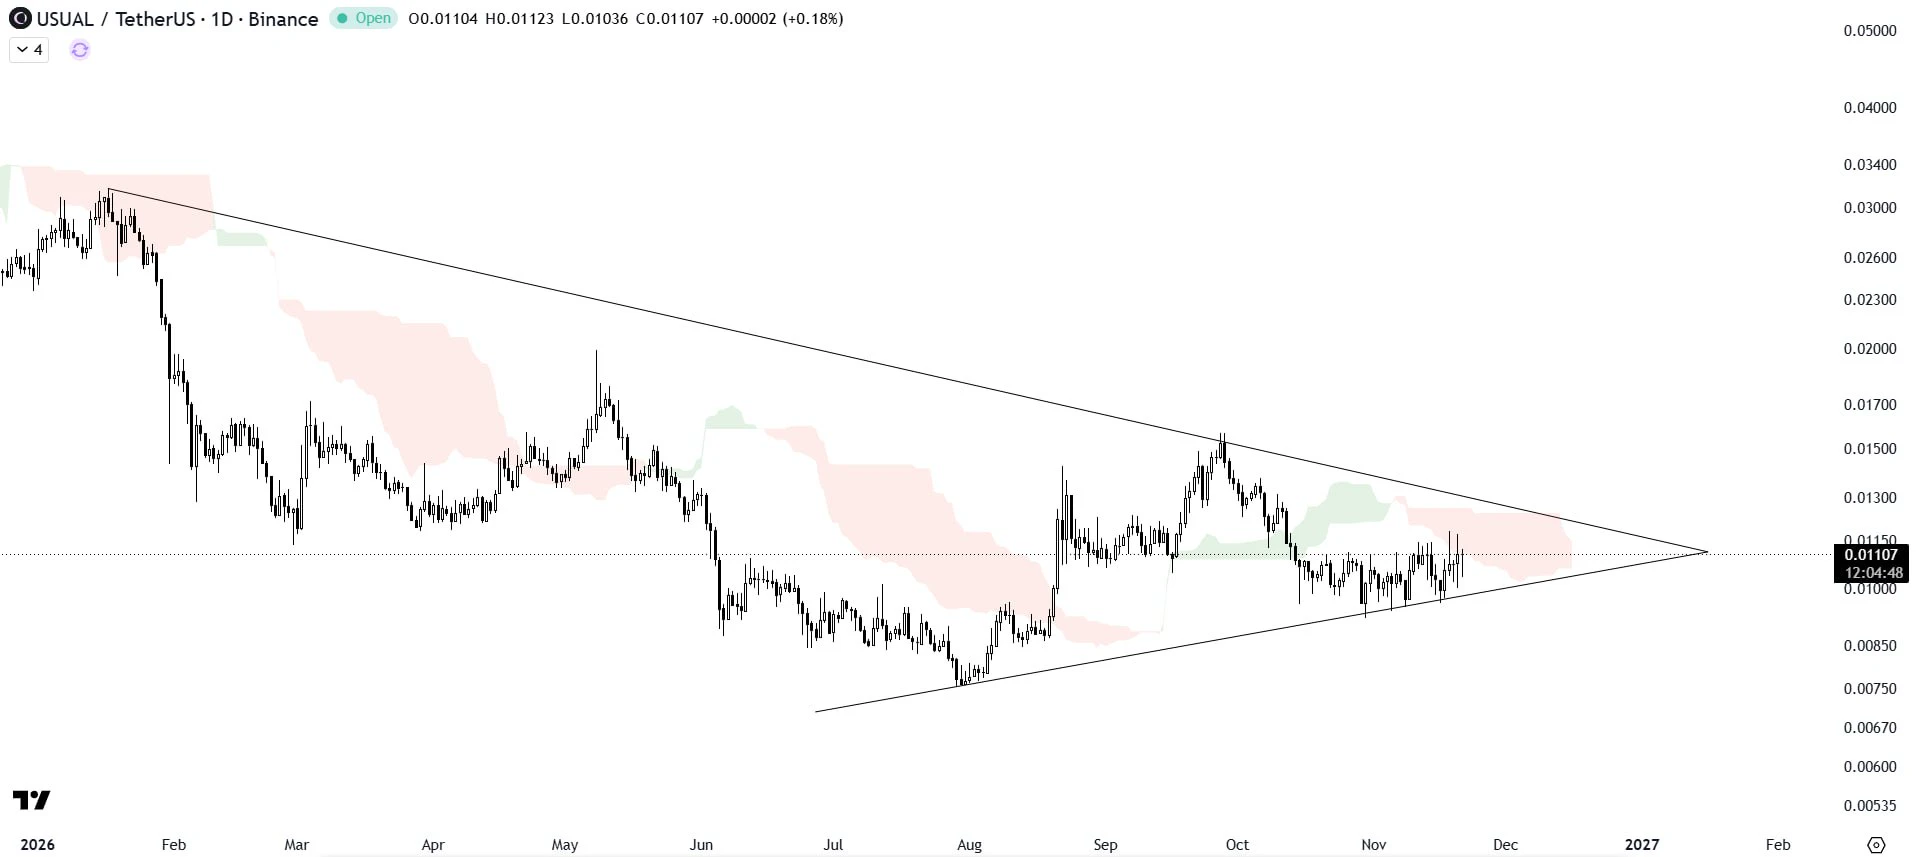
$USUAL /USDT is building momentum!

Triangle support is holding strong, keeping the recovery alive.

The real bullish confirmation comes with a breakout above the triangle resistance and Ichimoku cloud.

#BTCBreaksBelow60K #GateDirectIPOPhase3ANTAllocates92100Shares #NvidiaDropsNearly14Percent #CookBacksFurtherRateHikes
post-image
USUAL+4.14%
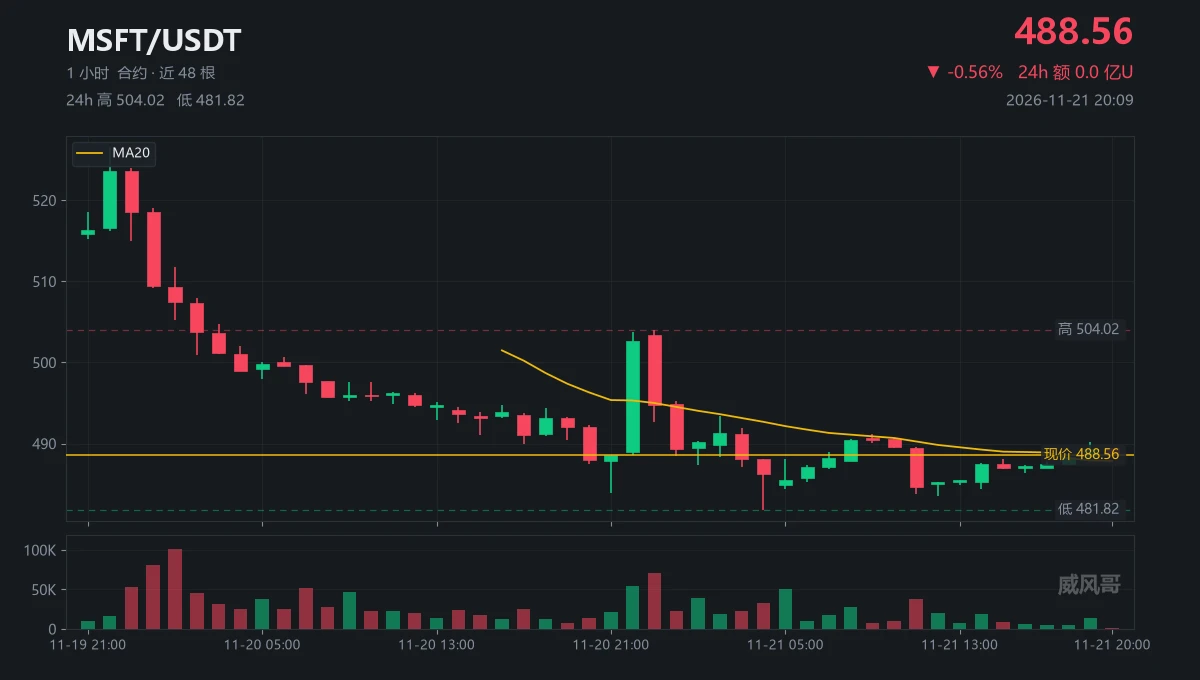
Next door, $ETH moved 100 overnight; over here, $MSFT moved 44.77 in a day.
Who’s moving, and who’s asleep?
At 22:00, that 54,000-contract candle pushed up to 503.72. Why didn’t I catch the follow-through?
At 23:00, another 70,000 contracts reached 504.02. Why did it still close at 494.81?
Two consecutive surges, neither one held. Was it a breakout, or did the train leave without picking anyone up?
When it slid to 481.82 at 04:00, where was the volume?
From 17:00 to 19:00, 24,000 contracts over three hours. Was the market closed, or was nobody watching?
Was 2.6 million U in 24-hour total vol
post-image
MSFT+0.59%
  • 1
  • 1
Load More

Join 40 M users in our growing community

⚡️ Join 40 M users in the crypto craze discussion

💬 Engage with your favorite top creators

👍 See what interests you

Trending Topics

BTCBreaksBelow60K

2.1M Views29.6K Discussing

BTC fell below $60,000 on November 20 for the first time since July, alongside a tech stock selloff and broader pressure on risk assets. Will $60K become resistance, or can BTC quickly reclaim it? What price or volume signals would convince you that selling pressure is easing?

GateDirectIPOPhase3ANTAllocates92100Shares

762K Views4.9K Discussing

NvidiaDropsNearly14Percent

319.9K Views7.5K Discussing

View More