Square
Following
Hot
News
Profile

discovery

vip
Peak Tier 5
Memecoin Hunter
Diamond Hands
I will be patient to win.\n‎
247
Following
2.1k
Followers
212.6k
Liked
My One Gate Moment: Hold Anything. Witness Gate's biggest evolution in 13 years with me. One Gate, Everything Money. #Gate #OneGate #HoldAnything https://www.gate.com/activities/everything-money-ceremony?ref_type=165&ch=Direct&ref=BVIRBA8M&utm_cmp=BIPdAc5p
post-image
It's not just a bond selloff. It's the price of money in the world's largest economy hitting a level that a generation of investors has never had to navigate.
The 30-year Treasury yield climbed to 5.595% on Tuesday, the highest since 2002. The long bond has now risen for six consecutive sessions, pushing past the 5.6% mark that once looked like a ceiling and turning it into a floor. The move is not happening in isolation. The 10-year yield is hovering near 5.27%, its highest in 19 years. The average 30-year fixed mortgage rate has already broken through 7.45%. This is a repricing of long-term
User_any
It's not just a bond selloff. It's the price of money in the world's largest economy hitting a level that a generation of investors has never had to navigate.
The 30-year Treasury yield climbed to 5.595% on Tuesday, the highest since 2002. The long bond has now risen for six consecutive sessions, pushing past the 5.6% mark that once looked like a ceiling and turning it into a floor. The move is not happening in isolation. The 10-year yield is hovering near 5.27%, its highest in 19 years. The average 30-year fixed mortgage rate has already broken through 7.45%. This is a repricing of long-term borrowing costs across the entire economy, and it is happening fast.
Two forces are driving it, and they are reinforcing each other. The first is energy. Elevated oil prices tied to the conflict in the Middle East are feeding directly into inflation expectations. Higher energy costs filter into transportation, manufacturing, and consumer prices, which makes it harder for inflation to fall and harder for the Fed to step back from tight policy. The second is supply. Corporate America is issuing debt at a record pace, and that wave of issuance is competing with Treasuries for the same pool of capital. Investment-grade companies sold roughly $1.68 trillion in bonds through August, up 27% from a year earlier. When the private sector is borrowing that aggressively, the government has to offer higher yields to attract buyers.
There is a third factor that is harder to quantify but just as important. Analysts at RBC Capital Markets have noted that there are no real technical levels for investors to anchor on in this zone. The market is in a vacuum. When there is no clear support, selling can accelerate because there is nothing to stop it. That is how you get from 5.3% to 5.6% in a matter of days.
What does this mean beyond the bond market? For anyone with a mortgage, a credit card, or a car loan, it means borrowing costs are rising again. For equity investors, it means the discount rate used to value future profits is going up, which compresses valuations. When the risk-free rate is 5.6%, the bar for holding a stock that pays no dividend gets higher. That is why the S&P 500 fell 0.5% on the same day the 30-year yield broke through 5.6%.
The survey data suggests the market thinks this is not over. More than half of respondents in a Bloomberg poll expect the 30-year yield to touch 6% before the end of 2026. BlackRock has taken a low allocation to long-dated Treasuries in its latest outlook. The message is clear: the long end of the curve is not a place investors want to be right now, and the burden of proof is on the data to change that.
Friday's jobs report and the coming inflation prints will decide whether this is the peak or another step higher. For now, the market is pricing in the possibility that the era of cheap long-term money is not coming back anytime soon. And that changes the calculus for everything from housing to corporate capital spending to the valuation of every asset that depends on a discount rate.
DYOR 🔎 NFA ✔️
#US30-YearTreasuryYieldHits5.595%,HighestSince2002

repost-content-media
US500+0.27%
BLK-0.41%
$QNT / USDT - 300.70 +22.90% - RWA Leader
QNT just printed a new local high at 327.41 after the 373.21 wick on Sept 27. This is the strongest RWA runner right now.
Spot 300.70 +22.90%, perp 300.18 +22.36%, 24h high 327.41, low 243.17, volume 89.80K QNT, turnover 25.78M. On your previous screenshot it was 164.16, now it is 300.70, that is +83% in one day between your two screenshots.
Performance is extreme: Today 12.69%, 7 days 324.72%, 30 days 390.94%, 90 days 346.14%, 180 days 289.46%, 1 year 196.61%. This outruns every major alt.
The fundamental driver is confirmed and getting stronger:
The
post-image
QNT+22.64%
$NEAR USDT - 5.367 +9.37%
NEAR is leading the altcoin run today.
Spot at 5.367 +9.37%, perp at 5.3652 +9.37%, 24h high 5.500, low 4.763, volume 8.00M NEAR, turnover 41.15M. This move is a continuation of what started mid-September.
From September 1 to 15, NEAR was grinding between 2.28 and 2.82. Then it broke. On September 15 it was 2.34, on September 18 it hit 3.45, a 45% move in three days. The full impulse was from 2.29 on September 16 to 4.8 on September 23, a 110% rally in less than 10 days, levels not seen since February. The driver is on-chain, not hype: NEAR Intents, its cross-chain
post-image
NEAR+9.05%
$BTC
• BTC at 84,312.4 dollars, +1.36% in 24h, high 85,632.2, low 82,953.5, volume 7.47K BTC.
• Perp at 84,282.7 dollars, +1.48%, turnover 628.89M dollars. Spot outflow of 5.14M dollars shows less sell pressure.
• Resistance 84,777 - 87,401 dollars, support 83,800 EMA cluster - 82,625 dollars.
BTC bounced from low 82,953 dollars to 84,312 dollars today. Fund inflow for large-cap spot products stayed strong last week, helping price hold above 83,800 dollars.
On-chain data shows more coins left trading venues than entered. Large wallet outflows around 318k for SOL and similar pattern for BTC
BTC+1.05%
  • 7
  • 1
$SUI — Price may rebound if support holds.
Long $SUI
Entry: 1.14–1.16
SL: 1.09
TP1: 1.184
TP2: 1.24
TP3: 1.29
If 1.10–1.14 support holds, buyers may push price toward 1.184–1.24.
Trade $SUI here 👇 ‌$NVDA ‌$MU ‌$USDJPY ‌
Original content no longer visible
SUI+3.40%
NVDA+1.29%
MU+0.30%
  • 9
  • 1
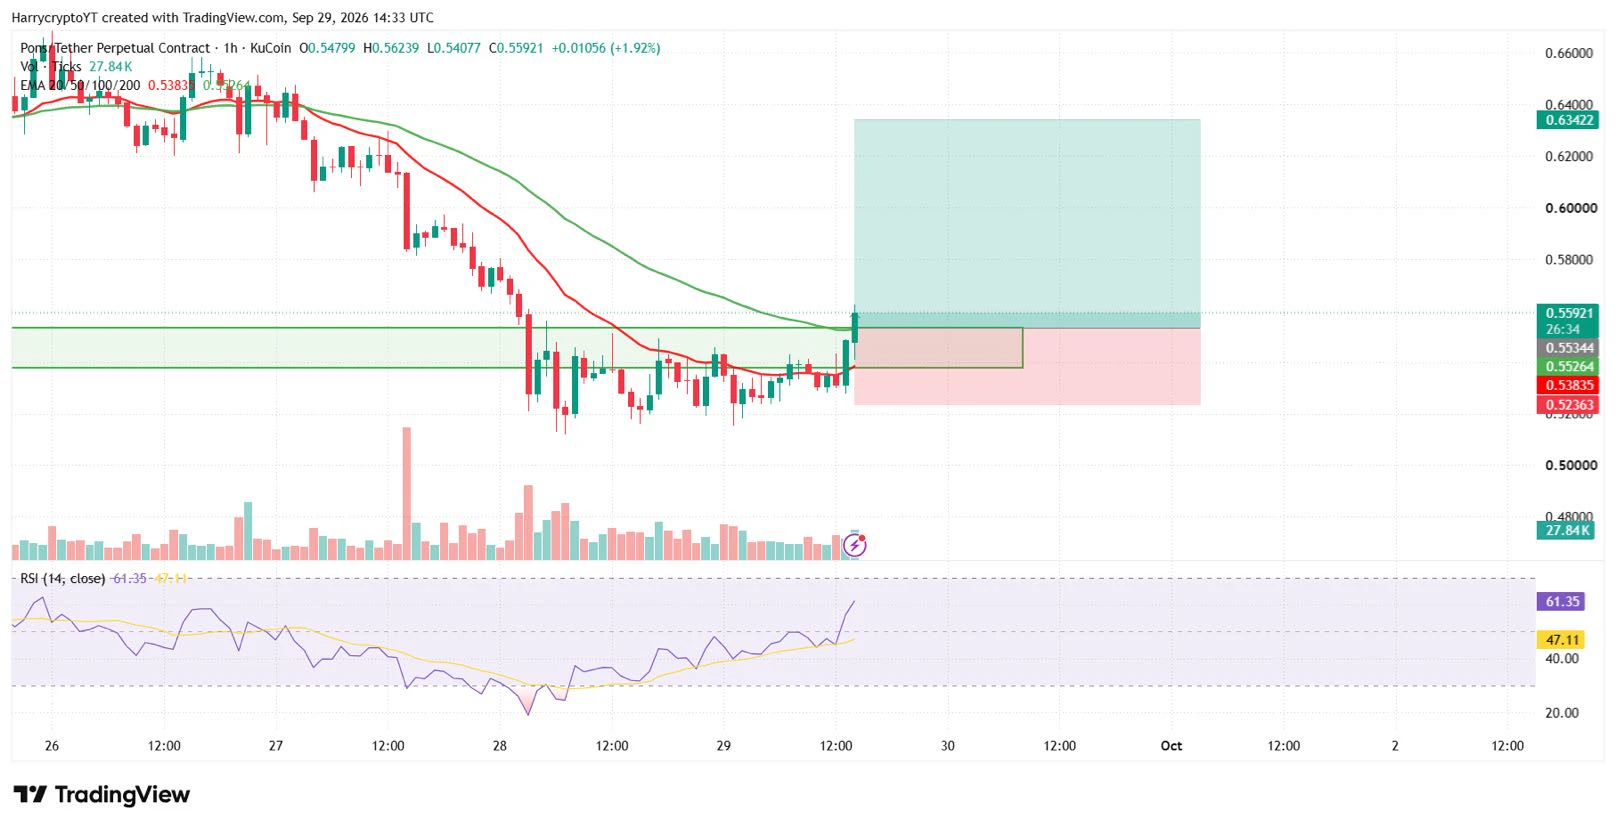
🚀 PONS/USDT LONG TRADE SETUP 🚀
📍 Entry: 0.55 – 0.56
🛑 SL: 0.525
🎯 TP1: 0.574
🎯 TP2: 0.581
🎯 TP3: 0.600
🎯 TP4: 0.628
⚠️ Risk: 1% Only
Trade with proper risk management. DYOR & manage your position size wisely. 📊🔥
#Crypto #Trading #Long #Futures
HarryCrypto
🚀 PONS/USDT LONG TRADE SETUP 🚀
📍 Entry: 0.55 – 0.56
🛑 SL: 0.525
🎯 TP1: 0.574
🎯 TP2: 0.581
🎯 TP3: 0.600
🎯 TP4: 0.628
⚠️ Risk: 1% Only
Trade with proper risk management. DYOR & manage your position size wisely. 📊🔥
#Crypto #Trading #Long #Futures
repost-content-media
PONS+0.93%
  • 12
  • 1
#OpenAIAnnualRecurringRevenueNears$70B
is becoming another major milestone for the AI industry, highlighting how quickly demand for generative AI is translating into commercial revenue.
OpenAI’s annualized revenue run rate is approaching $70 billion, according to sources cited by Reuters and Axios. The reported run rate has increased by more than 70% since the beginning of Q3, while enterprise sales have more than doubled since July.
The scale of that acceleration is significant because enterprise adoption is becoming one of the most important battlegrounds in artificial intelligence. Compani
PrinceMagsi786
#OpenAIAnnualRecurringRevenueNears$70B
is becoming another major milestone for the AI industry, highlighting how quickly demand for generative AI is translating into commercial revenue.
OpenAI’s annualized revenue run rate is approaching $70 billion, according to sources cited by Reuters and Axios. The reported run rate has increased by more than 70% since the beginning of Q3, while enterprise sales have more than doubled since July.
The scale of that acceleration is significant because enterprise adoption is becoming one of the most important battlegrounds in artificial intelligence. Companies are increasingly using AI for software development, customer support, research, data analysis, automation, productivity and other business workflows. OpenAI’s reported increase in business revenue suggests that AI is continuing to move from experimentation toward broader commercial deployment.
Consumer demand is also playing a major role. According to the source cited by Reuters, OpenAI generated more consumer revenue during Q3 than it generated during the entirety of the previous year. That provides another indication of how quickly usage and monetization are expanding across both individual and business customers.
But there is an important distinction between annualized revenue run rate and actual annual revenue.
A run rate is an extrapolation of current revenue performance over a full year. It does not mean OpenAI has already collected $70 billion in revenue during 2026. Reuters specifically noted that this metric can sometimes be misleading because it may be calculated by annualizing a shorter period of sales.
That distinction becomes particularly important when evaluating a company operating in an exceptionally fast-growing industry.
OpenAI is simultaneously expanding revenue and investing heavily in computing infrastructure. Advanced AI models require enormous amounts of GPUs, high-bandwidth memory, networking equipment, data-center capacity and electricity. As model usage increases, infrastructure requirements can increase alongside revenue.
This creates one of the biggest questions surrounding the AI business model:
How much revenue can AI companies generate relative to the enormous cost of operating and scaling AI infrastructure?
Rapid revenue growth is an important part of the equation, but profitability and cash generation ultimately depend on costs as well.
The OpenAI figure is also significant for the wider technology ecosystem because OpenAI relies on a huge network of infrastructure and technology partners. Oracle, for example, is a major computing partner, and Reuters reported that Oracle shares rose 5.3% following the news. Analyst Gil Luria said OpenAI represents around half of Oracle’s compute backlog, illustrating how closely the financial performance of AI model companies can be connected to data-center and cloud infrastructure providers.
This creates a broader AI investment chain.
AI models → cloud computing → GPUs → memory → networking → data centers → electricity
When demand for AI applications increases, the effects can spread across that entire ecosystem.
That is why OpenAI’s reported revenue acceleration matters beyond the company itself. Investors are increasingly watching AI model companies as indicators of whether the massive spending on AI infrastructure is translating into real commercial demand.
Competition is also intensifying.
OpenAI is competing with companies such as Anthropic and other major AI providers for enterprise customers, developers and consumer usage. The Information reported that OpenAI’s annualized revenue pace was nearing $70 billion after growing around 70% from the beginning of Q3, while Anthropic’s annualized pace had reportedly passed $65 billion in July.
The competitive environment means pricing, model performance, developer adoption and enterprise integration will remain critical.
OpenAI has also been reducing model prices in recent months, according to The Information, while improvements in model efficiency and growing interest in coding products such as Codex have contributed to its commercial momentum.
Lower prices can potentially expand the addressable market by making AI tools more affordable for businesses and developers, but they can also put pressure on revenue per unit of usage. The long-term economics therefore depend on whether growing usage can outpace reductions in pricing and increases in infrastructure costs.
This is where the next stage of the AI cycle becomes especially interesting.
The first phase of generative AI focused heavily on model development and user adoption. The next phase is increasingly about monetization: turning AI usage into recurring enterprise contracts, subscriptions, developer revenue and embedded business workflows.
OpenAI’s reported numbers suggest that this commercialization phase is accelerating.
Enterprise growth is particularly important because business customers can generate recurring revenue through software subscriptions, API consumption and large-scale deployments. Once AI becomes integrated into internal systems, coding environments, customer-service operations or data workflows, usage can become much more deeply embedded in a company's operations.
That creates potential for recurring demand, although the durability of that demand still needs to be demonstrated over time.
The upcoming financial disclosures from major AI companies could provide the market with more information about this relationship between revenue growth and spending.
Both OpenAI and Anthropic are preparing for potential public-market activity, which could eventually provide investors with significantly more visibility into their revenue, expenses, capital requirements and cash flows.
Until then, private-company revenue figures should be treated as reported estimates rather than the same type of audited financial disclosure available from public companies.
For investors following the AI sector, several metrics will therefore remain important:
Revenue growth — Is commercial demand continuing to accelerate?
Enterprise adoption — Are businesses increasing spending on AI?
Consumer monetization — Can large user bases translate into sustainable recurring revenue?
Model pricing — Are lower prices expanding usage fast enough to offset lower revenue per unit?
Compute costs — How much infrastructure spending is required to support each additional dollar of revenue?
Gross margins and cash flow — Can revenue growth eventually translate into stronger financial efficiency?
Competition — How will OpenAI, Anthropic, Google and other AI providers compete for enterprise and developer demand?
These questions will determine how the market interprets the headline $70 billion figure.
The reported number is nevertheless a remarkable indication of the speed at which the AI economy is developing.
Only a few years ago, generative AI was primarily discussed as an emerging technology. Today, AI companies are building massive recurring-revenue businesses while simultaneously driving demand for billions of dollars of computing infrastructure.
That creates a feedback loop across the technology sector.
More users create more AI workloads.
More workloads require more compute.
More compute requires more chips, memory, networking and data centers.
And greater infrastructure capacity allows AI companies to serve even more customers.
The sustainability of that cycle will be one of the defining questions for the technology market over the coming years.
For now, #OpenAIAnnualRecurringRevenueNears$70B provides another important data point showing that commercial demand for AI is expanding at extraordinary speed.
The headline is impressive, but the deeper story is even more important: AI is increasingly becoming a large-scale commercial infrastructure industry, not simply a software trend.
The next phase will be about proving how efficiently that enormous demand can be converted into durable revenue, sustainable margins and long-term business value.
#OpenAIAnnualRecurringRevenueNears$70B #OpenAI #AI
repost-content-media
ORCL-0.31%
  • 17
  • 5
🔥 What are we talking about today? Gate Square’s trending topics have been updated!
🔹 U.S. core PCE and the final Q2 GDP reading will be released tonight! Will inflation and growth signals reshape rate-cut expectations?
🔹 Micron’s earnings report is due after market close tonight, with HBM4 and its 2027 outlook in focus. Can the AI memory rally continue?
🔹 $MRVL rises 4.5%, with AI hardware stocks broadly strengthening! Are funds continuing to spread from chips to optical modules and data centers?
🔹 U.S.-Iran talks have reached an impasse, while Brent rises above $106! With oil prices re
CryptoSpecto
🔥 What are we talking about today? Gate Square’s trending topics have been updated!
🔹 U.S. core PCE and the final Q2 GDP reading will be released tonight! Will inflation and growth signals reshape rate-cut expectations?
🔹 Micron’s earnings report is due after market close tonight, with HBM4 and its 2027 outlook in focus. Can the AI memory rally continue?
🔹 $MRVL rises 4.5%, with AI hardware stocks broadly strengthening! Are funds continuing to spread from chips to optical modules and data centers?
🔹 U.S.-Iran talks have reached an impasse, while Brent rises above $106! With oil prices returning to elevated levels, could inflationary pressure rise again?
Post with trending topics to receive traffic support and featured recommendations for high-quality content, and participate in content mining rewards.
💰 Data, earnings, AI, and geopolitics are all moving—if you have a view, come join the discussion:
https://www.gate.com/post/topic$BTC ‌$SOL ‌
repost-content-media
MU+0.30%
MRVL-1.12%
BTC+1.08%
SOL+1.10%
  • 28
  • 2
#Anthropic与SpaceX签署845亿美元算力协议 Spending $84.5 billion to lock in computing power! Anthropic bets on AI foundational infrastructure as the computing power race heats up
Anthropic’s IPO filing has revealed a computing power lease agreement with SpaceX worth up to $84.5 billion, with the agreement running through 2029. The company behind the Claude large language model is expected to invest at least $518 billion in AI infrastructure over the next decade. The computing power arms race is intensifying, with HBM memory prices expected to rise.
The competition in the AI industry appears on the surface
ThisIsTranslateContent:
#Anthropic与SpaceX签署845亿美元算力协议 Spending $84.5 billion to lock in computing power! Anthropic bets on AI foundational infrastructure as the computing power race heats up
Anthropic’s IPO filing has revealed a computing power lease agreement with SpaceX worth up to $84.5 billion, with the agreement running through 2029. The company behind the Claude large language model is expected to invest at least $518 billion in AI infrastructure over the next decade. The computing power arms race is intensifying, with HBM memory prices expected to rise.
The competition in the AI industry appears on the surface to be a contest between model capabilities and product experiences, but at its foundation lies a never-ending battle for computing power.
Anthropic’s latest IPO filing has dropped a bombshell: the company has signed a computing power lease agreement with SpaceX worth up to $84.5 billion, with the agreement remaining in effect through 2029.
Reuters reported, citing the prospectus, that this ultra-expensive computing power contract is far above the $45 billion previously estimated by the market. The filing also shows that Anthropic’s total investment in AI infrastructure over the next decade is expected to be no less than $518 billion.
These astonishing figures offer a direct view of the massive investment that leading large-model companies are making in computing resources.
What exactly is being purchased in this $84.5 billion computing power deal?
The agreement is essentially a lease of computing resources: Anthropic will lease NVIDIA GPU clusters at data centers owned by SpaceX for Claude-series large-model training, inference, and AI agent operations.
The agreement includes a flexible provision under which either party can terminate the partnership by giving 90 days’ advance notice.

Why doesn’t Anthropic build its own data centers and instead choose to lease computing power from SpaceX?
Building an ultra-large-scale computing cluster from scratch involves land, power supply, data center construction, and hardware procurement, making the process lengthy and financially demanding. Computing power leasing enables rapid access to massive GPU resources and quick expansion to match the explosive growth of large-model businesses. Amid highly volatile AI demand, flexible leasing can mitigate the risk of idle hardware.
However, this model also has drawbacks. The total cost of long-term leasing can ultimately far exceed that of building independently; control over computing resources is not in the company’s own hands, and any change in the partnership could directly affect the stability of model services. Leading companies are increasingly building their own facilities while also leasing extensively from external providers, making hybrid deployment the industry’s mainstream approach. 📌 📈 Expectations of higher HBM memory prices bring changes to the hardware supply chainThe computing power arms race continues to heat up, directly driving demand for upstream hardware. TrendForce predicts that the average price of HBM high-bandwidth memory will rise substantially in 2027. HBM is a core supporting component of GPUs, and both large-model training and concurrent inference by AI agents depend heavily on it. Major large-model companies are rushing to buy computing power, while GPU and HBM supply remains tight relative to demand. In the past, everyone focused on the software capabilities of large models; now, more and more people realize that without sufficient and stable computing power, even the best model algorithms cannot be deployed and operated. Computing power has become a strategic factor of production for AI companies. 📌 ⚖️ Computing power arms race: advantages and concerns coexistMassive investment in computing power brings highly visible benefits. Sufficient computing power can support models with larger parameter counts and longer context windows, while running large numbers of AI agents in parallel and accelerating model iteration. The stronger a company’s computing power reserves, the more room it has to continuously refine model capabilities and respond quickly to market demand.
However, massive computing power investment also creates hidden risks for the industry. Sky-high hardware costs raise the barrier to entry, while resources continue to concentrate among a small number of leading companies. Once commercialization revenue falls short of expectations, companies will face enormous financial pressure after large amounts of capital are spent on hardware procurement. At the same time, the electricity consumption and carbon emissions of operating large-scale GPU clusters are challenges that the global AI industry must address together.
Industry status and future development direction
Today, leading AI companies worldwide are securing computing power resources through multiple channels.
Anthropic’s list of partners includes multiple computing power providers, such as SpaceX, Google, Amazon, and Microsoft, reducing the risk of relying on a single provider.
The future computing power market will become more diversified, with multiple models coexisting, including self-built data centers, leasing from cloud providers, and third-party computing power services. Computing power will not expand indefinitely. In the long term, the industry cannot rely solely on piling up hardware to improve AI capabilities. Model lightweighting, inference optimization, and sparsification technologies can reduce computing power consumption. The simultaneous evolution of hardware and algorithms is the path to healthy development.
Computing power is the foundation, but the ultimate value of AI still depends on whether real-world applications can create genuine value.
Some say that AI competition is fundamentally a competition for computing power, while others believe algorithms and application scenarios are the core. Which view do you agree with more? Feel free to share your thoughts in the comments. $SPCX ‌
repost-content-media
  • 12
  • 3
Gate’s biggest evolution in its 13-year history—join us in witnessing it!
One Gate Witness Program
Hold freely, pay on the go, trade anytime.
No deposit or trading required. Log in to Gate, choose your sharing topic, complete a valid share, and claim the corresponding reward.
Unlock the witness numbers 1, 11, 111, 1,111, 11,111, and 111,111 to win 100 GT, F1 race tickets, and driver-signed merchandise.
Go from a witness to becoming part of this evolution.
Witnessing begins at 12:00 (UTC+8) on September 30.
Participate now: https://www.gate.com/activities/everything-money-ceremony
‍#Gate #OneGa
post-image
GT+1.49%
  • 10
  • 1
🚀 #OneGateWitnessProgram | Gate Connects With Its Global Community
Gate has launched the One Gate Witness Program, running from September 30 to October 15, 2026, ahead of TOKEN2049 Singapore. The initiative invites verified Gate users to participate in themed sharing activities built around the message “Hold Freely, Pay Anywhere, Trade Anytime.”
Participants who complete the designated sharing tasks through eligible channels can receive rewards automatically credited to their Gate Coupon Center.
The program highlights Gate’s focus on community participation and global user engagement while cr
MissNovaCrypto
🚀 #OneGateWitnessProgram | Gate Connects With Its Global Community
Gate has launched the One Gate Witness Program, running from September 30 to October 15, 2026, ahead of TOKEN2049 Singapore. The initiative invites verified Gate users to participate in themed sharing activities built around the message “Hold Freely, Pay Anywhere, Trade Anytime.”
Participants who complete the designated sharing tasks through eligible channels can receive rewards automatically credited to their Gate Coupon Center.
The program highlights Gate’s focus on community participation and global user engagement while creating additional opportunities for users to interact with the platform and its ecosystem.
🔹 Program: One Gate Witness Program
🔹 Period: Sept. 30 – Oct. 15, 2026
🔹 Eligibility: Verified Gate users
🔹 Rewards: Gate Coupon Center
🔹 Theme: Hold Freely • Pay Anywhere • Trade Anytime
#Gate #OneGateWitnessProgram #TOKEN2049 #Blockchain
repost-content-media
  • 8
  • 1
🔥 What are we talking about today? Gate Square’s trending topics have been updated!
🔹 U.S. core PCE and the final Q2 GDP reading will be released tonight! Will inflation and growth signals reshape rate-cut expectations?
🔹 Micron’s earnings report is due after market close tonight, with HBM4 and its 2027 outlook in focus. Can the AI memory rally continue?
🔹 $MRVL rises 4.5%, with AI hardware stocks broadly strengthening! Are funds continuing to spread from chips to optical modules and data centers?
🔹 U.S.-Iran talks have reached an impasse, while Brent rises above $106! With oil prices re
post-image
MU+0.30%
MRVL-1.12%
  • 5
#美伊谈判陷入僵持布伦特站上106美元 US-Iran talks remain deadlocked, giving oil an offsetting variable, while gold continues to grapple with interest-rate pressure
As September enters its final trading day, the United States and Iran remain locked in a pattern of confrontation alongside indirect negotiations. Qatar and several other parties continue to mediate, but the gap between the two sides’ core demands remains significant, making a comprehensive reconciliation unlikely in the short term. On one hand, shipping risks in the Strait of Hormuz have not been fully resolved, with geopolitical premiums continui
HighAmbition
#美伊谈判陷入僵持布伦特站上106美元 US-Iran talks remain deadlocked, giving oil an offsetting variable, while gold continues to grapple with interest-rate pressure
As September enters its final trading day, the United States and Iran remain locked in a pattern of confrontation alongside indirect negotiations. Qatar and several other parties continue to mediate, but the gap between the two sides’ core demands remains significant, making a comprehensive reconciliation unlikely in the short term. On one hand, shipping risks in the Strait of Hormuz have not been fully resolved, with geopolitical premiums continuing to support crude oil prices; on the other, the United States has announced the release of strategic petroleum reserves, delivering a “cooling shot” to elevated oil prices. With these two forces offsetting each other, crude oil has entered a period of high-level volatility. Gold, meanwhile, remains caught between risk-aversion sentiment and high real interest rates. Repeated swings in the market have left many investors uncertain about its direction.
Crude oil pricing has never depended solely on whether a conflict escalates; it is jointly shaped by the interplay between supply risks and policy intervention.
As a global energy artery, the Strait of Hormuz carries approximately one-fifth of the world’s seaborne crude oil. As long as the US-Iran standoff continues, the market will continue pricing in the potential risk of disruptions to the waterway, providing a floor for oil prices. On September 30, the US Department of Energy officially announced a crude oil exchange program involving the release of up to 40 million barrels from the strategic petroleum reserve. The crude is expected to be delivered in November and December, with the aim of offsetting oil price increases caused by Middle East geopolitical risks and curbing energy inflation.
One force “increases supply,” while the other “maintains risk”; after these two forces collide, crude oil is unlikely to embark on a one-way surge.
If subsequent negotiations send conciliatory signals and expectations of restored passage through the strait strengthen, with the release of reserve crude also taking effect, oil’s risk premium will fall rapidly; if negotiations collapse and maritime frictions flare up again, supply concerns will regain the upper hand and oil prices will quickly surge. For some time ahead, broad fluctuations at elevated levels will likely be crude oil’s main theme, with prices highly driven by news and reversals occurring extremely quickly.
Many people instinctively assume that geopolitical tensions will inevitably send gold sharply higher, but the market repeatedly showed in late September that this logic does not always hold.
Gold is a non-yielding asset, and US Treasury real yields and the strength of the dollar often outweigh short-term safe-haven buying. Persistently strong oil prices are stoking concerns about a rebound in inflation, prompting the market to reassess the Federal Reserve’s monetary policy. Expectations for interest-rate cuts are being pushed back further, Treasury yields are staying elevated, and the opportunity cost of holding gold is rising directly, continuing to constrain gold’s upside.
Of course, this does not mean gold’s safe-haven appeal has become ineffective. We need to assess the situation by scenario: if the current stalemate of “limited friction + continued diplomatic mediation” persists, interest rates will remain the main driver of gold prices, leaving limited room for a rebound; if the situation deteriorates sharply, the conflict expands, panic erupts in the market, and systemic safe-haven funds pour in, geopolitical factors will regain dominance and gold will see a strong rally.
In other words, gold is now waiting for a “qualitative shift signal.” Before that signal materializes, it will remain range-bound.
For now, we only need to closely monitor two key indicators.
First, the progress of indirect US-Iran negotiations, with a focus on whether substantive progress is made on the reopening of the Strait of Hormuz and the lifting of sanctions, which will directly determine how long crude oil’s geopolitical premium can last.
Second, US inflation data and statements from Federal Reserve officials. Changes in interest-rate expectations are the most important factor determining gold’s medium-term direction.$XAUUSD
XAU+0.22%
XAUUSD-0.75%
  • 9
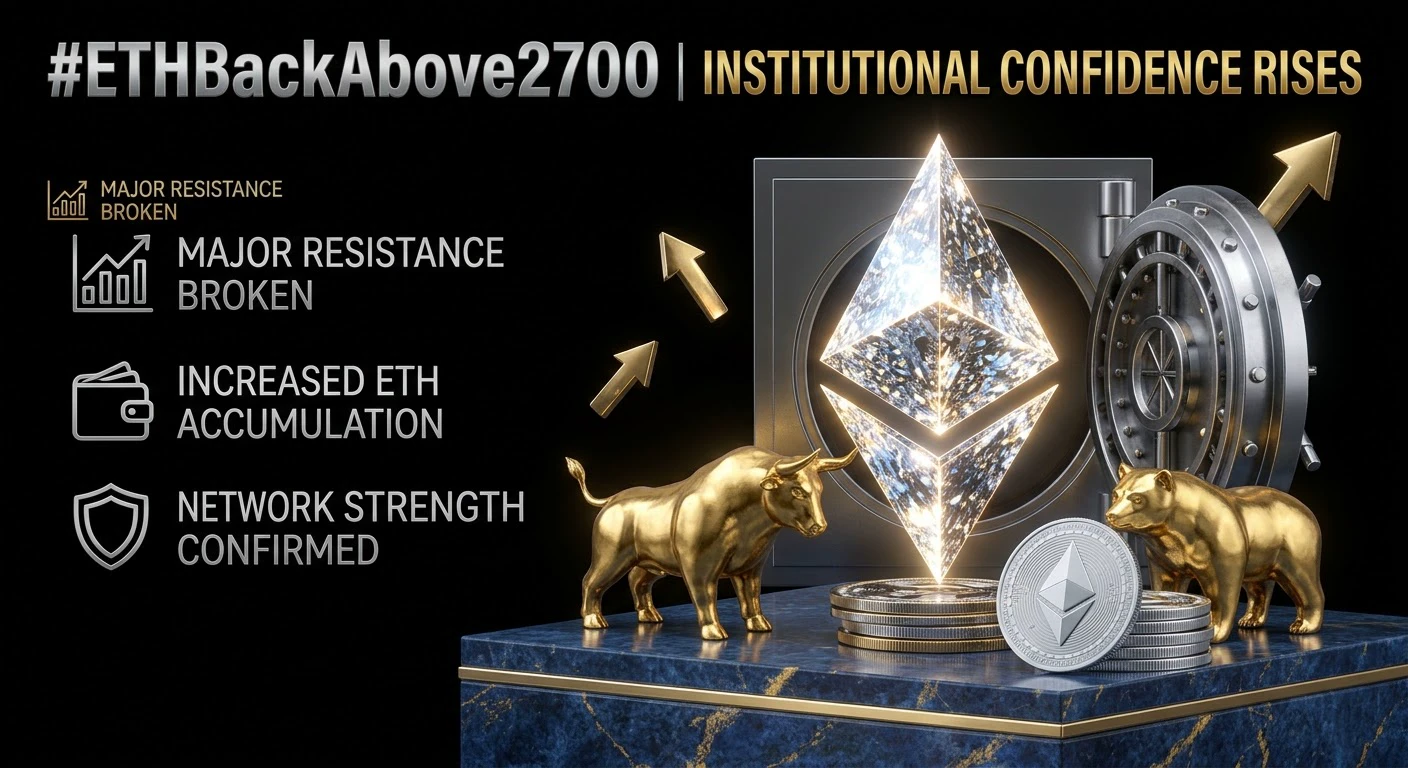
#ETHBackAbove2700
ETH Back Above $2700 For First Time Since January
Ethereum is back in the spotlight. ETH has reclaimed $2,700 for the first time since January 2026, trading at $2,716 after a 5.7% jump in 24 hours. The move puts the second-largest digital asset by market capitalization back above a level that had acted as heavy resistance for months and opens the door for a run toward $3,000.
1. The Breakout That Mattered
The $2,700 level has been a ceiling since winter. ETH tapped $2,703 intraday on Sunday, pulled back to $2,665 as oil prices rose and risk sentiment wobbled, then reclaimed
post-image
BTC+1.05%
ETH+0.20%
SOL+1.06%
ARTY+11.23%
  • 56
  • 4
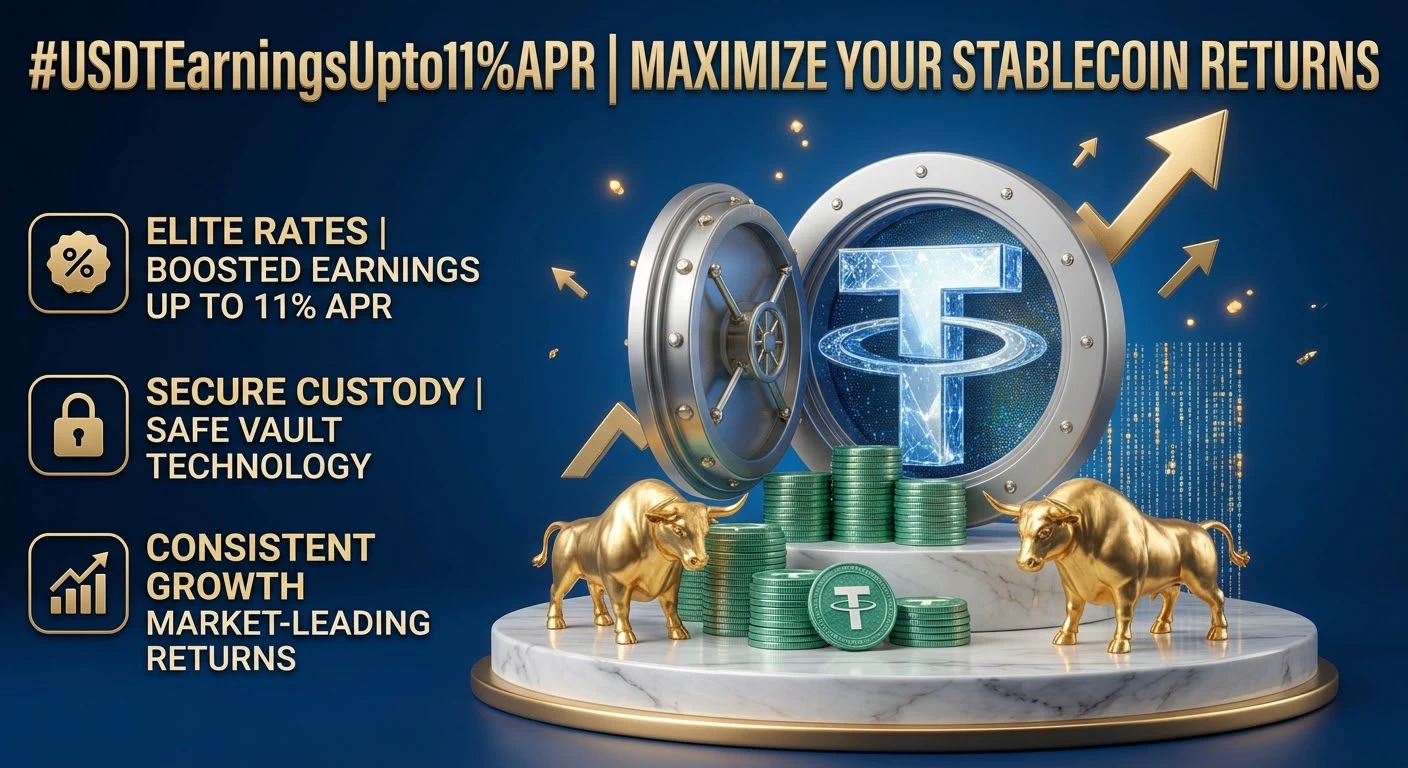
#USDTEarningsUpto11%APR
HOW USDT EARN OFFERS UP TO ELEVEN PERCENT 📈
USDT remains the most used dollar pegged coin for trade, transfer, and settlement. An earn product that offers up to around eleven percent per year gives holders a way to keep funds in dollar terms while still seeking growth.
Unlike idle spot balance, earn puts capital to work via lending, liquidity, and other low friction market activity. Yield is paid in same asset or in other coins, based on product design. Top rate of eleven percent is usually a ceiling tied to high demand periods, while base rate stays lower but still a
post-image
  • 39
  • 3
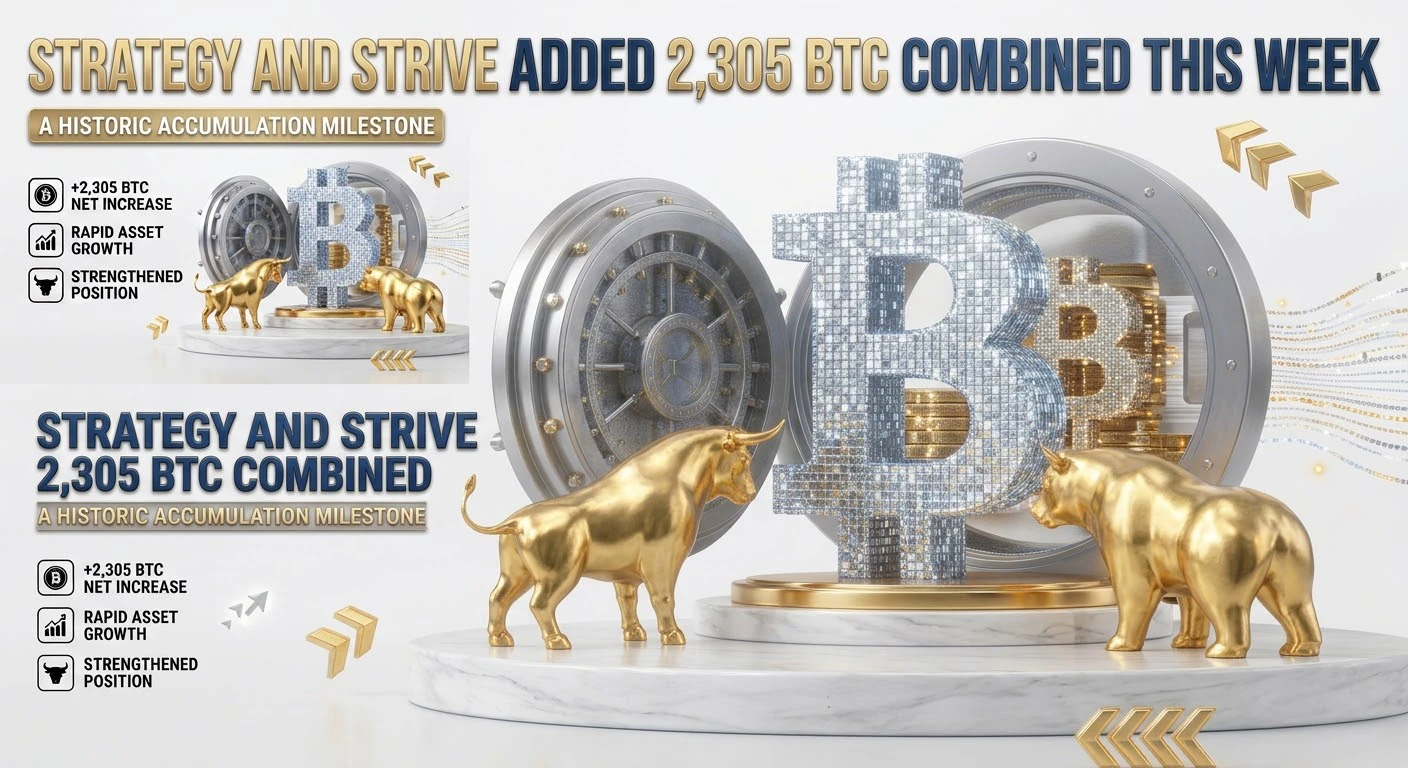
#StrategyAndStriveAdded2,305BTCCombinedThisWeek
COMBINED BITCOIN ACCUMULATION IN FOCUS 💼
Two well known corporate holders added a large Bitcoin pile this week. Together they bought around two thousand three hundred five coins. This move adds to an ongoing trend where balance sheets hold Bitcoin as core reserve asset, not only as trade.
The scale matters. A buy of this size in a single week shows high conviction and ready access to capital. It also shows that dip phases are viewed as entry windows rather than risk events.
WHY TWO FIRMS ADDED LARGE COIN PILE 📊
Both firms share a similar thesi
post-image
BTC+1.05%
  • 38
  • 4
$NVDA The $235 Billion Signal: What Nvidia's Record Buyback Says About the AI Cycle
There is a particular kind of confidence that reveals itself not in a forecast or a product launch, but in a boardroom decision to deploy a quarter of a trillion dollars buying back a company's own stock. Nvidia delivered that signal on Monday, announcing a $150 billion increase to its share repurchase program. The additional authorization lifts the total remaining amount available for buybacks to $235 billion, which the company expects to execute through fiscal year 2028. It is the largest single increase to
User_any
$NVDA The $235 Billion Signal: What Nvidia's Record Buyback Says About the AI Cycle
There is a particular kind of confidence that reveals itself not in a forecast or a product launch, but in a boardroom decision to deploy a quarter of a trillion dollars buying back a company's own stock. Nvidia delivered that signal on Monday, announcing a $150 billion increase to its share repurchase program. The additional authorization lifts the total remaining amount available for buybacks to $235 billion, which the company expects to execute through fiscal year 2028. It is the largest single increase to a buyback authorization on record, and it arrives at a moment when the broader technology sector is navigating a more cautious macro environment.
The Mechanics of the Authorization
The board's approval adds $150 billion to an existing program that already had $99 billion remaining as of the end of the second quarter of fiscal 2027. That quarter, which ended July 26, was one of the most profitable in corporate history. Nvidia reported revenue of $96.2 billion, a 106 percent increase from a year earlier, with data center revenue alone reaching $89 billion. Gross margins held at 75 percent. During the quarter, the company returned approximately $26 billion to shareholders through buybacks and dividends.
The buyback program is not a new strategy. Nvidia has been steadily expanding its capital return program as its cash generation has accelerated. In fiscal 2023, buybacks totaled roughly $10 billion. By fiscal 2025, that figure had climbed to nearly $34 billion. In May 2026, the board authorized an additional $80 billion and raised the quarterly dividend 25-fold, from $0.01 to $0.25 per share. The latest increase is the largest in that sequence, and it reflects a balance sheet that is now generating cash at a pace that exceeds even the company's substantial investment requirements.
The Cash Generation Engine
The scale of the buyback is a direct function of the scale of Nvidia's revenue. The second quarter of fiscal 2027 marked the first time the company's quarterly revenue exceeded $96 billion, and management's guidance for the third quarter points to $108 billion. Data center revenue, which now accounts for the overwhelming majority of the company's sales, grew 117 percent year over year. The demand is driven by the buildout of AI infrastructure across multiple frontiers: frontier labs scaling in parallel, an open-model ecosystem, and the emergence of physical AI applications.
Jensen Huang, the company's founder and chief executive, framed the authorization in terms of the broader transformation underway. "Nvidia's growth is being driven by a once-in-a-generation platform shift to AI and accelerated computing," he said. "Our cash generation gives us the capacity to invest in the technologies that advance this transformation and return capital to shareholders." The statement is notable for what it treats as settled. Huang is not arguing that the AI cycle will continue. He is treating its continuation as the operating assumption on which the buyback is based.
The Market's Reaction and the Broader Context
Nvidia shares rose 1.9 percent in Monday morning trading, defying a broader technology sector slump. The stock had closed at $224.55 on Friday, and the pre-market move reflected a market that read the buyback as a positive signal. The reaction was measured rather than euphoric, which is appropriate. Buybacks mechanically reduce the number of shares outstanding, which lifts earnings per share, but an authorization of this scale is fundamentally a statement about management's assessment of intrinsic value.
The timing of the announcement is worth noting. It arrives as the Federal Reserve maintains a restrictive policy stance, with the benchmark rate held at 3.65 percent and the 10-year Treasury yield above 5 percent. Higher rates pressure valuations for growth companies by raising the discount rate applied to future earnings. A buyback authorization of this magnitude is a form of insulation against that pressure, because it reduces the share count that the market must value. It does not change the discount rate, but it changes the denominator.
The comparison to peers is instructive. Apple, Microsoft, and Alphabet have all conducted large buyback programs, but none has announced a single authorization increase of this size. The $150 billion increase alone exceeds the entire market capitalization of most companies in the S&P 500. It is a measure of the concentration of value creation in the AI supply chain, and of Nvidia's position at its center.
What to Watch
The buyback authorization is a statement of intent, not a commitment to a specific pace of purchases. The company has said it expects to execute the remaining $235 billion program through fiscal 2028, which implies an average quarterly deployment of roughly $20 billion. That pace could accelerate or decelerate depending on market conditions and the company's other capital needs.
The variables worth tracking are the quarterly cash flow figures, which determine how much capital is available for buybacks after investment in research, development, and manufacturing capacity. Nvidia's capital expenditures are substantial and growing, and the company has committed to investing in the technologies that support its AI platform. The buyback is funded from the cash that remains after those investments. As long as revenue growth continues at the current pace, the buyback can proceed without constraining the operating business. If growth slows, the calculus changes.
The broader market environment also matters. The buyback is a signal of confidence, but it is not a guarantee of price appreciation. Nvidia's stock is sensitive to the same macro forces that affect every risk asset: interest rates, inflation data, and geopolitical developments. The $235 billion authorization gives the company a tool to support its share price during periods of volatility. Whether that tool proves sufficient depends on factors that no single announcement can control.
DYOR 🔎 NFA ✔️
repost-content-media
NVDA+1.29%
AAPL+1.89%
MSFT+1.60%
  • 43
  • 2
$BTC
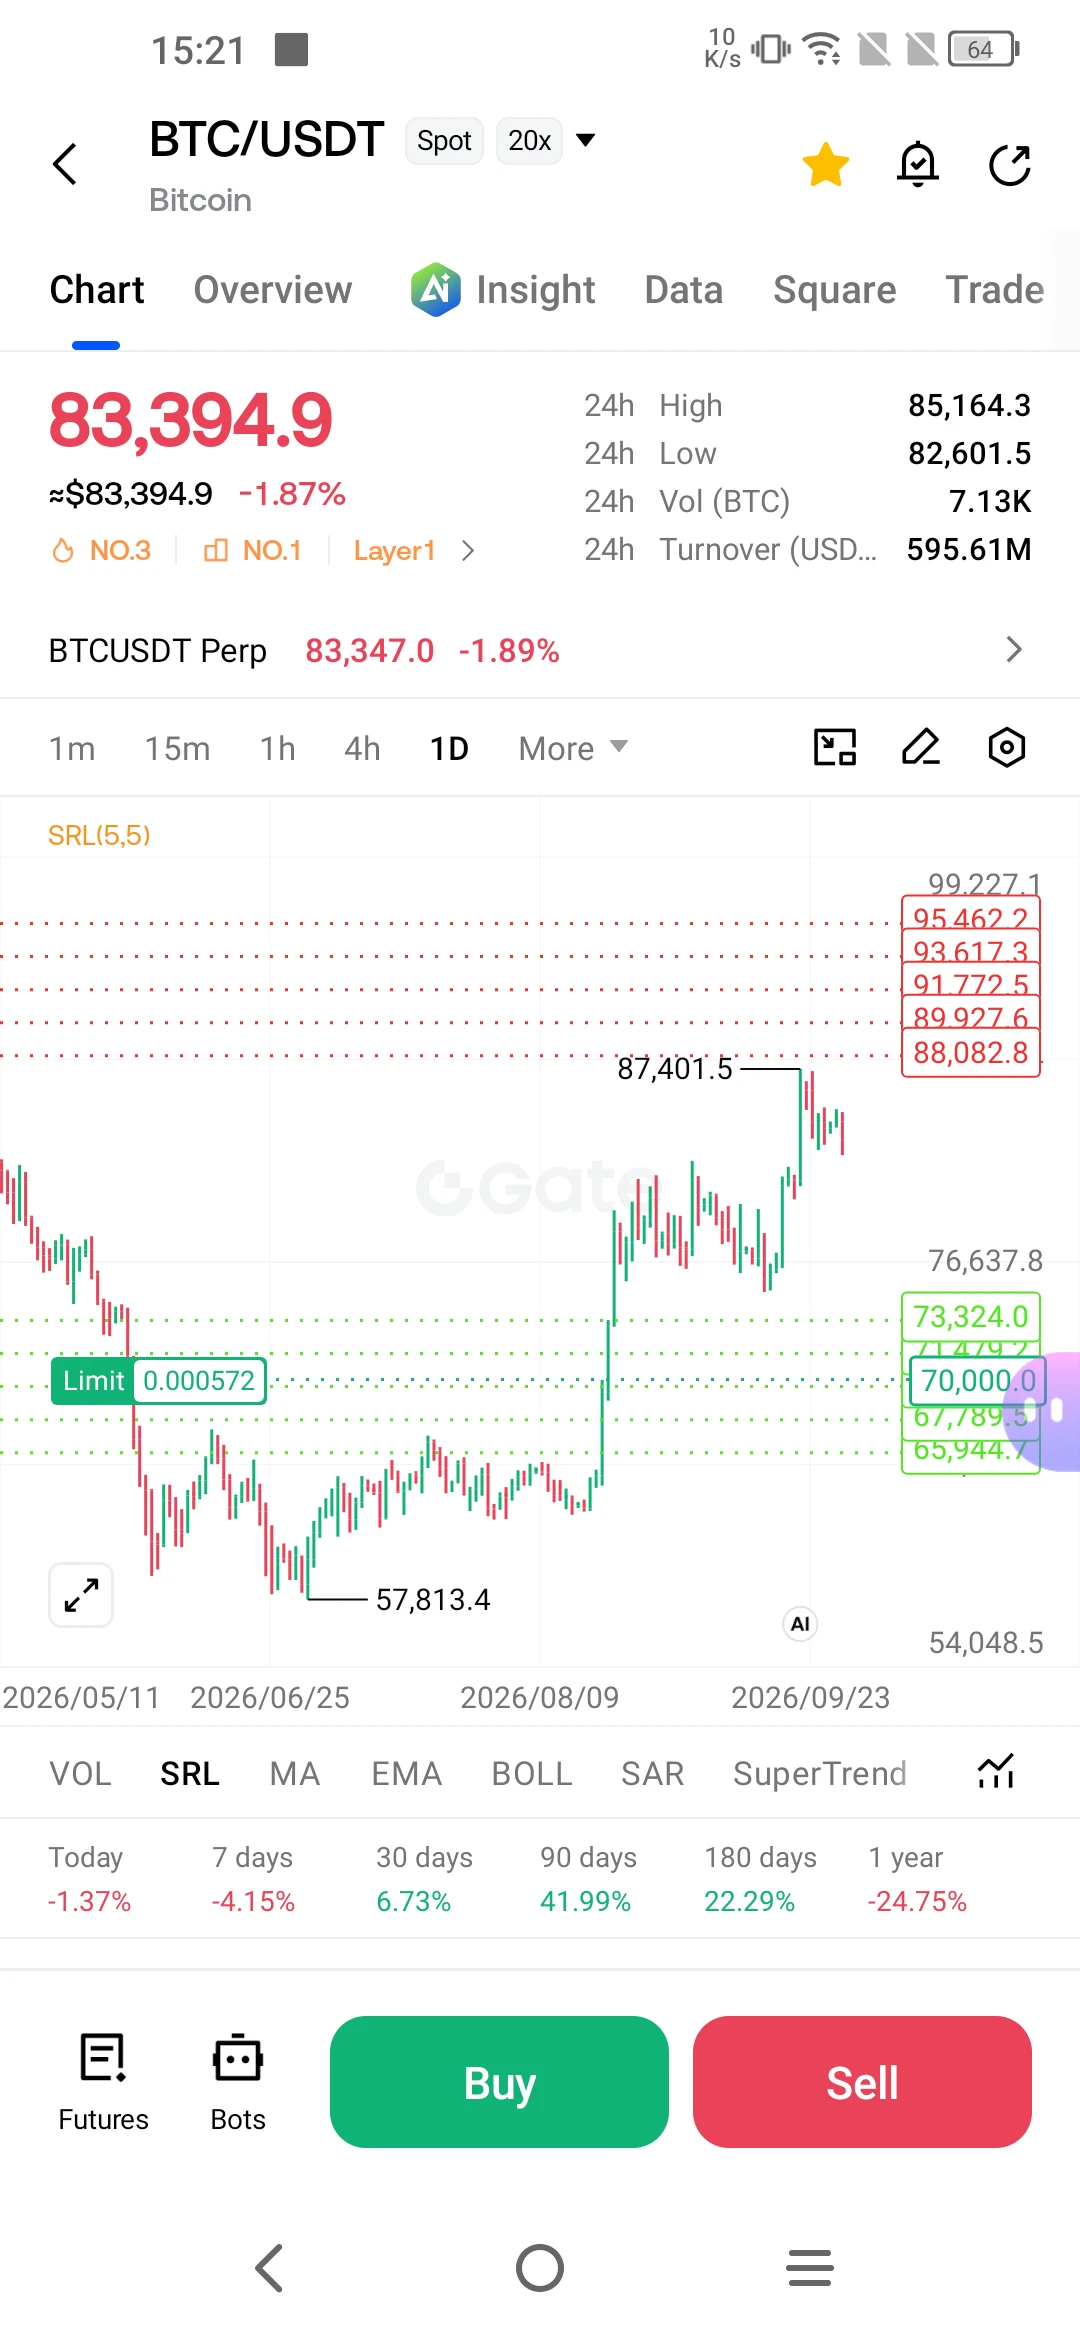
Bitcoin's move from $57,000 to $87,000 in 2026 looks dramatic on a chart, but the reasons behind it are more ordinary than the price action suggests. This was not a single event or a sudden wave of speculation. It was a steady accumulation of capital, a shift in how institutions treat the asset, and a macro backdrop that, counterintuitively, pushed money toward Bitcoin rather than away from it. Let me walk you through what actually happened.
The first thing to understand is the starting point. Bitcoin ended June 2026 at $58,558.86, having spent months in a difficult range. The crypto win
User_any
$BTC
Bitcoin's move from $57,000 to $87,000 in 2026 looks dramatic on a chart, but the reasons behind it are more ordinary than the price action suggests. This was not a single event or a sudden wave of speculation. It was a steady accumulation of capital, a shift in how institutions treat the asset, and a macro backdrop that, counterintuitively, pushed money toward Bitcoin rather than away from it. Let me walk you through what actually happened.
The first thing to understand is the starting point. Bitcoin ended June 2026 at $58,558.86, having spent months in a difficult range. The crypto winter that began in late 2025 had pushed prices down sharply from the October 2025 all-time high above $126,000, with a 48% drop to $65,265 by mid-July. Sentiment was poor, long-term holder selling had dominated the narrative for months, and the market was searching for a floor. That floor was found around the $57,000 to $59,000 zone, and from there the recovery began in July.
What followed was a three-month winning streak, the first of its kind since 2012. Bitcoin rose 7.27% in July to $62,813.75, then accelerated in August with a 25.05% gain to $78,548.63. By September 24, it was trading at $84,379.06, up another 7.42% from the August close. The move above $87,000 in late September marked the highest level since January 2026, effectively erasing the losses accumulated during the first half of the year.
The most concrete driver behind this move was exchange-traded fund inflows. US spot Bitcoin ETFs had spent most of 2026 in net outflow territory, with cumulative outflows reaching $5.8 billion by mid-July. That changed in September. Over the past month, net inflows turned positive for the first time this year, absorbing approximately $4.6 billion and flipping the year-to-date figure from a $5.8 billion deficit to roughly $800 million in net inflows. The single-day figures were striking: $998.95 million entered the funds on September 21 alone, the best performance in nearly a year, followed by around $715 million the next day. These are not retail flows. They represent pension funds, wealth managers, and institutional allocators gaining exposure through a regulated wrapper without having to manage wallets, private keys, or crypto exchanges directly.
The institutional buyer base has expanded meaningfully. Total net assets in US spot Bitcoin ETFs reached about $101 billion by early September, with cumulative net inflows since launch of roughly $55.6 billion. BlackRock's iShares Bitcoin Trust accounted for a substantial portion of recent demand. Corporate accumulation added another layer. Strategy bought another 950 Bitcoin for $75.7 million in September, taking its holdings to 846,000 Bitcoin, and large holders increased their balances from roughly 2.87 million BTC in December 2025 to about 3.06 million BTC, with buying intensifying after the June dip below $60,000.
On-chain data confirmed the shift. Galaxy Digital's research indicated that the "Great Distribution," the extended period of selling by long-term holders that had weighed on the market through 2026, had concluded. Wallets inactive for years significantly reduced their activity, and dormant supply remained largely immobile. CryptoQuant identified a rare on-chain crossover in late September: the short-term holder cost basis crossed above the cost basis of active long-term holders. This signal has appeared only five times in Bitcoin's history, and analysts view it as confirming a new bull-market phase as momentum turns in favor of newer buyers. More than 3.5 million BTC held for over 10 years remained inactive, with dormant supply rising by about 8,000 to 30,000 BTC per month on average.
The macro backdrop played a role that surprised many observers. The Federal Reserve raised interest rates for the first time in three years in mid-September, lifting the target range to 3.75%-4.00%. The 10-year US Treasury yield approached 5%, and concerns over government debt and fiscal sustainability moved to the forefront of investors' minds. In theory, higher yields should make a non-yielding asset like Bitcoin less attractive. Instead, Bitcoin rallied 30% through the rate hike, a failed legislative vote, and the 5% Treasury yield.
The explanation lies in a shift in how investors are framing the asset. Blue Macellari, head of digital assets at T. Rowe Price, noted that Bitcoin has increasingly become part of the "debasement trade," the search for scarce or hard assets that could retain value if confidence in fiat currencies deteriorates. Rising government debt, elevated long-term yields, and fiscal sustainability concerns provide tailwinds for this trade. Dovile Silenskyte of WisdomTree added that Bitcoin's supply rules are predetermined, its issuance follows a fixed schedule, and the protocol cannot be altered by a central bank seeking to support activity or by a government seeking to finance a deficit. That narrative offers a different proposition from the high-beta risk asset framing that dominated previous cycles.
Regulatory developments, while mixed, contributed to the improving sentiment. The CLARITY Act, a landmark bill aimed at establishing a regulatory framework for digital assets, failed to advance in the Senate in mid-September. But the Securities and Exchange Commission issued an innovation exemption providing a five-year regulatory relief window, allowing trading venues to offer tokenized asset trading without formally registering as national securities exchanges or broker-dealers. Analysts noted that while the Senate setback was disappointing, the SEC's rulemaking activity under current leadership demonstrated that regulatory progress was continuing through other channels. For institutional investors, the distinction matters: they do not necessarily need every question answered by Congress before allocating capital, but they need enough clarity around custody, market structure, and compliance to justify doing so.
The technical picture reinforced the fundamental shift. Bitcoin's price action formed a "golden cross," where the 50-day moving average crossed above the 200-day moving average, adding technical momentum to the rally. CryptoQuant analysts noted that spot demand worked in tandem with ETF inflows, resulting in well over $340 million in shorts getting liquidated in a classic short squeeze. There was little resistance on the way up because historical activity between $80,000 and $85,000 was sparse, allowing Bitcoin to move through that zone quickly.
What does this tell you about the nature of the rally? James Butterfill, head of research at CoinShares, described it as "flow driven rather than event driven." The move was not triggered by a single headline or a sudden change in sentiment. It was built on steady accumulation by large holders, persistent ETF inflows, and a gradual reassessment of Bitcoin's role in a portfolio. Butterfill cautioned that "a few resilient sessions are not enough to establish a new regime," and that is a fair point. Three weeks of strong inflows are evidence of demand, not proof that demand is permanent. Earlier in 2026, the funds suffered substantial outflows, and the September buying has not been entirely smooth.
The sustainability of the move will depend on whether organic spot demand continues after the short-covering effect fades, and whether ETF inflows remain persistent. Analysts have identified $82,500 to $85,000 as a key support zone that needs to hold for the trend to remain healthy, with $81,500 as a deeper support level. On the upside, $87,000 to $88,000 has been flagged as near-term resistance, with $90,000 as the next major psychological level.
The honest takeaway is this: Bitcoin's rise from $57,000 to $87,000 was driven by identifiable, measurable forces. ETF inflows, institutional accumulation, on-chain supply dynamics, and a macro narrative that positioned Bitcoin as a hedge against fiscal deterioration all contributed. The move was not a speculative frenzy. It was a repositioning of capital. But repositioning can reverse, and the next few weeks of ETF flow data and on-chain activity will tell you more about the durability of this trend than any single price level.
This article is not investment advice. Analysis of market structure, flows, and on-chain data is based on publicly available information and does not guarantee future outcomes.
repost-content-media
  • 35
Oil markets opened the week with force, and the numbers tell the story before any commentary does. WTI crude settled at $93.55 a barrel, up $1.14 or 1.23% on the day. Brent climbed to $107.75, a gain of $3.43 or 3.29%. Murban crude, the Abu Dhabi benchmark that tracks the physical market in the Gulf, traded around $113.12 at the previous close, with futures pricing above $117 in early Monday activity. Natural gas moved in the opposite direction. US futures for October delivery fell more than 3% to $3.125 per million BTU, with some contracts dropping 4.01% to $3.07. The divergence between crude
User_any
Oil markets opened the week with force, and the numbers tell the story before any commentary does. WTI crude settled at $93.55 a barrel, up $1.14 or 1.23% on the day. Brent climbed to $107.75, a gain of $3.43 or 3.29%. Murban crude, the Abu Dhabi benchmark that tracks the physical market in the Gulf, traded around $113.12 at the previous close, with futures pricing above $117 in early Monday activity. Natural gas moved in the opposite direction. US futures for October delivery fell more than 3% to $3.125 per million BTU, with some contracts dropping 4.01% to $3.07. The divergence between crude and gas reflects two different sets of forces at work.
At the pump, the picture for American consumers remains difficult. The national average for regular gasoline stands at $4.4798 per gallon, according to AAA data, with the September average touching $4.48. Diesel, the fuel that powers trucks, trains, tractors, and construction equipment, averages between $6.50 and $6.53 per gallon nationwide. One month ago, diesel was $5.61. Some stations in the San Francisco Bay Area are selling above $9 per gallon. For a truck driver filling a 143-gallon tank, the difference between last year and today is measured in hundreds of dollars per fill-up, and that cost travels through the entire supply chain.
The diplomatic backdrop explains why prices are moving the way they are. President Trump said oil prices will collapse when Iran gives up. Then he rejected Iran's proposal to reopen the Strait of Hormuz within seven days under specific conditions. Iran's foreign minister had laid out terms including a cessation of hostilities and the release of frozen assets. Washington did not accept them. Trump promised more talks but left the timing and the terms undefined. Oil answered immediately. Brent jumped above $108 at one point during the session. When a president makes war and peace sound like decisions he will improvise later, traders do not wait for the next headline. They price the uncertainty into the barrel today.
What makes this move particularly notable is that it happened against a backdrop of improving physical supply. Crude oil exports from key Middle Eastern producers rebounded to 12.8 million barrels per day in September, the highest level since the US-Israeli war with Iran began in February, according to Kpler data. Exports through the Strait of Hormuz were set to reach about 7.4 million barrels per day this month. Saudi Arabia, the region's top exporter, was on track to ship about 5.4 million barrels per day in September, more than double the 2.446 million barrels per day recorded in August. Shipments from the Ras Tanura port on the Gulf jumped to about 3.6 million barrels per day from 929,000 barrels per day in August. Nineteen very large crude carriers, each carrying 2 million barrels of Saudi oil, exited the Strait of Hormuz last week.
That is a meaningful recovery. Saudi Arabia diverted more crude through the Strait of Hormuz to compensate for the disruption to its East-West Pipeline, which was damaged in attacks and had disrupted exports from the Red Sea port of Yanbu. The kingdom adapted. The barrels are moving. Traders can see them. And yet prices are surging anyway. The reason is that the market is not pricing the supply that exists today. It is pricing the risk that the supply route closes again tomorrow. When the diplomatic path narrows and the military threat remains open, physical barrels on the water do not provide the comfort they normally would.
The situation in the diesel market adds another layer of complexity. President Trump said Sunday he is still looking "very seriously" at implementing a US ban on diesel exports to combat high prices. The administration has floated a 90-day ban, though a White House official told CNN the administration was not considering an export ban or even export restrictions. Trump's former energy secretary, Dan Brouillette, called the idea "a bad idea" that will backfire, noting that diesel comes from the same barrel of oil as gasoline and that shutting down diesel refining also constrains gasoline supply. Current Energy Secretary Chris Wright said the "blunt tool of banning diesel exports definitely doesn't work". The United States is the world's largest diesel exporter, and blocking the 1.5 million barrels that leave daily could initially lower prices along the Gulf Coast but would eventually reduce refinery runs and tighten the market for both diesel and gasoline. Europe is already paying record premiums for diesel. Another sudden intervention could spread the damage through fuel markets without fixing the underlying shortage.
The natural gas market is telling a different story. US futures fell as pipeline infrastructure recovered faster than expected, easing supply concerns that had built up earlier in the month. European gas prices, however, moved in the opposite direction, rising above €74 per megawatt-hour as Qatar's prolonged LNG supply disruptions and uncertainty over the Strait of Hormuz kept the market on edge. The split between US and European gas pricing reflects the fact that the United States is largely insulated from the Hormuz risk by domestic production, while Europe depends on seaborne LNG that must transit the same waterway.
If you are trying to read the next move, the variables that matter are straightforward. The first is whether Washington responds to Iran's proposal through mediators. The second is whether Iran's conditions are treated as a starting point or a final position. The third is whether the diesel export ban moves from rhetoric to policy. Each of these carries its own set of consequences. A diplomatic opening could ease the risk premium quickly. A military escalation could push Brent toward $115 or higher. A diesel export ban could lower prices at the pump for a few weeks and then raise them for everyone. The market is pricing the probability of each outcome in real time, and the price of crude is the most honest expression of that calculation.
This article is not investment advice. Market analysis is based on publicly available information and does not guarantee future outcomes.
repost-content-media
NG-1.28%
GAS+2.68%
  • 27