Square
Following
Hot
News
Notifications
Profile
Share your thoughts
placeholder
Article
I'm going back to my old method
The reason U followed me
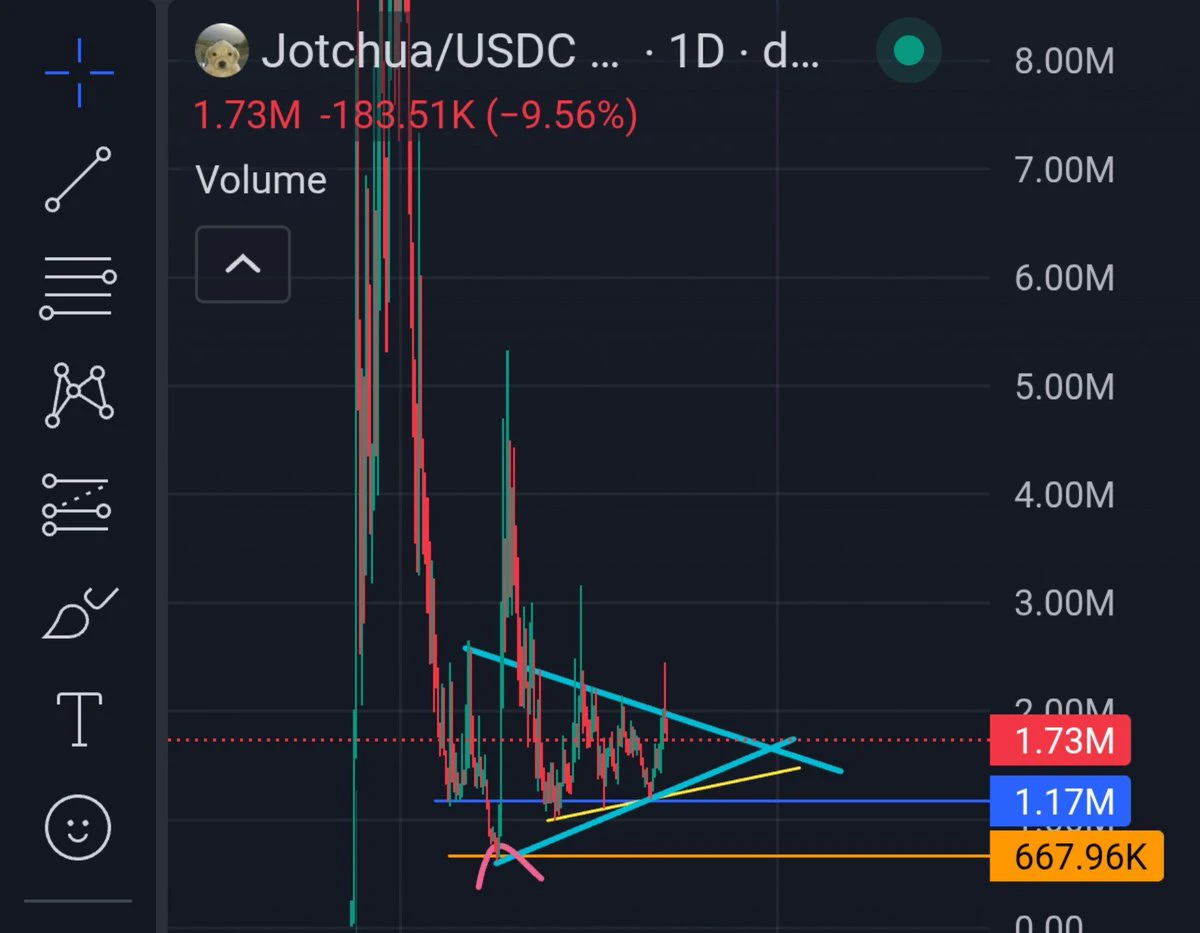
$JOTCHUA
⏲️
post-image
The probability of a December rate hike in U.S. stocks is 80% because the jobs data is very strong, so there’s no need to cut rates!!
So the main strategy is still to go short and patiently wait for the pullback to continue,
The weekly chart seems to be stabilizing. The Nasdaq 100 still needs time—at least 4 more weekly candles to confirm whether it will slowly decline after completing the V-shaped move 📉, decline choppily, or drop quickly in anticipation of a December rate hike! The market needs to confirm all of this!
The Nasdaq 100 weekly chart is waiting for the 23000-26000 range
The Nasd
Trenches
ZIG
Z
bade
b
ZIG
0x8c...1145
Market Cap
$.
Change
.
24h Vol
$.
Holders
.
STONK
S
bade
b
STONK
6GmA...UNgx
Market Cap
$.
Change
.
24h Vol
$.
Holders
.
CLAUDIA
C
bade
b
CLAUDIA
2j5S...W2ZM
Market Cap
$.
Change
.
24h Vol
$.
Holders
.
FLOAT
F
bade
b
FLOAT
Bv1a...BMmr
Market Cap
$.
Change
.
24h Vol
$.
Holders
.
BTC
B
bade
b
BTC
C5xp...pump
Market Cap
$.
Change
.
24h Vol
$.
Holders
.
$NBIS is expected to post $907M in revenue this quarter while it posted only $582.3M revenue previous quarter.
Thats a 55% jump expected in one single quarter. I think with the way the stock is performing, there is every single chance that it misses that estimate and by quite some margin and Stock plunges to $100 or lower.
My 2c.
post-image
NBIS+7.73%
On Monday, November 9, several economic data releases and central bank officials’ speeches are worth watching. At 9:30 Beijing time, China’s October CPI annual rate will be released, reflecting domestic inflation. At 15:00, Germany’s September seasonally adjusted trade balance will be released; at 17:30, the Eurozone’s November Sentix Investor Confidence Index will be published. At 23:00, the U.S. September wholesale sales month-over-month rate will be released, while Federal Reserve’s Goolsbee speaks. At 00:00 the following day, the U.S. October New York Fed 1-year inflation expectations data
With 1000U, don’t think about making 10x yet—think about how not to get wiped out

Here’s the reality: with 1000U, your biggest achievement this year isn’t how much you made. It’s that your account is still there, and you’re more disciplined than you were at the start of the year.

First, a simple math problem

If 1000U loses 50%, you’re left with 500.

To get 500 back to 1000, you need to make 100%.

When you lose, you only need to drop by half. To earn it back, you have to double your money.

That’s why small accounts should fear big drawdowns more than slow growth.

One impulsive move can w
post-image
BTC-0.65%
The U.S. has gone 62 months without the unemployment rate topping 5%. Sounds impressive, but that’s all in the rearview mirror. When hiring starts to slow, this record won’t stop it. Recession signals have never been about who holds on the longest—they’re about the turn. I’m watching initial jobless claims and hours worked. Maybe I’m wrong; I’ll wait to be proven wrong.
post-image
#Ahr999EntersBottomBuyingZone
AHR999 Enters the Bottom Buying Zone – Is Bitcoin Preparing for Its Next Big Opportunity? ₿
The cryptocurrency market is constantly moving through different cycles of fear, uncertainty, corrections, and recovery. However, some market indicators can help investors understand when Bitcoin may be approaching an attractive long-term accumulation zone. One indicator that has attracted attention among crypto enthusiasts is the AHR999 Indicator.
The latest visual concept highlights an important message: AHR999 is entering the bottom buying zone, potentially creating an
BTC-0.67%
From 100k to 1 million: Do the “real math” first, and you’ll find it’s harder than you think
Most people calculate it like this: 100k × 10 = 1 million.
But you want 1 million in hand, not 1 million showing in your account.
There are a lot of costs in between quietly eating into your returns.
① Fees can eat up more than 15% a year
Assume you make 200 trades a year, with a notional position size equal to 1x your account per trade.
Taker fee 0.05% + closing fee 0.05% = 0.1% per trade
200 trades × 0.1% = 20% of your account
Even if you use maker orders for everything (0.02%), that still comes to 8
post-image
BTC-0.65%
$GNS pumps 50% in a single candle 🔥Yesterday was about $ONE and today is about $GNSCongratulations 🎉 if you bought some when I called it yesterdayLike 👍 this post if you are bullishGNSPriceAnalysis
post-image
GNS-6.46%
ONE-1.19%
In trading, spend the first three years adding and the next three years subtracting
Most people die in the adding phase, a few get stuck in the mixed phase, and only a very small number make it to the subtracting phase.
Stage One: Adding Phase (1-2 years)
State: Learn everything, try everything.
Indicators, chart patterns, theories, KOLs, trade calls, quantitative strategies, on-chain data...
Symptoms:
Changing methods every day
Using moving averages for one trade, then Elliott waves for the next
Not knowing why you made money when you win, or why you lost when you lose
The more you learn, the
post-image
BTC-0.65%
The Options Market’s “Chain-Reaction Meltdown” — Why Was This Sell-Off So Relentless?

Guys, many people are wondering: Sure, U.S. stocks fell, but how could the Nasdaq drop 5.5% in a single day, while the Philadelphia Semiconductor Index plunged 12%? Did all the institutions in the market somehow agree to dump everything on the same day?

Actually, behind this lies an extremely brutal mechanism: options market makers’ “Gamma squeeze.”

Before this crash, large numbers of retail traders and institutions bought call options, thinking AI stocks could keep rising. To hedge the risk of selling tho
NVDA+2.80%
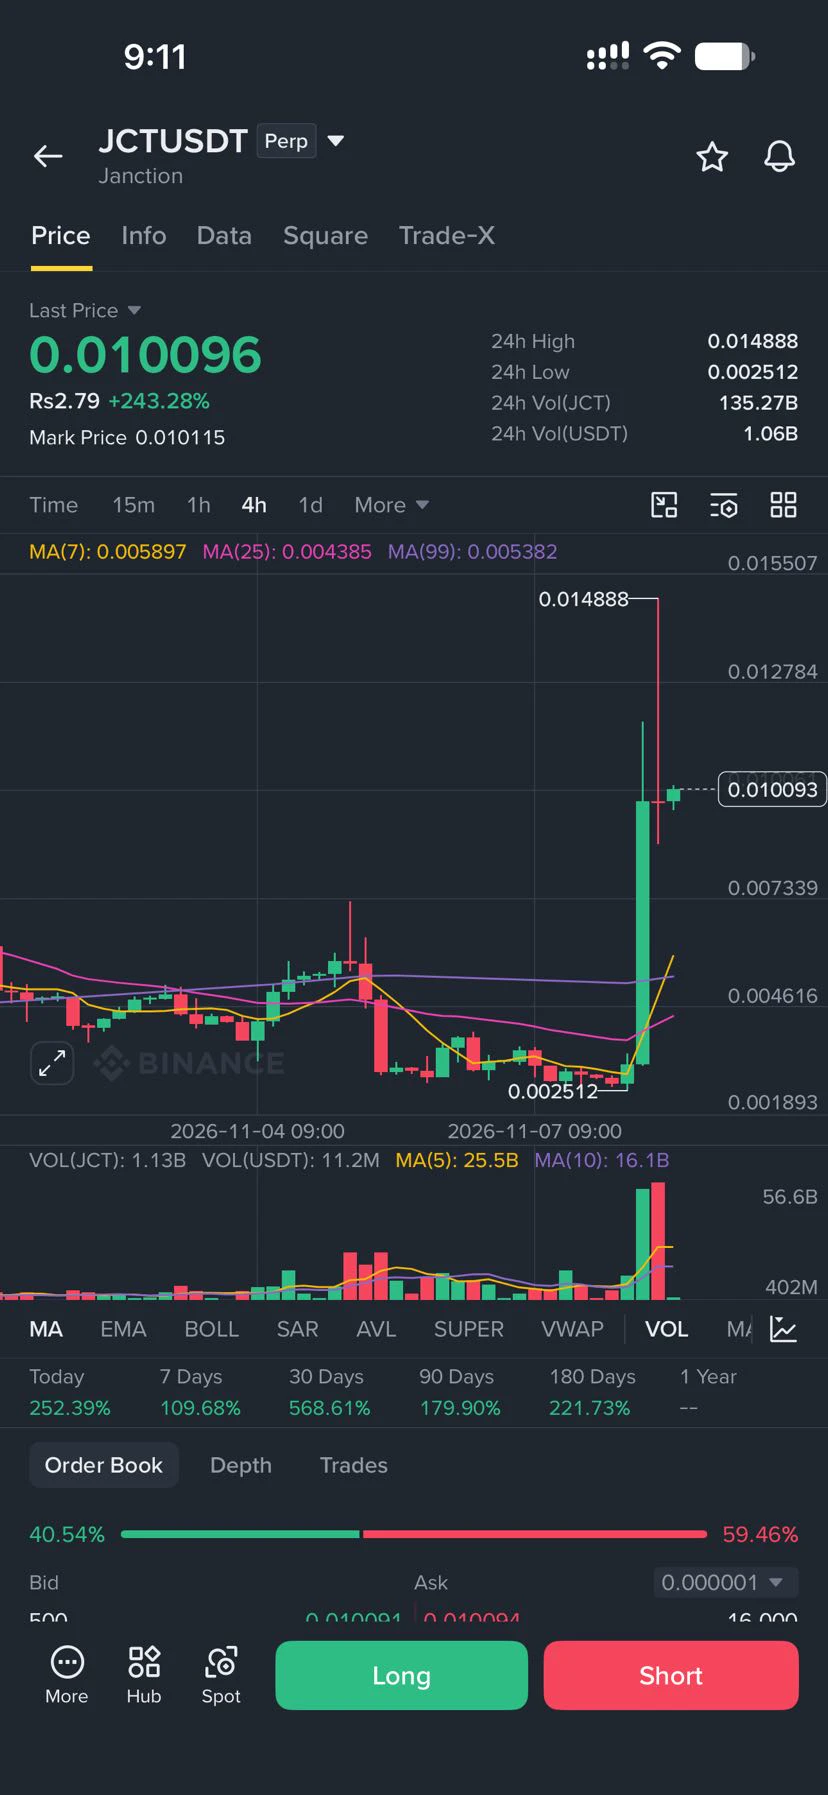
$JCT 4h Perp | Janction

Low was 0.0025, tagged 0.0149, now 0.0101, still far over the stack.

MAs: 0.0059, 0.0044 and 0.0054 all under price.
Volume exploded on the green candle. Range today 0.0025-0.0149.

Watching 0.0059 as the line. Lose it and the move is just a wick. Hold it and 0.0149 stays the reference.

Just the chart. Not a call.

#USCPIDataIncoming #USAIStocksHitHard
post-image
JCT-3.26%
What’s the easiest thing to misread when $ONE’s two timeframes haven’t aligned yet?

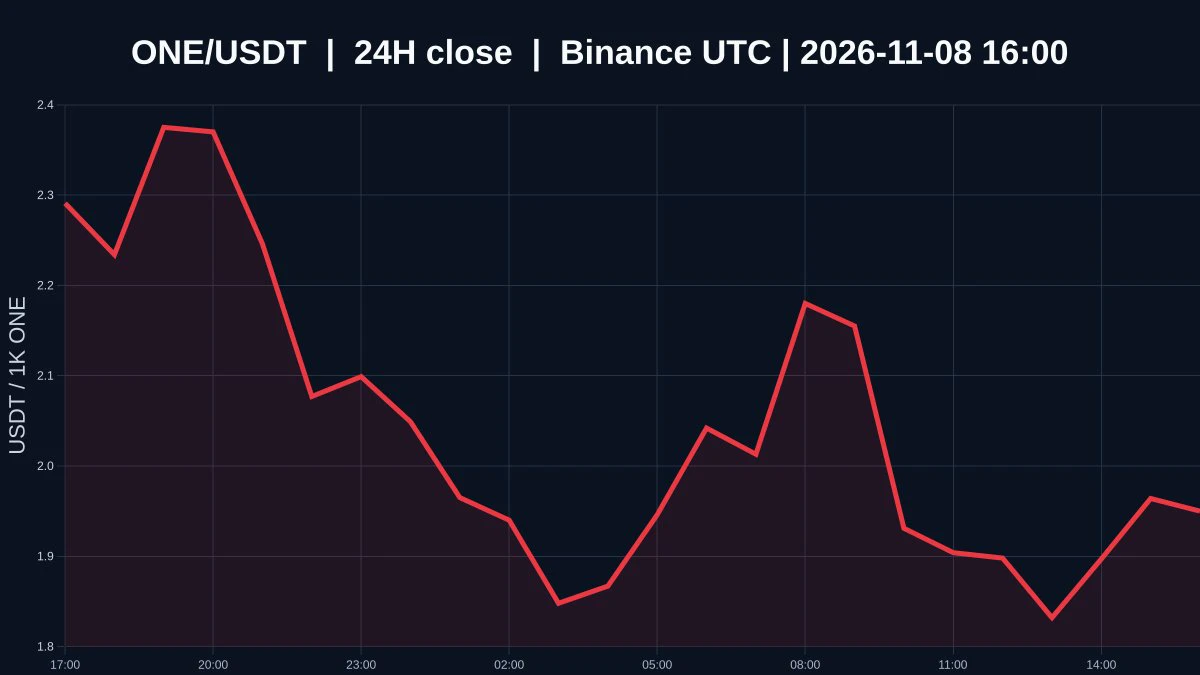
$ONE is currently priced at 0.001949, down 4.414% over 24 hours, with an intraday high of 0.002476 and low of 0.001807. The 1-hour trend is weak, while the 4-hour trend is strong. The volume ratio is 0.014056731291001177. Selling pressure emerged first on the shorter timeframe, while the larger timeframe has not turned weak in tandem. This looks more like an unconfirmed direction than a clear pullback that has already taken shape.

In terms of price levels, the 1-hour support is 0.001807 and resistance is 0.00
post-image
Bitcoin Doesn’t Need Banks, but Strategy Wants to Become a Bitcoin Bank
live-cover
LIVE782
#美股AI板块遭遇重挫 $BTC Why did crypto plunge so hard last night? Besides the $ETH ‌AI regulatory panic, there was another easily overlooked factor: Trump’s company just transferred $343 million worth of Bitcoin to an exchange🚨
On November 5, the day after Democrats retook both the House and Senate, Trump Media & Technology Group transferred about 4,259 BTC to a trading platform—nearly a third of its Bitcoin holdings.
The timing was just too perfect!!! As soon as the election was lost, Democrats immediately started calling for an investigation into the Trump family’s crypto business. With Congress
BTC-0.65%
ETH-1.23%
1000U’s three ways to die, and the only way to live
With small capital, there are only three ways to keep wiping out. See which one sounds like you.
Way to die #1: Going all-in
1000U, 20x leverage, betting it all in one go.
Get the direction right, double your money in a day; get it wrong, go to zero in a day.
The problem isn’t whether you’ll be wrong—it’s that you will be. It’s only a matter of time.
And if you go all-in, you only get to be wrong once.
Antidote: Risk no more than 2% per trade.
With 1000U, that’s a loss of just 20U. You can be wrong 50 times in a row and still be standing.
Way
post-image
BTC-0.65%
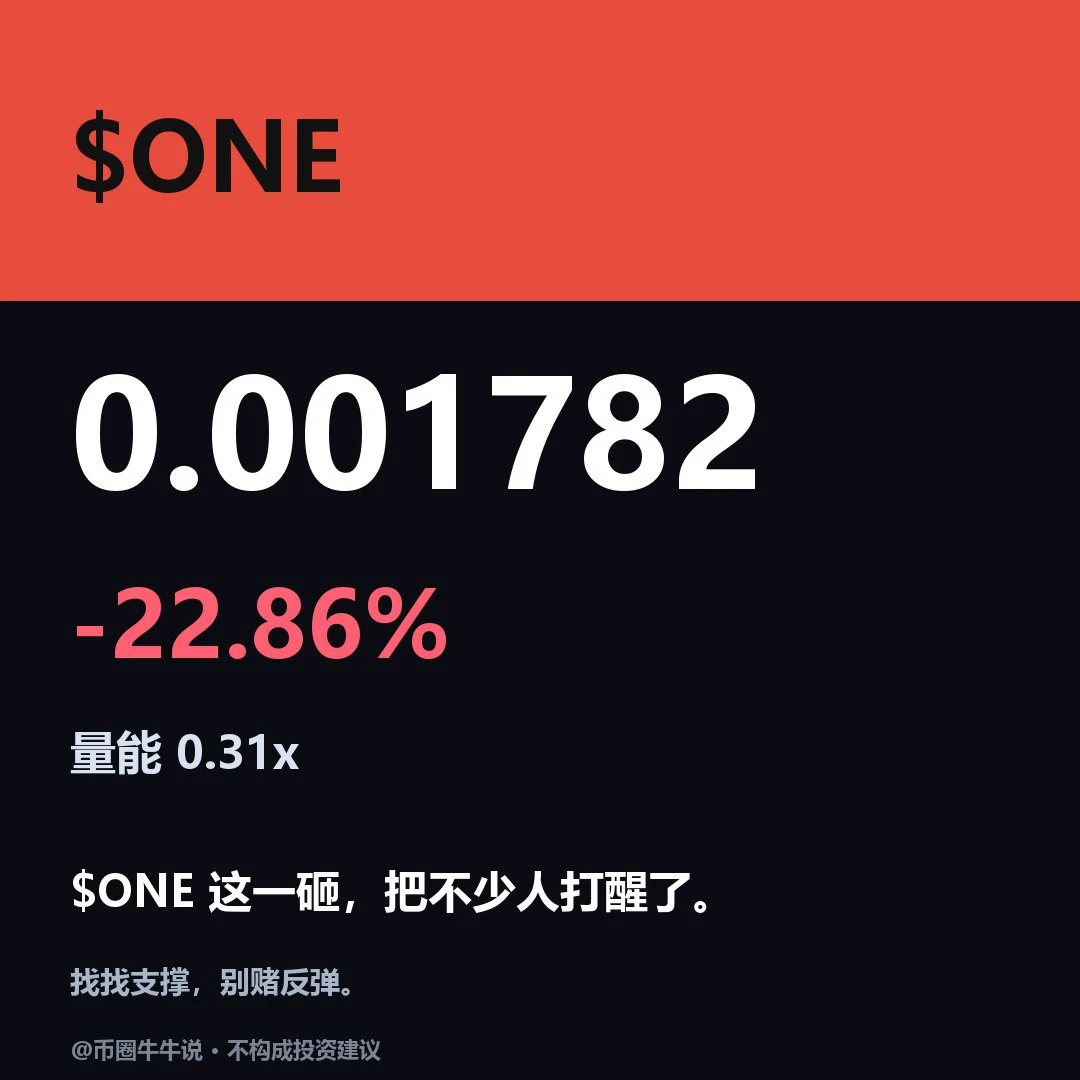
$ONE Current price: 0.001782, 24H -22.86% (0.001692–0.00243). 1H is weak: RSI 46.84/EMA20 0.001937, support at 0.001692/resistance at 0.00243; 4H is strong: RSI 58.43/EMA20 0.001732, support at 0.001027/resistance at 0.002476. The bullish condition is holding above the 0.00243 resistance level; the bearish condition is breaking below the 0.001692 support level. Key points to review are whether 0.00243 holds and whether price can recover after losing 0.001692; the setup is invalid without volume confirmation, with the volume ratio at 0.31x. Market volatility is high; for observation only.
post-image
btc eth and altcoins
live-cover
LIVE1,638
Load More

Join 40 M users in our growing community

⚡️ Join 40 M users in the crypto craze discussion

💬 Engage with your favorite top creators

👍 See what interests you

Trending Topics

USCPIDataIncoming

12.56k Views1.63k Discussing

The U.S. October CPI report will be released on November 10 at 8:30 a.m. ET. September CPI came in at 3.7% year over year, and markets will be watching closely for signs that inflation is cooling, especially in core CPI. A softer-than-expected reading could strengthen rate-cut expectations, while hotter inflation may pressure risk assets through higher Treasury yields and a stronger dollar. How do you think this CPI print will move $BTC, U.S. stocks and gold?

USAIStocksHitHard

28.11k Views3.74k Discussing

USNonfarmPayrolls

53.62k Views4.48k Discussing

View More