Square
Following
Hot
News
Profile

CryptoWorldDirector

vip
Futures Trading Strategist
Market Analyst
Crypto Market Researcher
Understand trading logic and respect market facts. Simplify complex analysis so that ordinary people can also make a living through trading!
0
Following
711
Followers
540
Liked
“The Crypto Crash Is Imminent; Risks Loom as Storage Stocks Rally!”
Yesterday, we analyzed where Bitcoin’s target for this leg down might be. Today, Bitcoin is still trading within this hourly consolidation. Trading plan: If an upward BOS appears on the hourly chart and breaks out of the consolidation, wait until price reaches at least around 81,700 before shorting. You can look for longs along the way using the 15-minute chart.
If a downward BOS occurs, short at the rebound order block or FVG. Why wait here? It’s common for market makers to mess with you one more time before a real trend begi
BTC-0.67%
ETH-1.26%
SNDK+3.84%
  • 3
After the market opens tonight, keep an eye on SanDisk for a wick down to 1240 followed by a rebound, with Micron at 880 as the corresponding setup. Just pick one. Invalidation: the London session low fails to be reclaimed on a 15-minute close.
The expectation for Micron here is a liquidity sweep of last week’s 932 high, moving up to 955-960. SanDisk is near the 4-hour downtrend line; if it pushes higher, consider shorting around 1400.
Although the weekly chart looks poor, there’s still room for small long trades on the 4-hour timeframe. They don’t conflict.🤡
SNDK+3.84%
Featured“BTC completes the shoulder pattern; where is the downside target? Storage stocks are in a crunch, with risks and opportunities coexisting in November!”
BTC completed the shoulder pattern as expected, and a break below 80K arrived at the end of the month. Where might support be? Can storage stocks keep rising? There are no signs of a bottom forming yet, so the outlook is doubtful...
First, let’s look at BTC. In Chief’s analysis last Friday, he mentioned that BTC urgently needed to break below 80K to confirm the completion of the shoulder pattern. BTC indeed put in extra hours over the weekend,
BTC-0.65%
SNDK+3.84%
  • 1
Bitcoin in Peril, Right Shoulder Completed Early? Storage Stocks Consolidating in a Triangle, Awaiting Direction.
Bitcoin’s daily chart is flashing warning signs. What would signal that the right shoulder has completed early and a decline is beginning? Sandisk’s inflection date is November 5-6; on the 4-hour chart, it’s time to watch for a potential bottoming pattern.
First, Bitcoin’s price has fallen below the moving averages on the daily chart. After yesterday’s bearish candle broke below the middle band, a move to test the upper band again in the short term looks unlikely. Key short-term re
BTC-0.67%
ETH-1.26%
SOL-0.77%
SNDK+3.84%
  • 1
October 19 Market Analysis: Daily Chart Bottom, 4-Hour Chart Finds Support—Is the Rebound Starting?
Not easy, but this storage-sector downturn has formed what looks like its first bottoming pattern on the daily chart. On the 4-hour chart, the candle at 12:00 has officially broken above the BOLL middle band. The moving averages also point to a potential end to the decline, so the daily chart may turn bullish over the next few days (though the large bearish weekly candle means the bullish outlook may not last).
A few levels to watch on the shorter timeframes: For Micron, 926 could act as resista
SNDK+3.84%
MU+3.11%
$ETH Yesterday, liquidity at 2355 was swept, and the price wicked down to the daily EMA144/169 and rebounded, so a small long could be considered on the HTF. On the 4-hour chart, the price reached the BOLL middle band but failed to hold above the moving average, so watch for the possibility of a second bottom. If it forms, go long in the discount zone shown in Figure 1, with a relatively tight stop loss.
ETH-1.26%
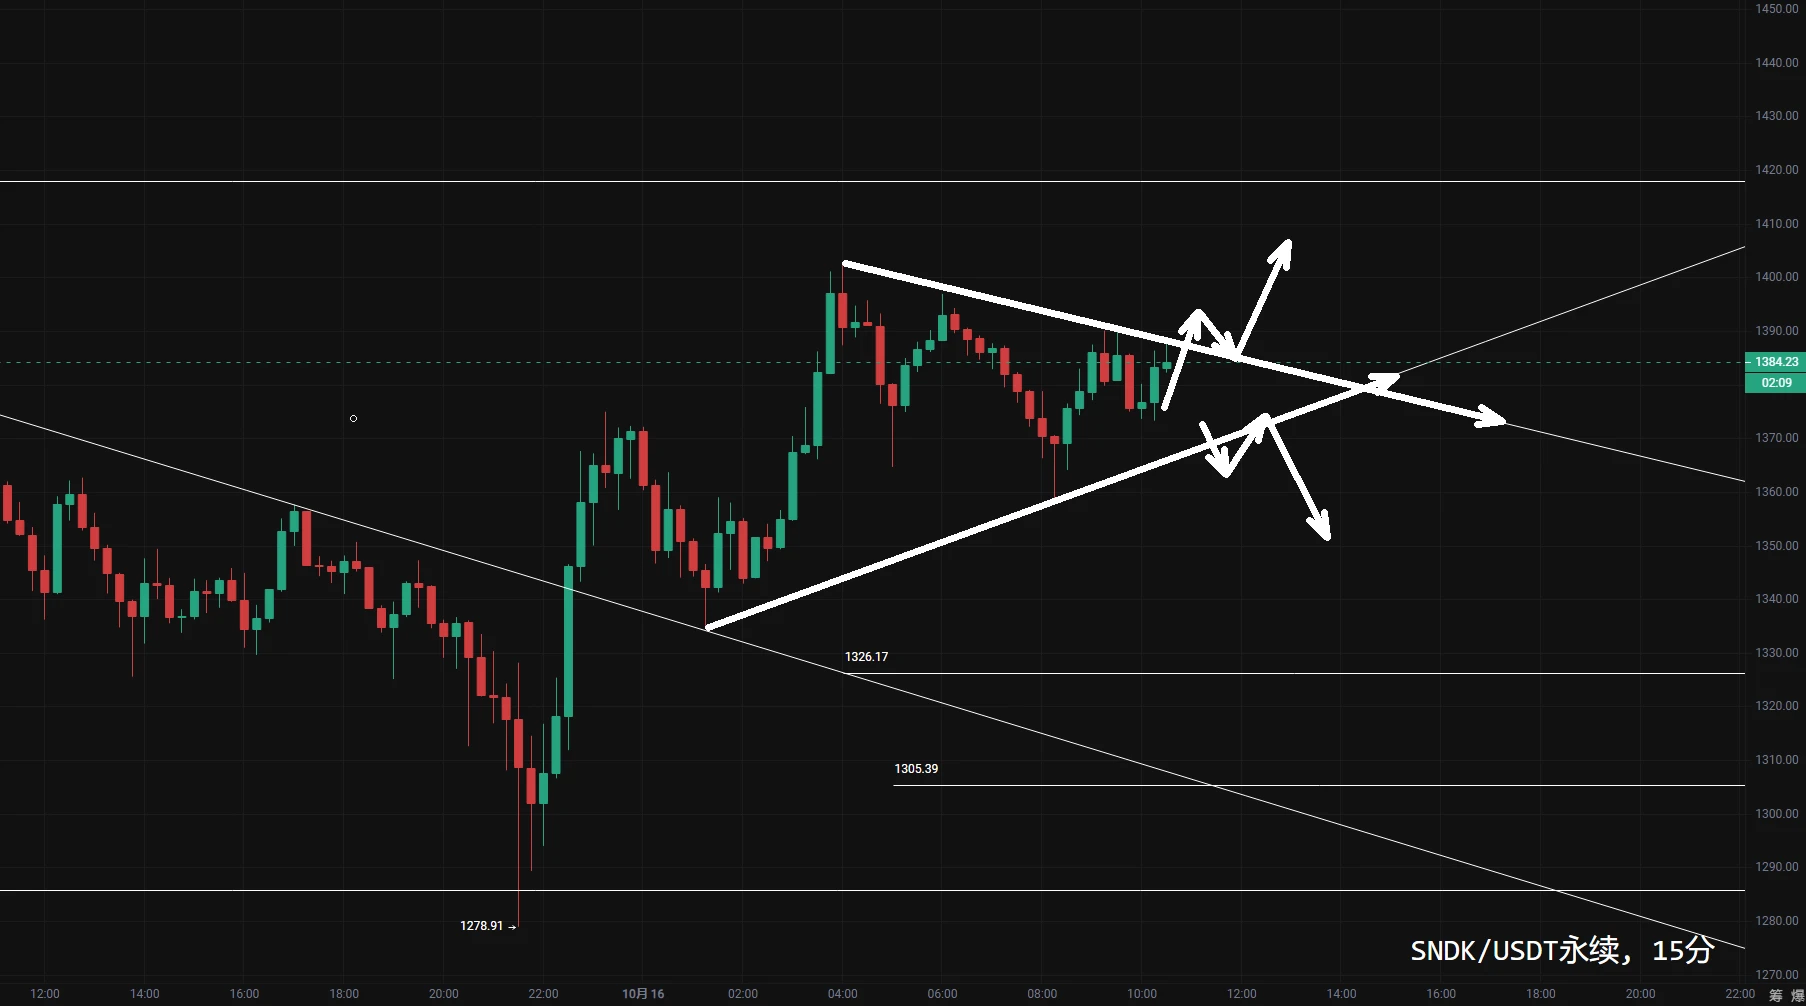
$SNDK The intraday movement is similar to MU's, and we should also watch which direction this 15-minute convergence breaks. If it moves down, the support levels to watch again are between 1325 and 1305. If you want to short, save some firepower—don't even consider it until it reaches at least 1480!
post-image
SNDK+3.84%
MU+3.11%
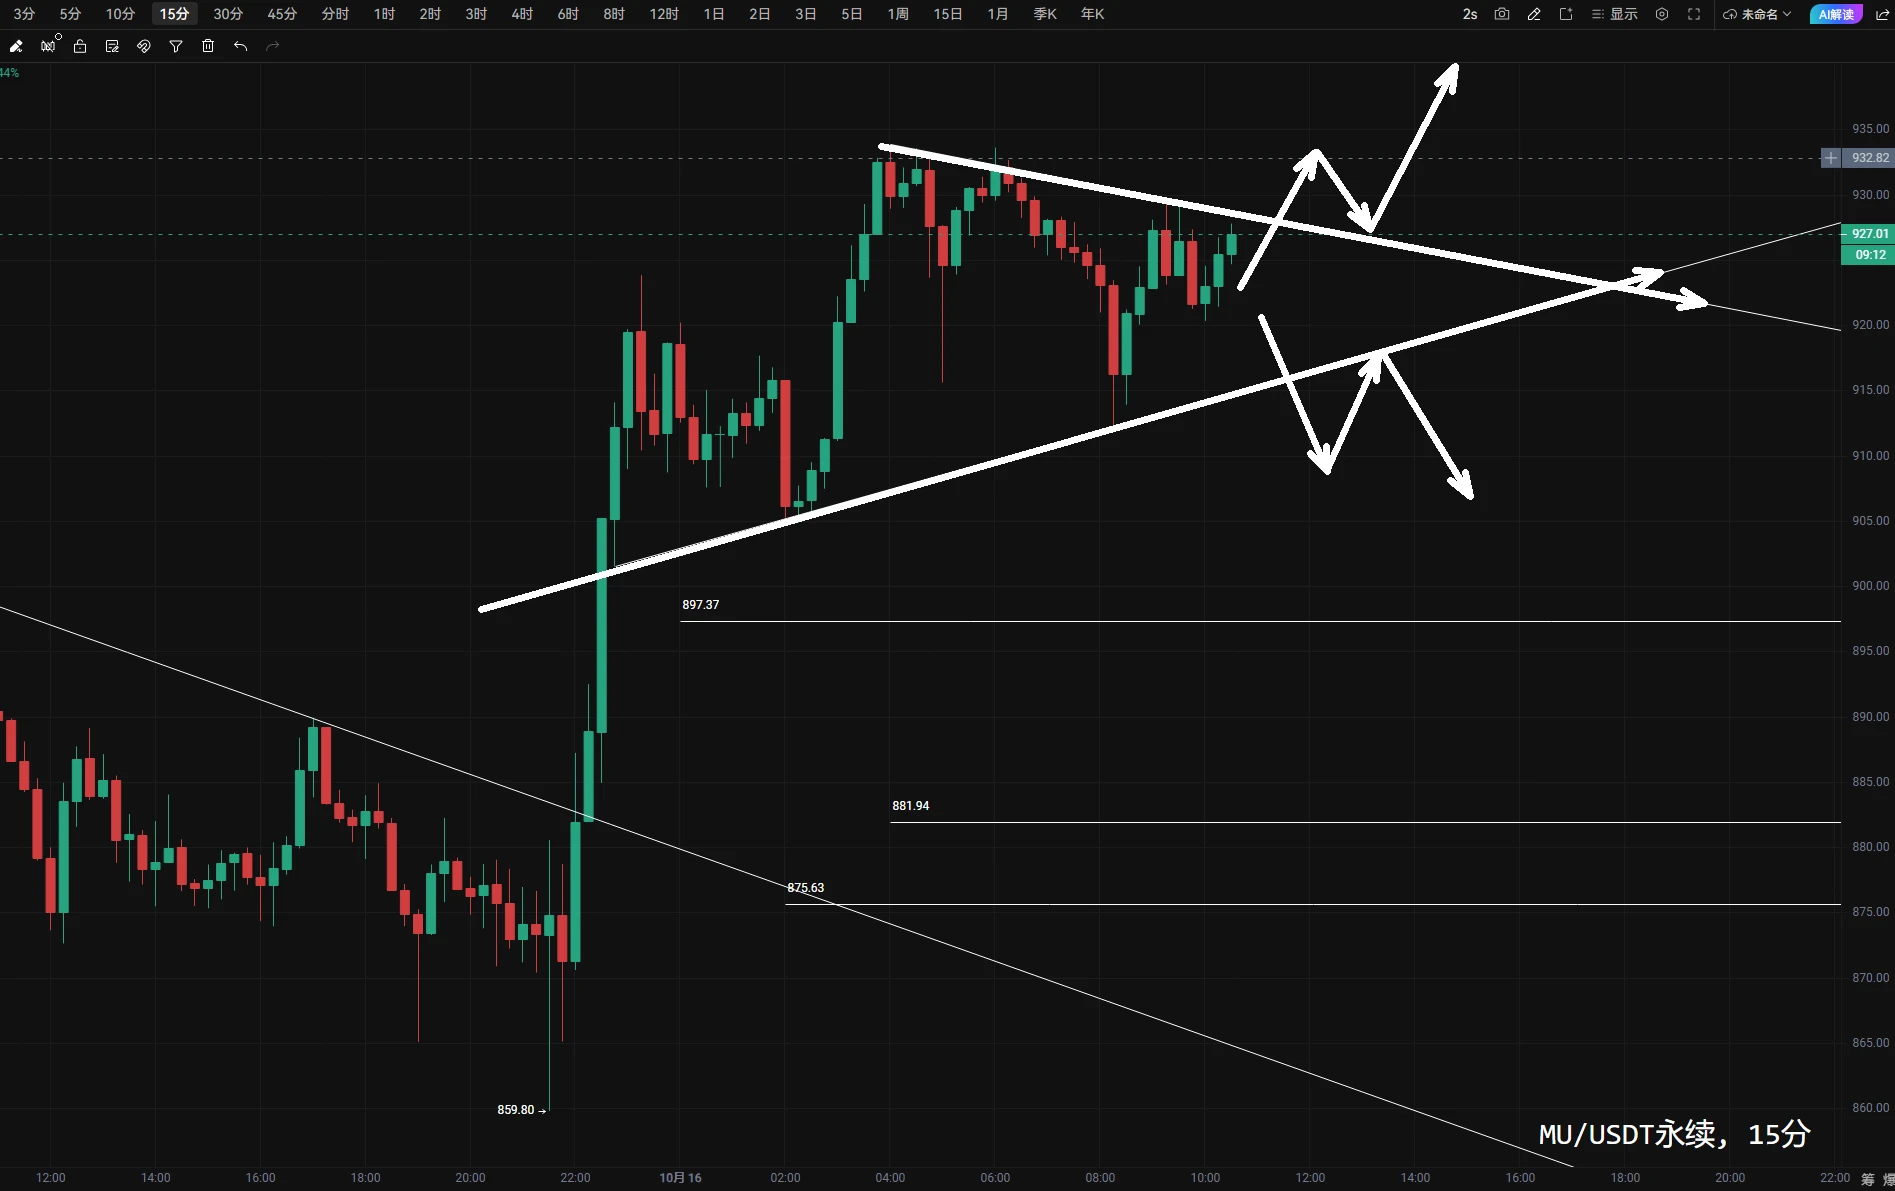
$MU Last night’s pullback was not too deep. If it moves up again, watch the 4-hour OB955 for a pullback; shorts can be considered here. The 875–882 area below can be used for a rebound. The current 15-minute chart is converging, so just see which direction the convergence chooses during the day. If you don’t know how to identify stop-loss levels, watch Section Chief’s ICT Tutorial Episode 03: Market Structure!
post-image
MU+3.11%
10.14 $BTC $ETH market alert: The key point is still the same as yesterday: for BTC, watch for liquidity to be taken at the hourly EQH, and pay attention to a pullback at 84800. Below, watch for a bounce from the hourly BPR + order block at 819-816! ETH is not as ugly, with 2560 as resistance; below, watch for a bounce at 2455-2440! CPI is being released again today, and the square economists are taking action again. We’ll stay put and see what’s going on before the market opens tonight!
BTC-0.67%
ETH-1.26%
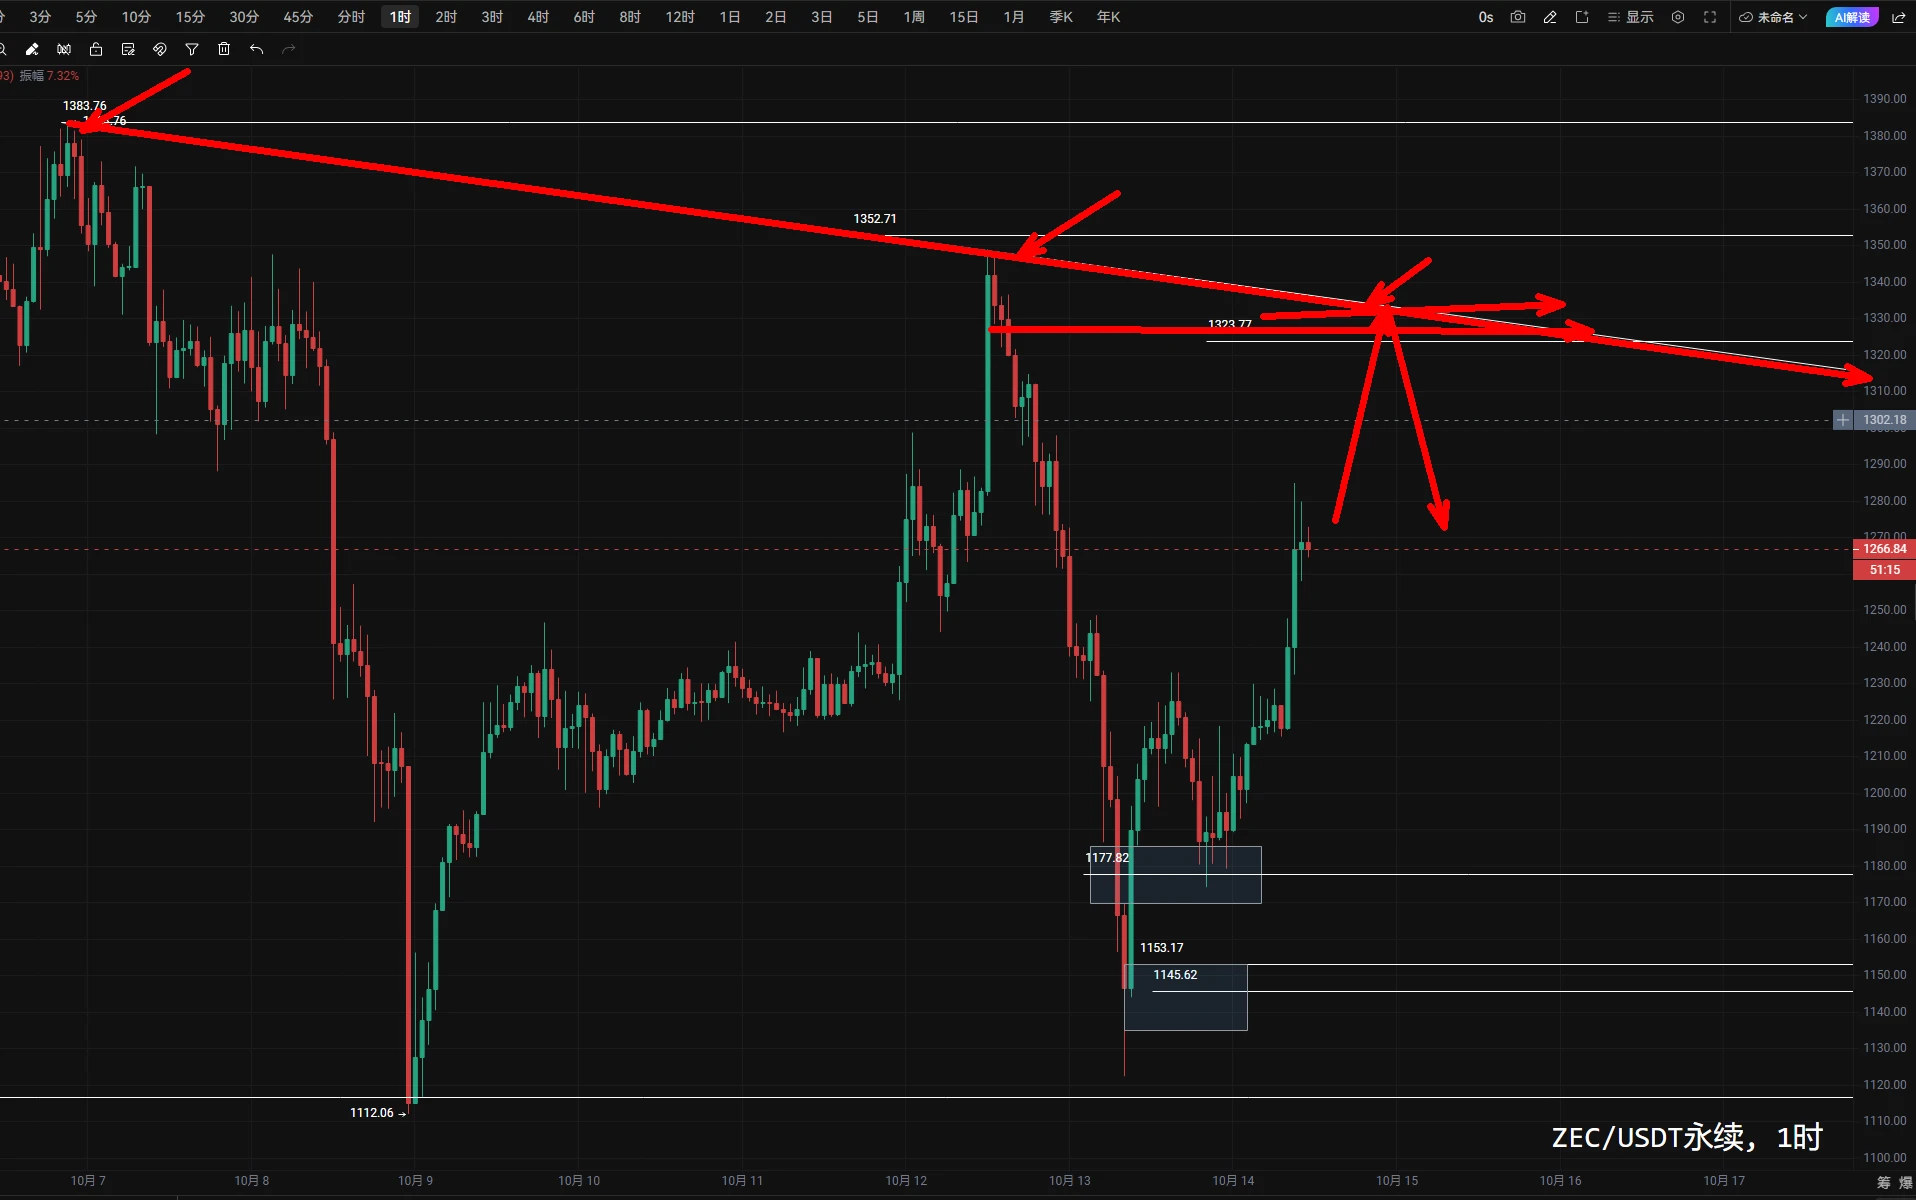
$ZEC Yesterday’s hourly chart had a BPR, not sure if B friends noticed. The market also rebounded after reaching the BPR around 1177. Captain Ke felt the stop-loss was too wide, so he didn’t alert anyone to take the trade and chickened out again. The potential pullback area next is 1325-1330. When it touches the hourly trendline, it may be worth watching. As for going long, wait and see; for now, the main focus is whether there will be a pullback around 1330.
post-image
ZEC+1.29%
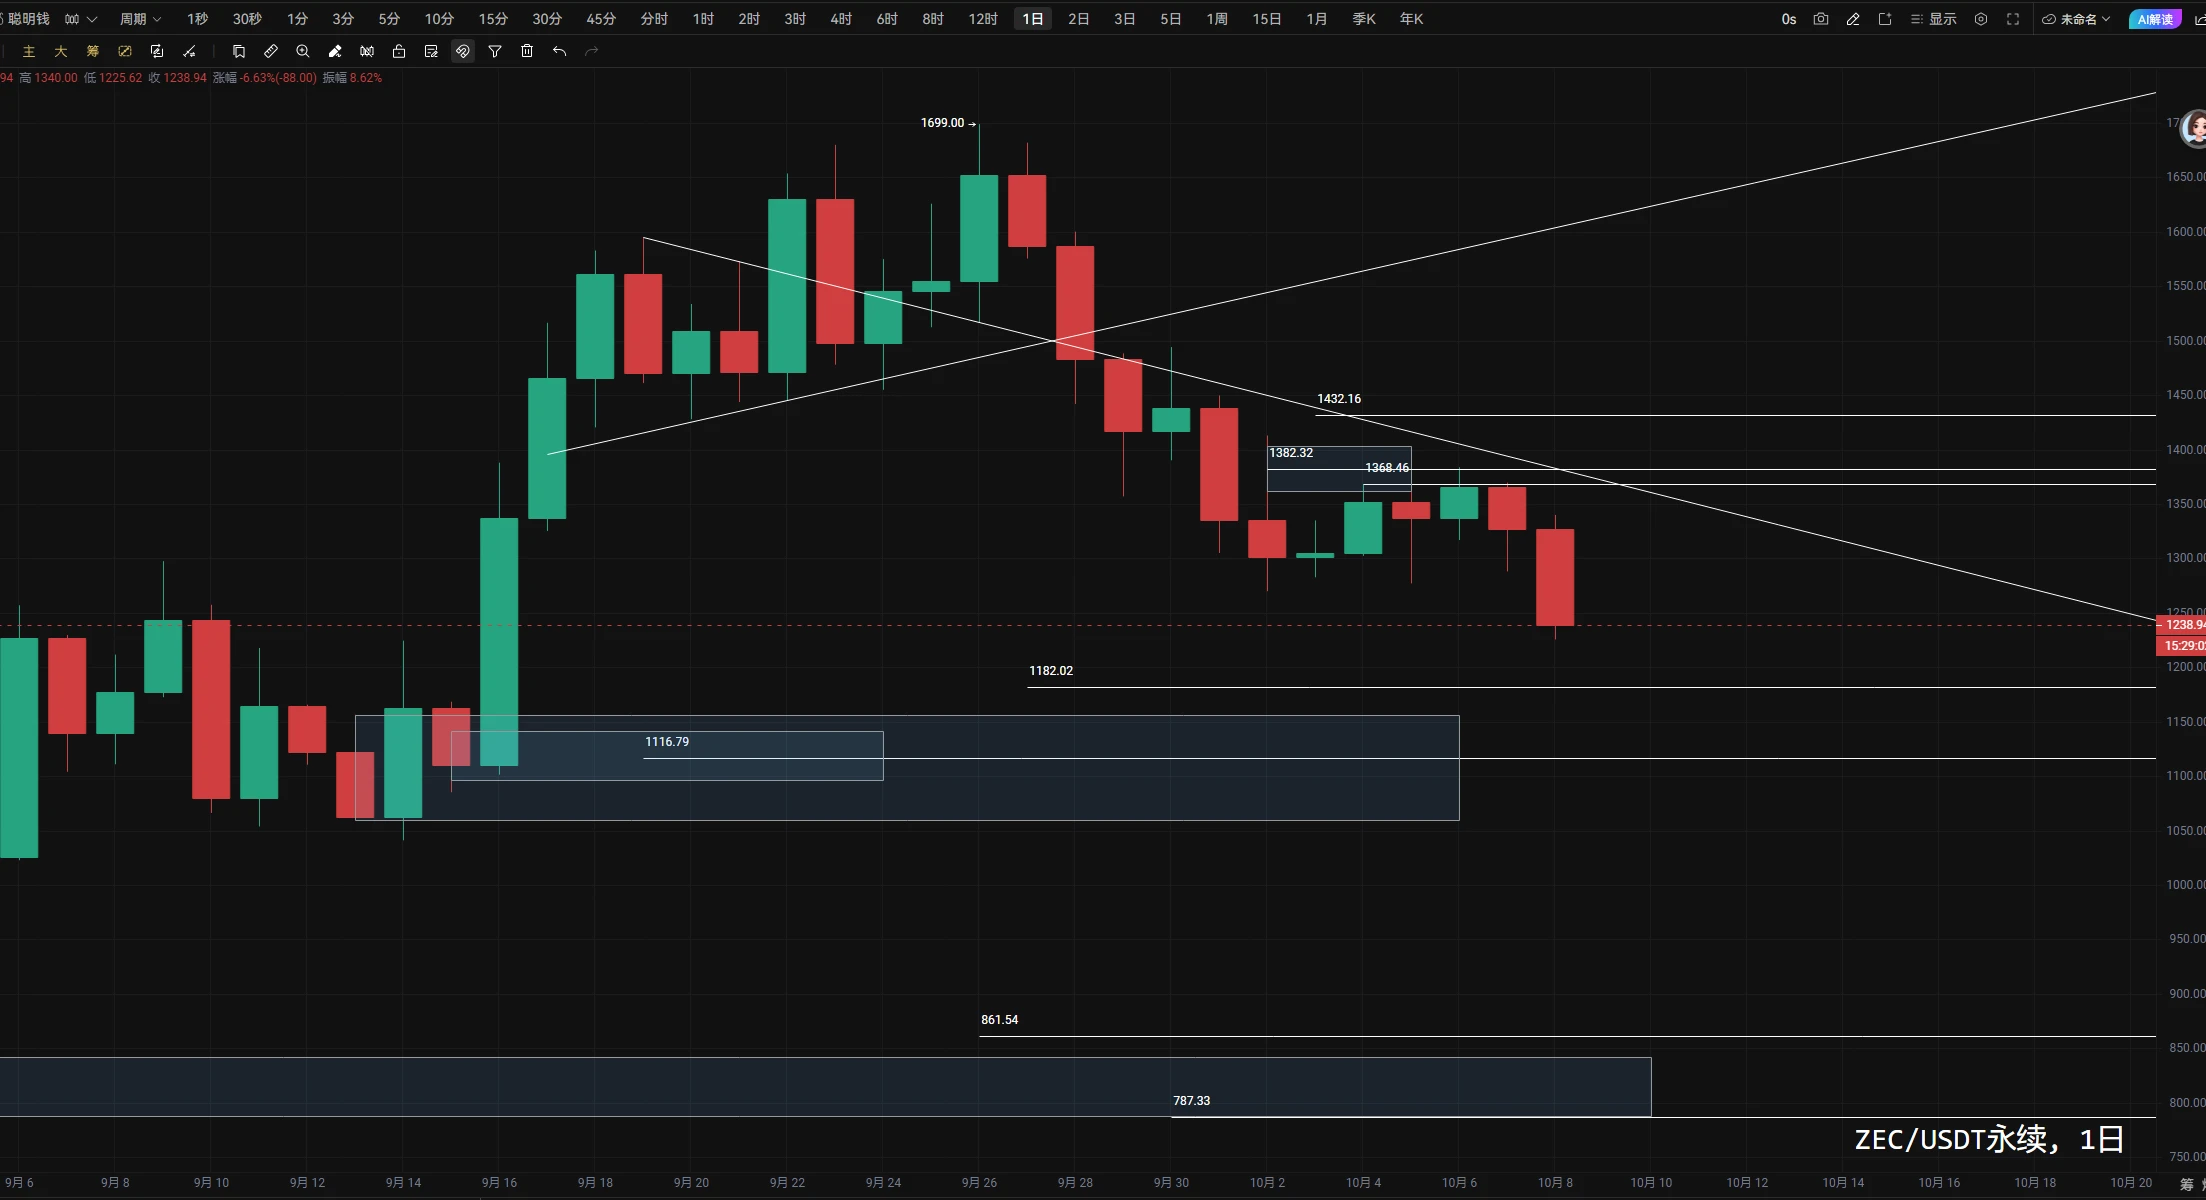
The cancellation of the short position at $ZEC 1380 was really disappointing. 😅
Next, let’s continue watching the 1115 level and see whether a good rebound comes.
post-image
ZEC+1.29%
Section Chief's ICT Trading Cognition Course, Issue 03 (Market Structure)
90% of losing trades fail to answer one question before entry: Is the market currently in an uptrend, a downtrend, or a consolidation range? ICT calls this “reading structure,” and it is the foundation of all analysis.
1. ICT uses four letters to describe trends:
HH (Higher High) + HL (Higher Low) = uptrend. Each pullback low is higher than the previous one, showing that buyers are willing to step in at higher prices.
LH (Lower High) + LL (Lower Low) = downtrend. Each rebound high is lower than the previous one, showing
post-image
Section Chief’s ICT Trading Cognition Course, Episode 01 (What Is ICT? Understanding the Smart Money Trading System)
Starting today, the Chief will introduce the ICT trading system from scratch. Why are the Chief’s levels so accurate? A large part of it comes from drawing on ICT theory.
GLDX-0.40%
PAXG+0.37%
September 8 $BTC $ETH Market Analysis: Downward Choice After a Narrow Range? Will Last Week’s Low Liquidity Be Swept?
Today, BTC has already fallen below the 79,200 level where we went long on Friday and failed to move back up. The 79,200 area remains a support-resistance flip level these days. On a smaller timeframe, BTC’s failure to reclaim 79,200 is indeed unfavorable for further gains.
Also note that last week’s low of 76,100 and the August 23 low are relatively close, both around 76,000. With these two roughly equal lows, could BTC wick below both of them later? The most likely rebound a
BTC-0.65%
ETH-1.23%
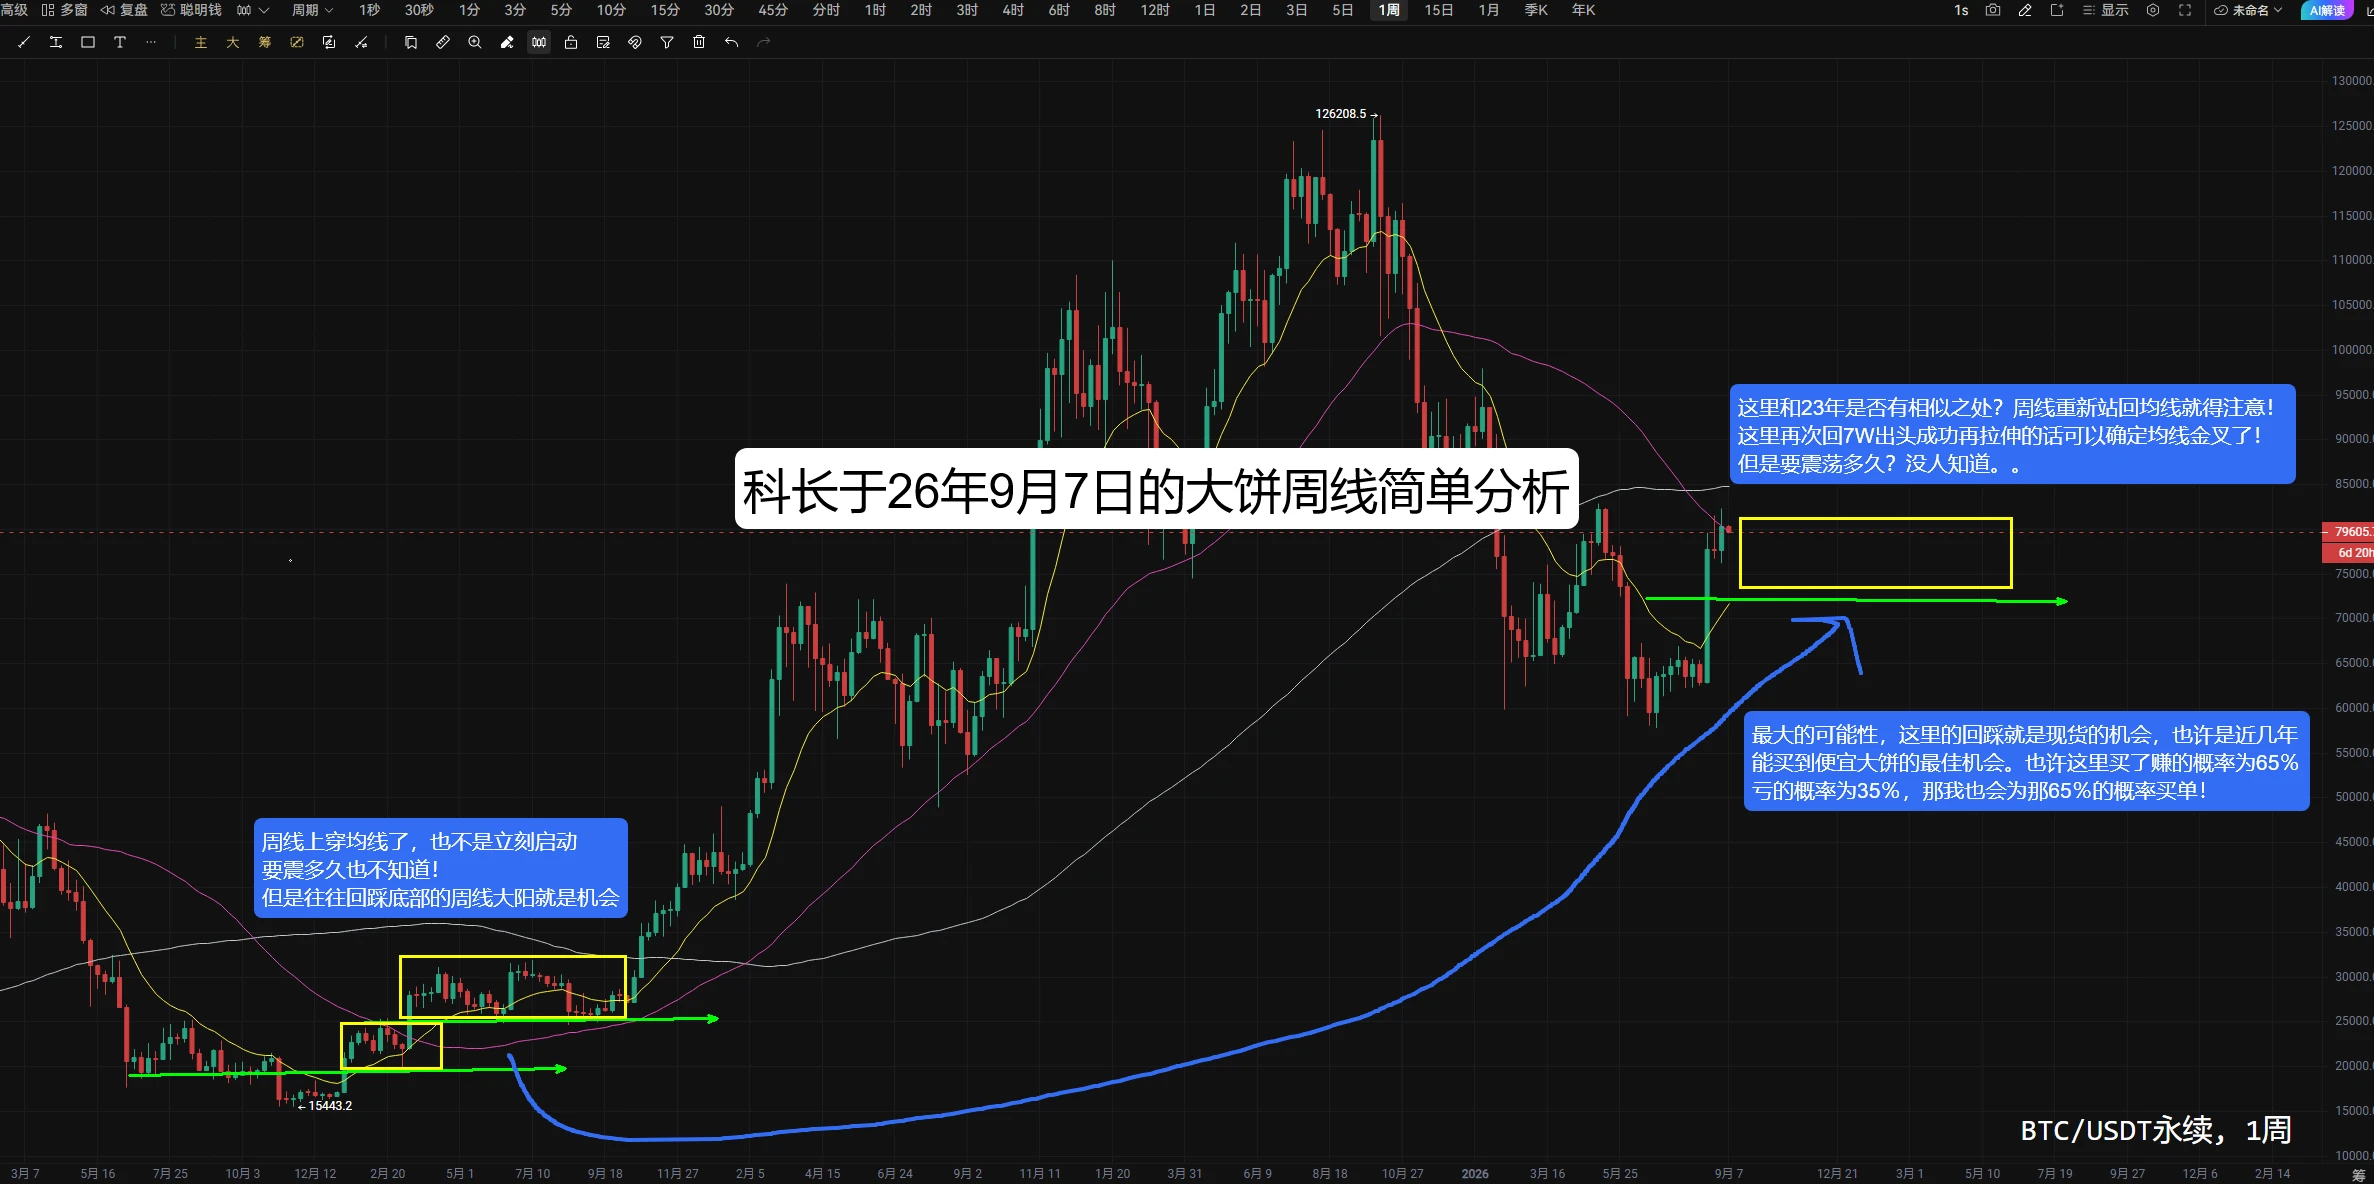
September 7 $BTC $ETH Market Analysis: Daily Chart Enters Consolidation, Major Opportunity on Weekly Chart! Watch Seriously!
The levels given by Section Chief Ke in last Friday's market saw rebounds: BTC 79,200, ETH 2,440, and SOL 100.6, all of which were levels Section Chief Ke recommended going long. BTC remains under pressure from the large bearish 4-hour candle on the 4th. The 4-hour chart is narrowing and has once again entered a narrow-range consolidation. The minor support below is 78,150–78,350. Pay particular attention to the liquidity-sweep rebound area at 74,500; reaching it this w
post-image
BTC-0.65%
ETH-1.23%
8.26 $BTC $ETH Market Analysis (with Long/Short Levels): The Longer It Grinds, the More Favorable It Is for the Bears
Monday’s weekly analysis of Bitcoin’s market mentioned the possibility of a pullback after breaking above 80,000 again. Yesterday, I also chased a short position around 80,200 and caught a 2,000-point drop.
For Bitcoin’s short-term trend, the focus remains on the 78,400 level mentioned yesterday. Once an hourly candle closes below this level, the price may continue moving downward. After this range breaks, placing limit buy orders may only be considered around 74,800.
The shor
BTC-0.65%
ETH-1.23%
8.24 $BTC $ETH Market Analysis: A Perfect Prediction of the Mid-Month Trend Reversal—What Is the Best Strategy When the Bull Market Comes?
When Captain wrote this analysis on 8.10, most people scoffed at the mention of an upward trend reversal between the 17th and 20th. Now that the market has moved accordingly, on the higher timeframe, we should indeed change the habit of blindly shorting. Of course, this does not mean you cannot short; rather, at certain support levels, you should shift your thinking toward going long or buying spot instead of desperately chasing shorts while expecting a pl
BTC-0.65%
ETH-1.23%
Everyone is talking about the bull market, but the Section Chief isn't particularly excited.
The Section Chief is first of all happy for those who have achieved results and for the newcomers who have joined in, because you may soon have the chance to change your life or destiny.
At the same time, the Section Chief already feels sorry for those who lose everything after this round ends—you will become the majority after the bull market.
Over the past several cycles, this story has played out again and again. You saw the beginning, but the Section Chief saw the ending.
Here are a few suggestions
post-image
8.21 $BTC $ETH Market Analysis (with long/short levels): The bull market is coming, the bull market is coming—don't force short positions when there is no short signal.
Consecutive large bullish candles have pushed Bitcoin above $75,000, and quite a few B-friends are getting restless about opening short positions again. First, let's look at the current market: Bitcoin's 4-hour average K-line has not formed a doji or bearish candle, while Ethereum is still moving along its short-term uptrend line. Don't blindly go short before a breakdown appears.
Only open short positions after a signal appea
BTC-0.67%
ETH-1.26%
Load More