


Square
Following
Hot
News
Profile
Share your thoughts
placeholder
Article
what’s better than a rave to end a crypto week
thank u @RaveDAO
post-image
RAVE-0.93%
$HBADG is having a good run up because of @CowrieProtocol mining goes live tomorrow.
The app is now available on Android and IOS. This will be huge. Position your self now before it goes live tomorrow. Use my invite code: “marjidcryptonite” to be part of my circle.
Join me on Griot:
$BZ /USDT is range-bound but a short setup is hiding in plain sight.

$BZ /USDT - SHORT

Trade Plan:
Entry: 102.28 – 102.62
SL: 104.12
TP1: 101.20
TP2: 100.36
TP3: 99.11

Why this setup?
Why now? The 1h price is sitting at 102.45 inside a tight entry zone between 102.28 and 102.62, while the 15m RSI at 60.05 shows momentum is neutral, not overbought. The 1h ATR of 0.695998 means a single candle can easily cover the distance to TP1 at 101.20, which is a clean first target below the entry. If price pushes further, the invalidation level at 101.73 acts as the hard line in the sand that would w
BZ-0.70%
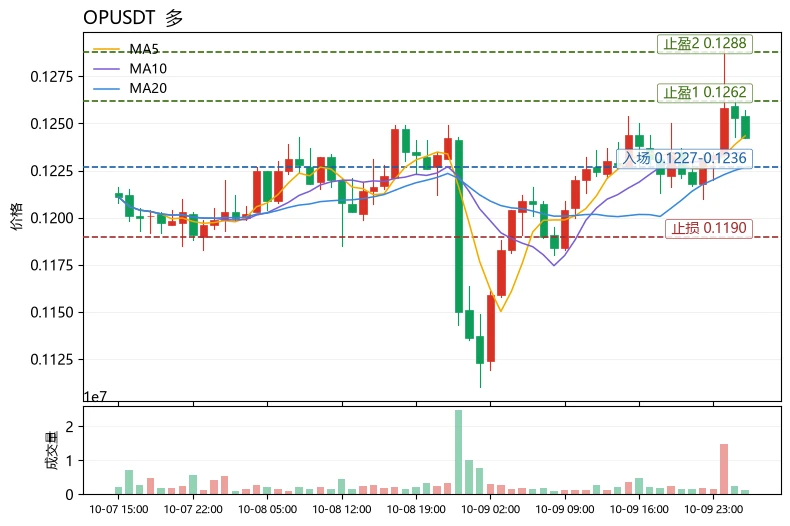
$OP The most unusual point today: it rose +7.91% over 24h, but RSI is only 55.6—the price has reached a notable high within nearly 30 candlesticks, while the momentum indicator remains below 60, indicating that this move is being driven by capital rather than a full-blown surge in sentiment.
Structurally, MA5=0.12434 has just crossed above and held over MA20=0.122675, with a bullish short-term moving-average alignment beginning to form. The MACD histogram remains positive at +0.0002448, so the bullish structure has not been broken. However, the current price of 0.1242 is already close to the B
post-image
SUI+1.26%
$US Continue holding, don’t sell.
US+112.85%
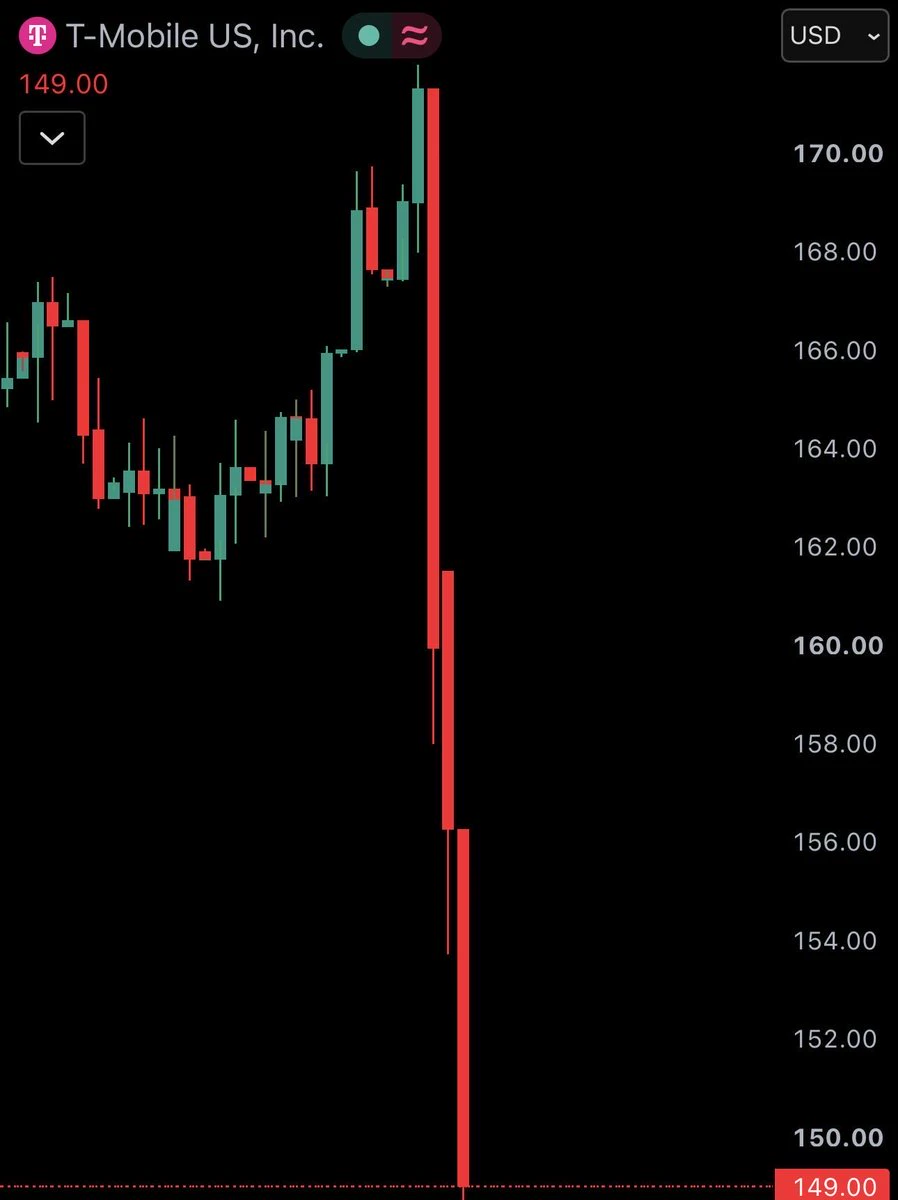
If you invested $10,000 in T-mobile 24 hours ago you would’ve had $8,600 now
post-image
There’s always another issue with self-custody wallets.
Stop taking unnecessary risks with your own keys. Use a trusted, regulated CEX instead.
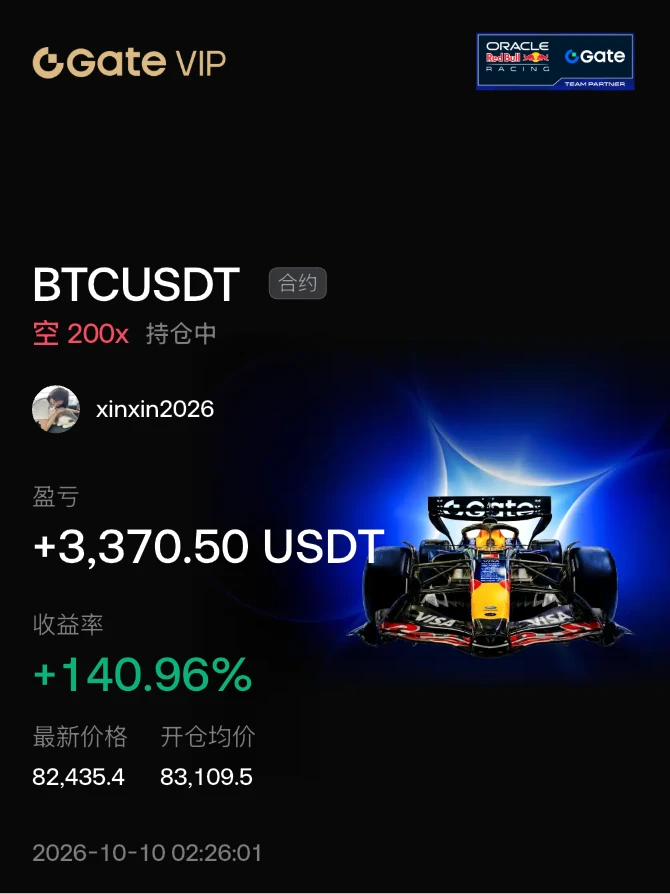
#晒出我的持仓收益 Did you manage to get in on the gains today?
post-image
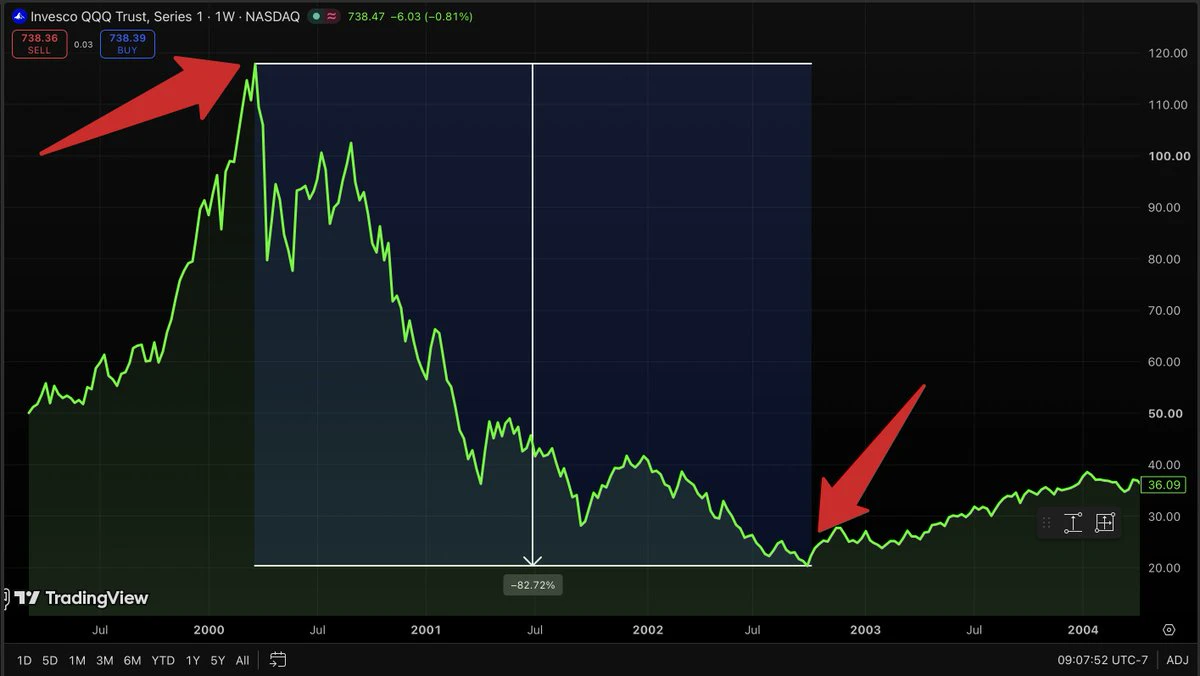
The ABSOLUTE worst day in ALL history to buy the Nasdaq $Q was March 27, 2000.
$117.75 a share. The very top of the dot com bubble.
By October 2002 it was $20.06. Down 82%.
It took about 15 years just to get back to even... & that's WITH dividends reinvested.
But if you bought that exact day & did nothing, today it's around $740. About 7x your money with dividends.
Now the person who bought in October 2002 at $20... that's about 37x on price alone.
Same fund. The only thing that changed was the price paid.
That's why I don't buy just because something is going up. I want great companies/ETFs t
post-image
NDAQ+1.37%
  • 1
Datacenters, or to be precise, super intelligence, can solve education, healthcare and climate change.
The "progressive" fear progress. They resist change. They should really call themselves conservatives...
post-image
October 9 ETH recap
Midday observation$ETH The market’s upward trend remained intact, so I chose to follow the trend. The long trade idea played out, but unfortunately it did not reach the second take-profit target at 2530, with an intraday high of 2518. The Plan B short trade idea did not reach the entry range, but the intraday low stopped at the second take-profit target for the short.
#Gate亮相TOKEN2049
If the strategy is this accurate, the gains after following it are simply unimaginable.
#GateWCTCS9全球交易赛
#BTC回调触及81000美元
Original content no longer visible
ETH+0.83%
#FedSeptemberMinutesLeanHawkish
FedSeptemberMinutesLeanHawkish
FEDERAL RESERVE SEPTEMBER MINUTES: A HAWKISH SIGNAL THAT COULD SHAPE THE NEXT CRYPTO MARKET MOVE
The September Federal Reserve meeting minutes have become an important point of discussion for financial markets, as investors carefully evaluate the Fed’s approach to inflation, interest rates, and future monetary policy. A hawkish interpretation of the minutes suggests that policymakers remain cautious about easing financial conditions too quickly, creating important implications for Bitcoin, Ethereum, altcoins, stocks, and the US do
BTC+0.73%
ETH+0.80%
🚨BULLISH: Fundstrat’s Tom Lee says the crypto bull market is already underway and could become the largest cycle yet. 🚀
“Since 2012, there have been 9 crosses above the 200-day moving average. Eight of the nine were bull market flags.”
$LIGHT Up 23% in one day, but look at this trading volume—doesn’t something seem off?
Imagine the fruit stall at the entrance to your neighborhood. It usually sells 50 jin of apples a day. Today it suddenly puts up a sign saying “Last day, 70% off everything,” and passersby go crazy, buying 500 jin. After closing up, the owner tells the tobacco and liquor shop owner next door: “I’ll be back tomorrow, and I’ll double the price.”
That’s what LIGHT’s chart looks like right now. Its 24-hour trading volume is only $7.3 million. For a coin that has risen nearly 24%, this volume is like that fruit st
LIGHT+16.67%
$DOT This rally is a bit like the milk tea shop at the entrance of a residential compound suddenly getting a long queue—yesterday nobody cared at 1.04, but today people are rushing in at 1.2. It’s up 15.3% over 24 hours, with $110 million in trading volume, and funds are clearly shifting from the ETH ecosystem toward Polkadot. The on-chain staking ratio has been rising recently, locking up considerable selling pressure. On top of that, expectations for renewed interest in parachain slot auctions have heated up, directly igniting sentiment. But note that 1.22 is the previous high resistance lev
DOT+15.26%
ETH+0.80%
$HYPE
price is grinding around the 84.48 support, with 59.5% of longs still comforting themselves, but that little spark from the funding rate cannot ignite anything😝 OI has declined and buying support has weakened; there is no point in the bulls stubbornly holding this level. If 84.48 is lost, there is a vacuum below. Retreat quickly—don't wait until the dump hits to react.
post-image
HYPE-0.34%
Global Banks Face New Challenges as Credit Demand and Deposit Trends Diverge
live-cover
LIVE550
Altcoin Trading Volumes Reveal Changing Demand Across Established Crypto Sectors
live-cover
LIVE562
$US has doubled; keep holding and wait for further gains.
US+112.85%
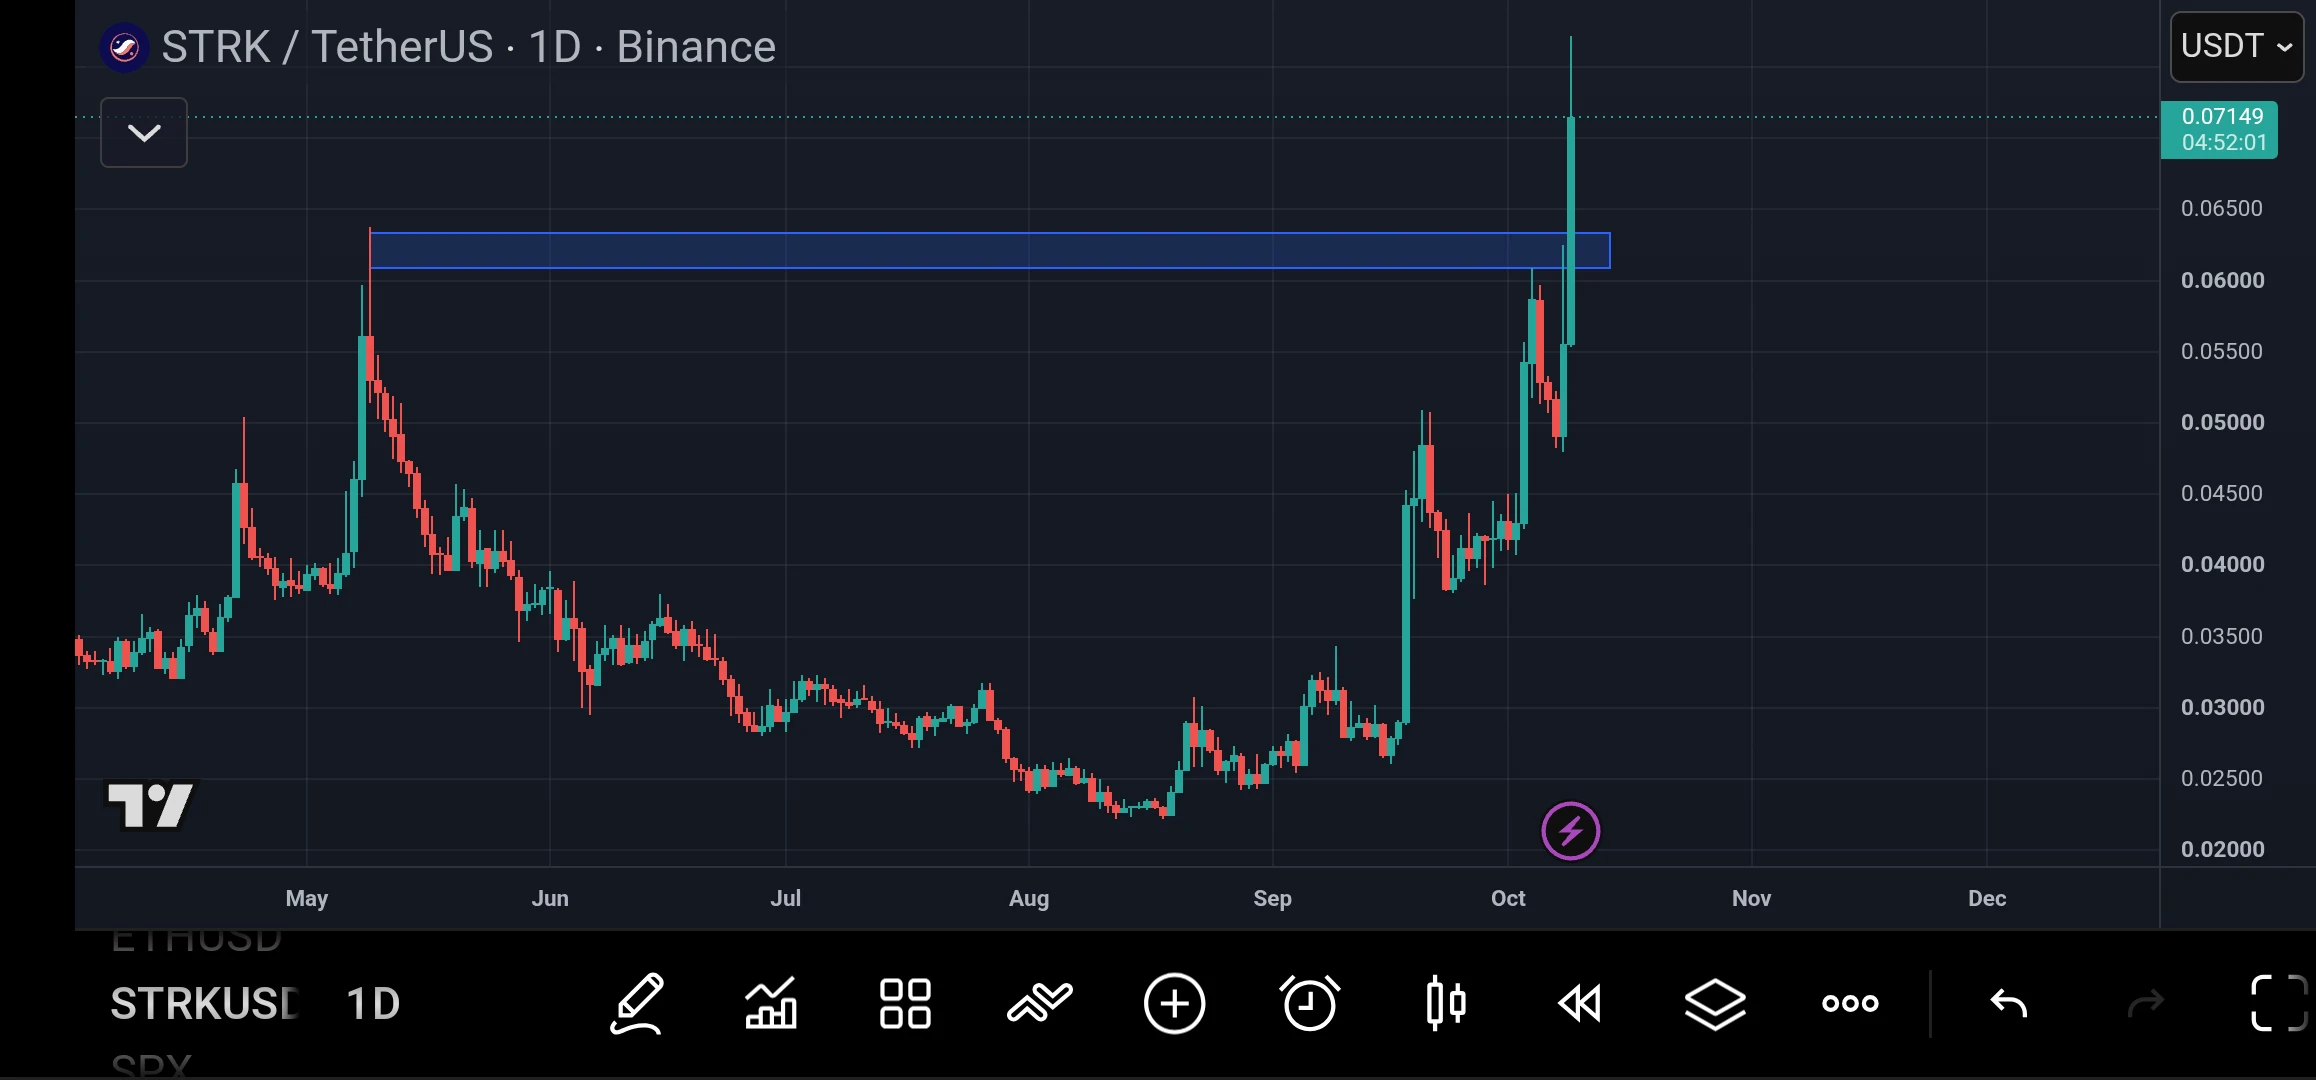
$STRK Breaks Key Resistance on the Daily Chart
STRK has pushed above the major $0.061–$0.063 resistance zone, reaching around $0.0715 with strong bullish momentum.
My view: This breakout looks promising, but the sharp move also increases the risk of a short-term pullback.
I'm watching $0.061–$0.063 as potential new support. If buyers defend this zone, $0.075 and $0.080 could be the next targets.
A daily close back below $0.061 would weaken the breakout setup.
I prefer waiting for a clean retest rather than chasing this candle.
Confirmation matters more than hype.
DYOR, not financial advice.
post-image
STRK+20.93%
Load More

Join 40 M users in our growing community

⚡️ Join 40 M users in the crypto craze discussion

💬 Engage with your favorite top creators

👍 See what interests you

Trending Topics

GateAtTOKEN2049

37.79k Views21.15k Discussing

Gate brought a series of major events to TOKEN2049 Singapore! From the official launch of Gate Money to the F1 Red Bull driver meet-and-greet and the Gate Gala, we witnessed a new chapter of "One Gate, Borderless Finance." Which moment from TOKEN2049 stood out most to you?

GateWCTCS9GlobalTradingCompetition

32.72k Views3.5k Discussing

BTC Pulls Back to 81000

26.5k Views35.96k Discussing

View More