Square
Following
Hot
News
Profile
Share your thoughts
placeholder
Article
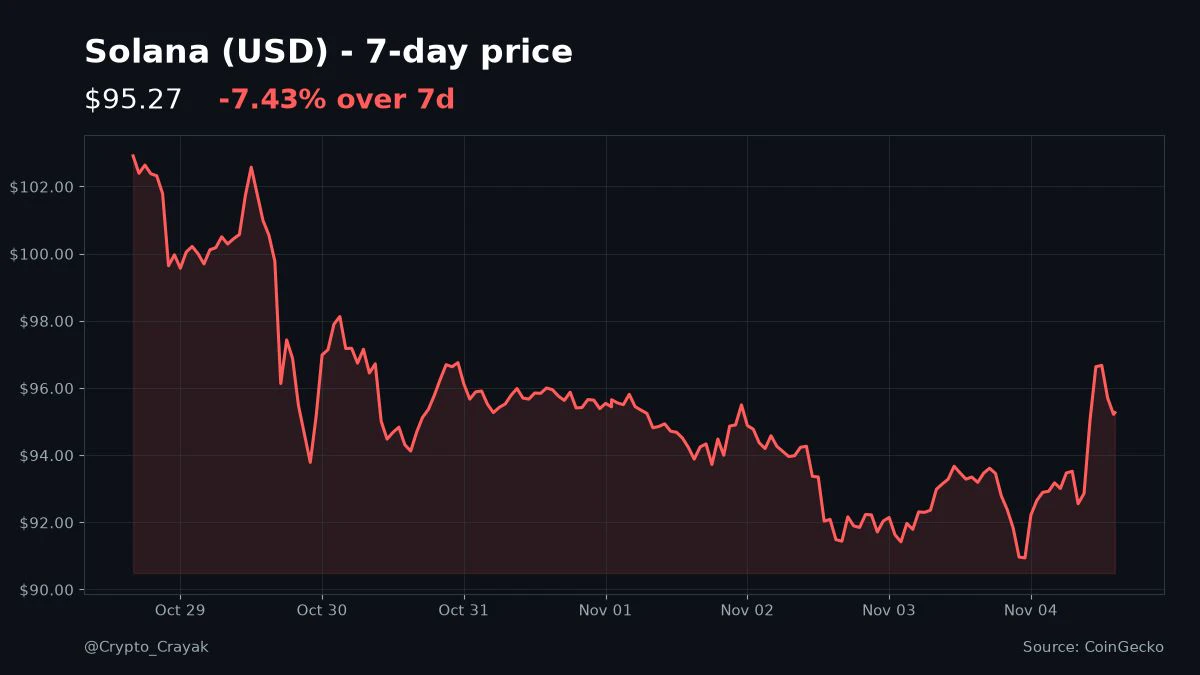
$SOL clawed its way back to around $95 this afternoon after a pretty ugly morning. Still down about 7% on the week though.
Breakpoint in London is less than two weeks out, so at least there's something to look forward to.
Bottom forming or just a breather? #Solana
post-image
SOL-0.77%
  • 1
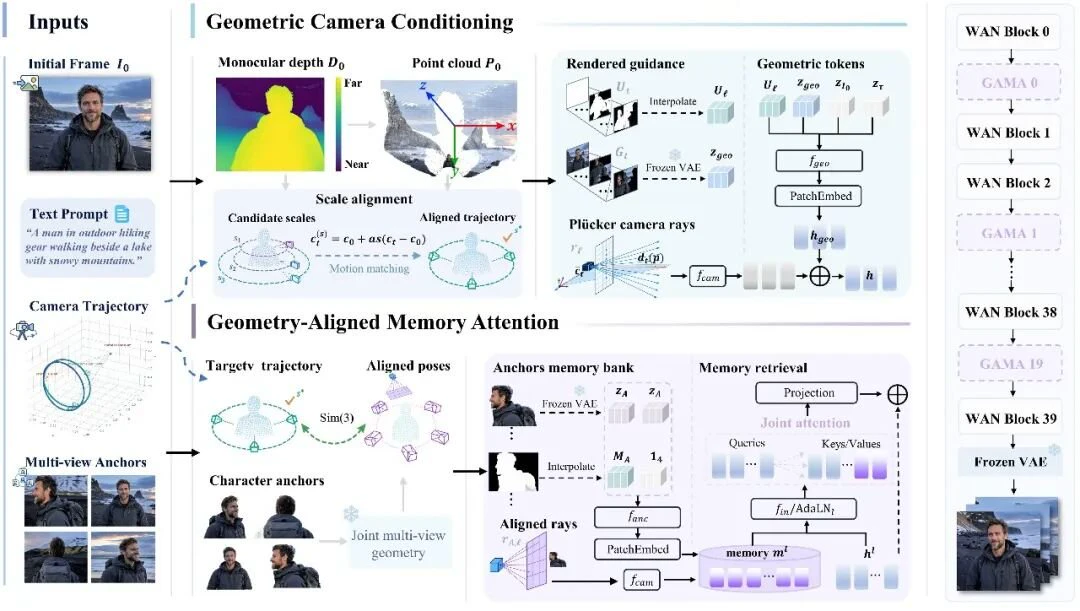
Xiaomi says WorldCast is another breakthrough in controllable visual generation. It not only adds a new feature to the REDMI K100 gallery, but also establishes methods, datasets, and evaluation approaches. The team will also explore more complex camera movements, longer continuous generation, and controllable 4D video generation.
The company has tied a gallery video feature to a paper, dataset, and evaluation methods. Users first see the video results, but the company emphasizes the underlying methodological advances.
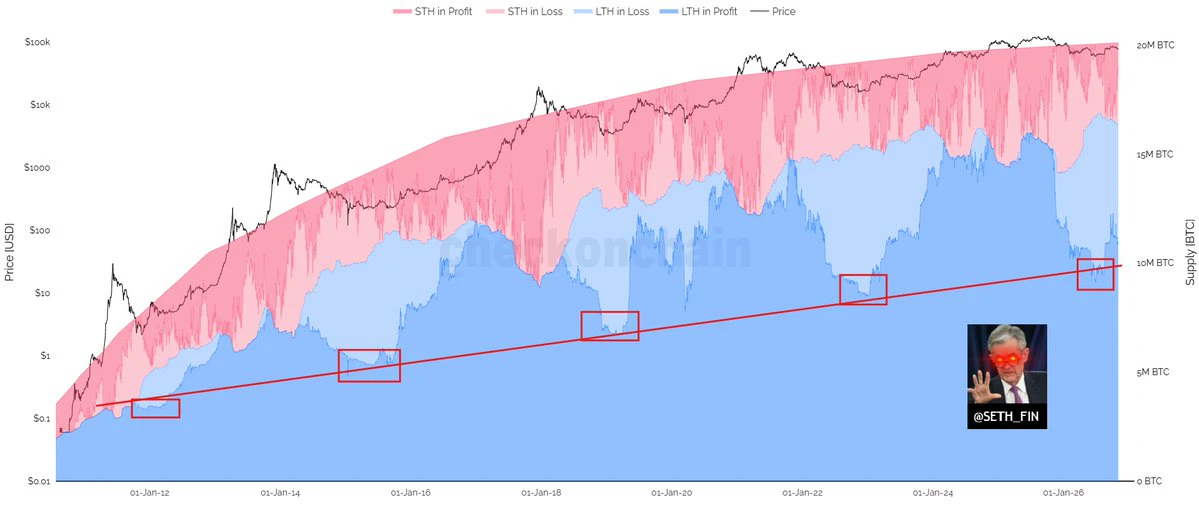
$BTC
post-image
BTC-0.67%
Trenches
ZIG
Z
bade
b
ZIG
0x8c...1145
Market Cap
$.
Change
.
24h Vol
$.
Holders
.
AMD
A
bade
b
AMD
DDmG...pump
Market Cap
$.
Change
.
24h Vol
$.
Holders
.
BTC
B
bade
b
BTC
C5xp...pump
Market Cap
$.
Change
.
24h Vol
$.
Holders
.
STONK
S
bade
b
STONK
6GmA...UNgx
Market Cap
$.
Change
.
24h Vol
$.
Holders
.
george
g
bade
b
george
Hbpj...pump
Market Cap
$.
Change
.
24h Vol
$.
Holders
.
ZEC staged a strong rebound from its low of 1158, but ran into resistance and stalled after climbing to 1352. This rise is a corrective rebound after being oversold, not a trend reversal, with clear overhead resistance.
Daily chart: The broader trend remains volatile and downward. This rebound has reached the overhead resistance zone, where the upper Bollinger Band is exerting notable pressure, and bullish indicator momentum has failed to follow through.
4-hour chart: Volume has failed to keep pace after the sharp rally, highs are gradually declining, and MACD continues to narrow. Bullish mome
post-image
ZEC+1.29%
Apple Intelligence on mainland China-market iPhones connects to Qwen, covering Siri, Writing Tools, and Visual Intelligence. Tests by IT Home show that query results and generated text are synced to the Qwen app for follow-up actions.
It’s called Apple Intelligence, but its outputs are automatically synced to the Qwen app. Users speak and write within Apple’s ecosystem, while their content ends up waiting in Alibaba’s ecosystem. What’s called interoperability looks more like handing users’ content off in a relay.
$BTC
BTC-0.67%
#USEarningsSeason
Sunday audit: Open your Pi app right now. How many days did you mine out of last 30? 30/30 = Legend. 20/30 = Serious. Below 10/30 = Tourist. What's your score? No cheating.
#PiNetwork
#ShareWeekly
#WCTCS9
#GateSquare
post-image
PI-0.60%
$SOL ‌ is showing a small but encouraging response after defending the $89.80 low.
Price has bounced toward $95.30, but the daily structure still needs work with the Supertrend sitting at $104.95. Bulls need to reclaim key resistance before this turns into a stronger recovery.
Key levels to watch:
Support: $92.00–$89.80
Resistance: $95.80–$98.20
Next hurdle: $103.50–$105.00
Holding above $89.80 keeps the recovery attempt alive. A clean move above $98.20 could open the way toward $103.50.
SOL has found some buying interest, but reclaiming resistance is where the real confirmation begins.
$AMD
SOL-0.77%
AMD-0.22%
  • 3
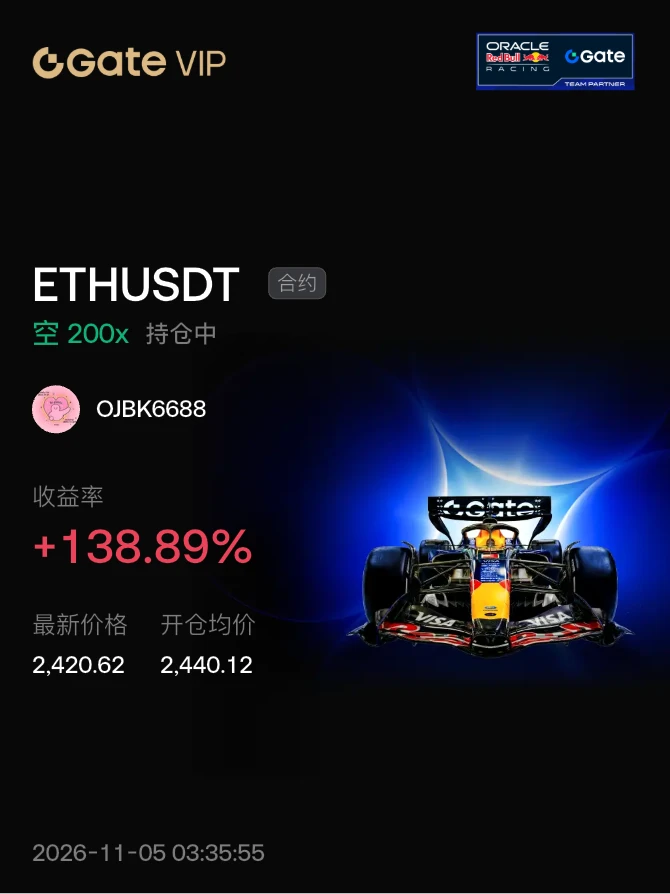
#晒出我的持仓收益 ETH trend swing trading. My livestream just started tonight, and I’ve placed my first trade. Live now—search Sister O Capital
post-image
IF YOU DON'T KNOW WHICH ALTS WALL STREET INVEST IN...
THEN BUY BITCOIN AND STICK WITH THE KING.
BUY WHEN THERE IS BLOOD IN THE STREET.
post-image
BTC-0.67%
$MU ‌
#Gate股票畅聊季 #GateStockTalkSeason
Why is Micron right at the heart of the artificial intelligence cycle?
The memory and microprocessor sector is undergoing a structural transformation driven by investments in AI infrastructure. Micron is one of the companies positioned at the center of this shift. Both its financial statements and its stock price action tell two distinct stories simultaneously.
There is a powerful wave of demand, yet it appears the market has already "priced in" this wave—only to now begin questioning it. In short: the fundamentals are strong, while the market valuation
MU-6.90%
  • 17
  • 3
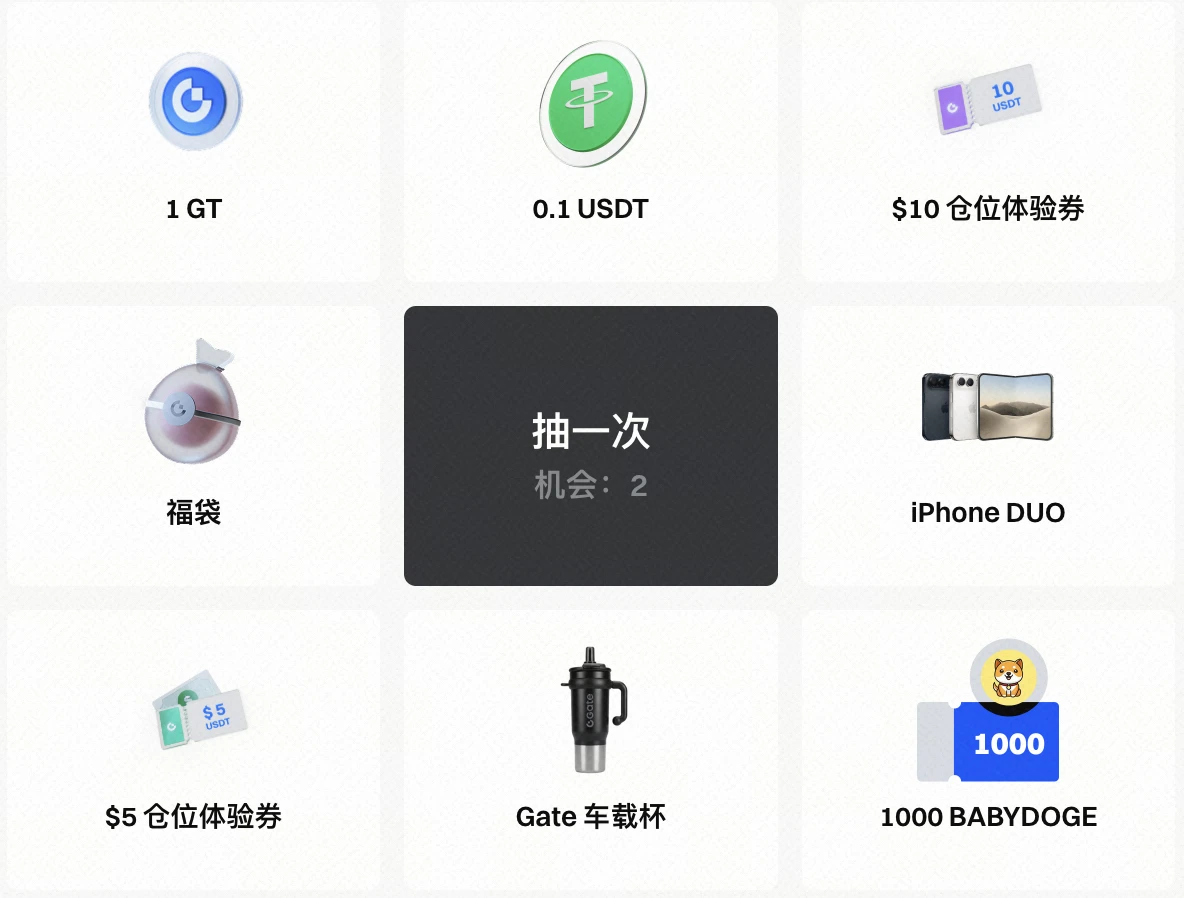
🎁 How many raffle chances do you have left?
Join the raffle festival on Gate Live and complete tasks such as checking in, watching live streams, commenting, and sharing to earn Heat Points!
For every 80 Heat Points you earn, you’ll get one raffle chance!
Amazing prizes await, including an iPhone DUO, GT, USDT, futures trial vouchers, and exclusive Gate merchandise.
The event ends on November 11. Join now and don’t miss a chance to win!
👉 Join now:https://www.gate.com/activities/watch-to-earn/?now_period=27&refUid=16810598
CryptoChampion
🎁 How many raffle chances do you have left?
Join the Gate Live livestream raffle carnival and complete tasks such as checking in, watching livestreams, commenting, and sharing to accumulate Heat Points!
For every 80 Heat Points you accumulate, you’ll get 1 raffle chance!
Great prizes await, including iPhone DUO, GT, USDT, contract trial vouchers, and beautiful Gate merchandise.
The event ends on November 11. Join now and don’t miss a single raffle chance!
👉 Join now: https://www.gate.com/activities/watch-to-earn?now_period=27
repost-content-media
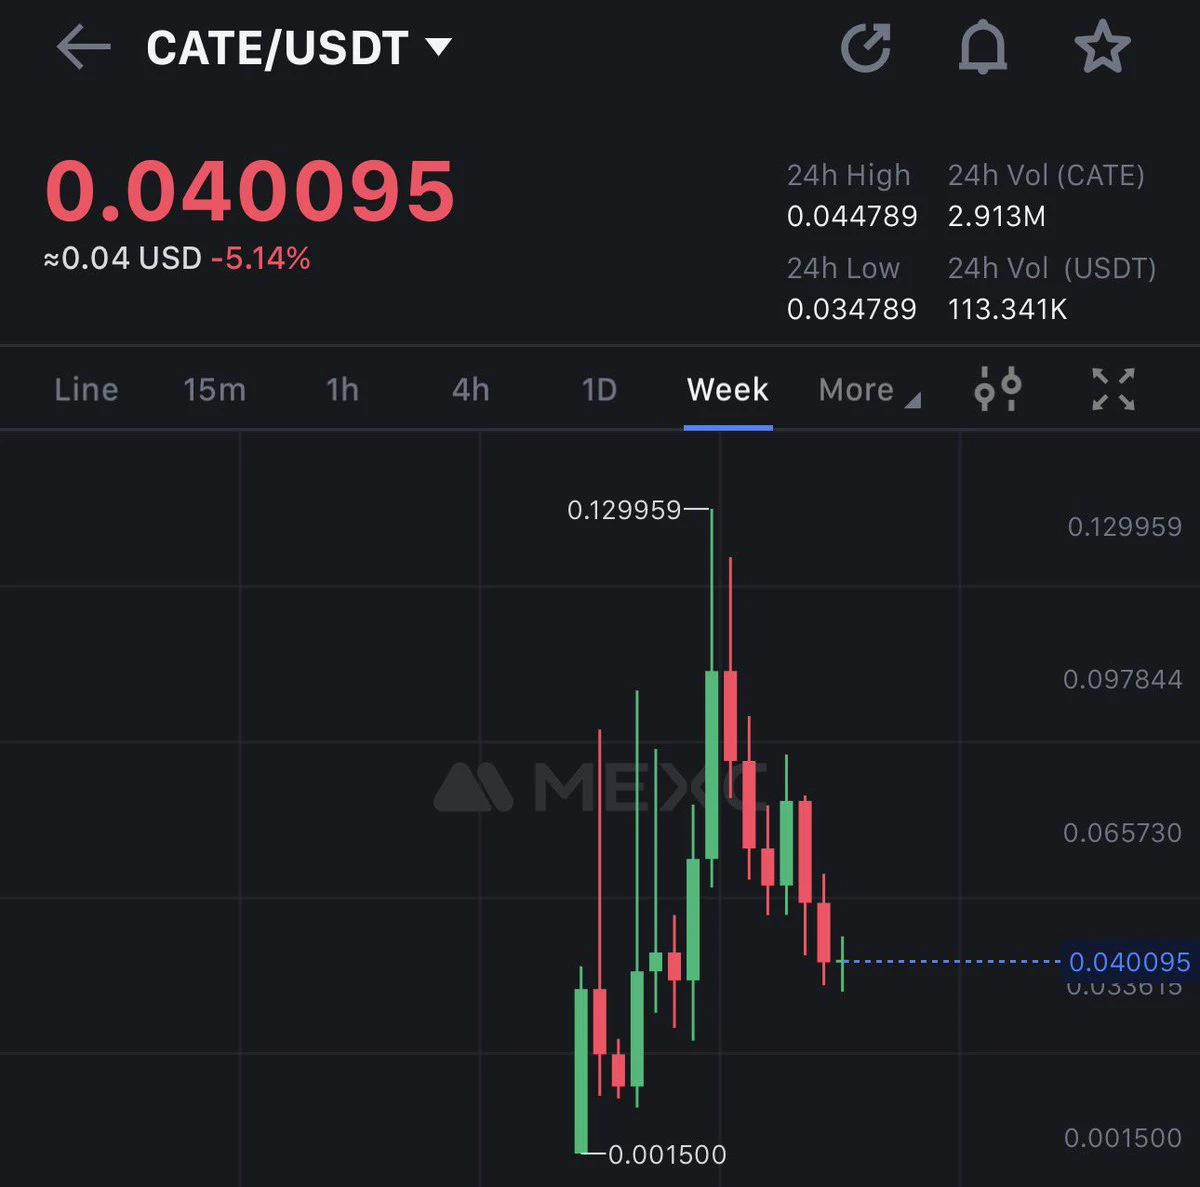
$CATE has a great community.
Buy on dips.
ATH soon.
post-image
CATE-0.73%
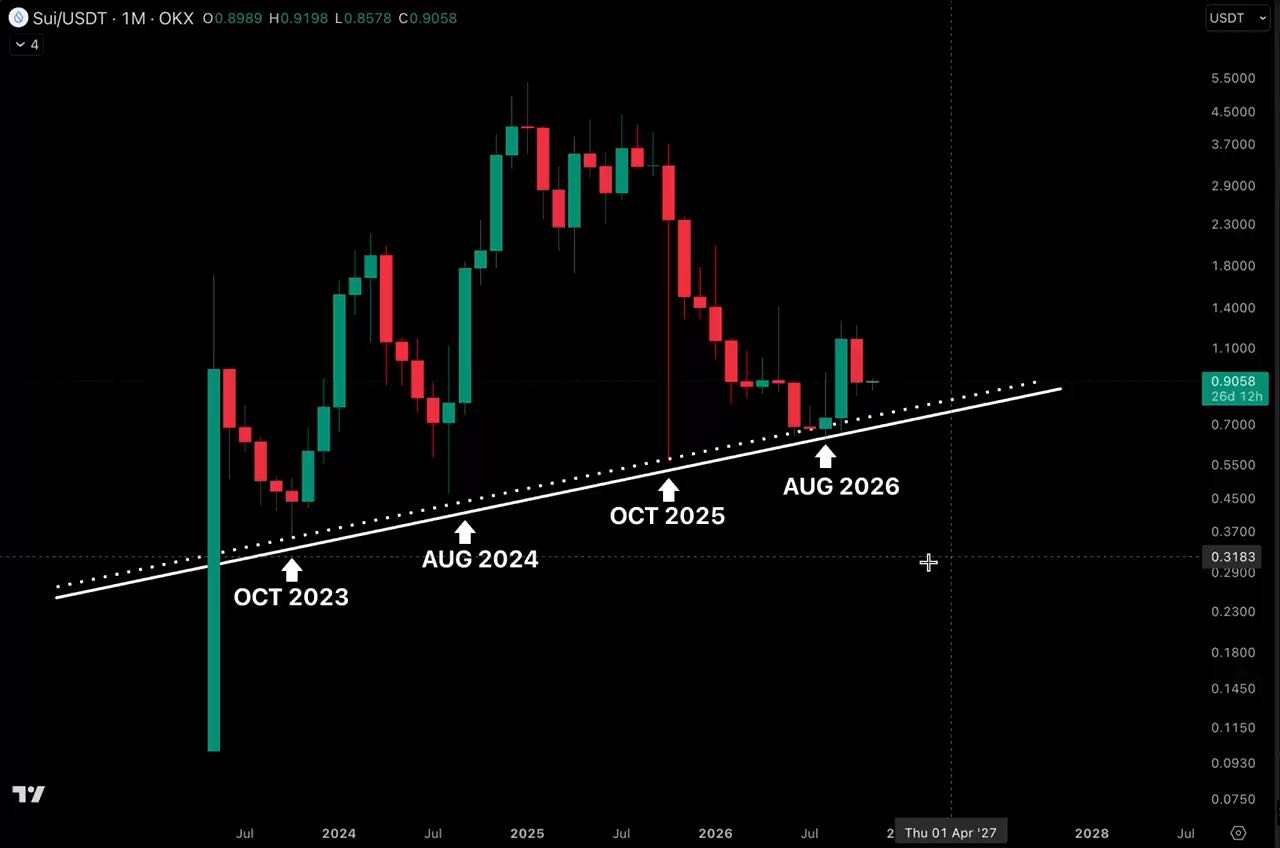
$SUI keeps coming back to the same trendline like it has unfinished business
October 2023 → August 2024 → October 2025 → August 2026
Four major tests of the same long-term support
Meanwhile, everyone is busy writing SUI’s obituary every time it dips
If this trendline holds again, some people might have to delete their bearish tweets
SUI-1.05%
$PONS ‌ is finally showing a stronger reaction from the lower range, with buyers stepping in after the recent decline.
Price is up around 10% near $0.2249, but the bigger picture still needs improvement. The daily Supertrend remains bearish at $0.3092, so this move needs follow-through before calling it a trend reversal.
Levels worth watching:
Support: $0.20–$0.187
Immediate resistance: $0.232
Next resistance: $0.25–$0.27
Major trend reclaim: $0.309
A breakout above $0.232 could give the recovery more room, while losing $0.187 would weaken the setup.
Buyers have made a decent start. Now the
PONS+4.32%
MU-6.90%
  • 3
  • 1
Nvidia Reclaims a $5 Trillion Valuation! AMD Surges Nearly 8 After Hours as AI Chip Stocks Stage a C
live-cover
LIVE4,634
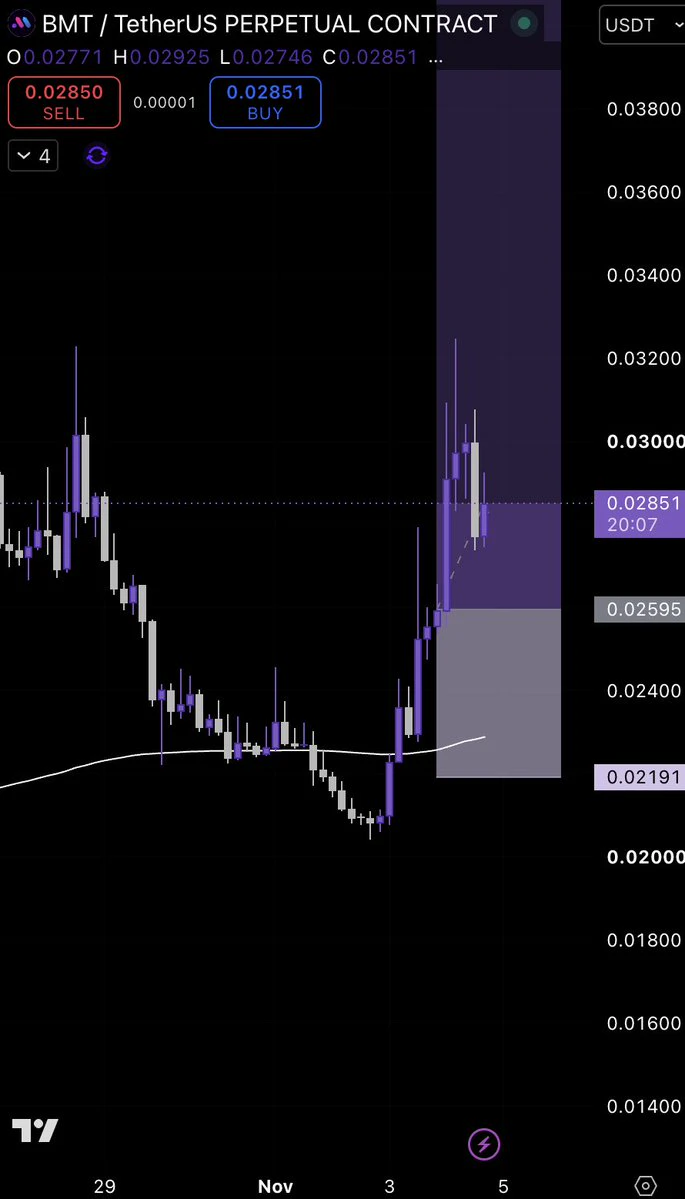
$BMT — still ongoing in VIP. 👀
Strong bounce from the $0.0219 support zone, followed by a clean push toward $0.030.
Now holding above $0.0259 after the first pullback.
As long as support holds, the setup remains valid. Watching for continuation toward the recent highs. 🚀
post-image
BMT+5.93%
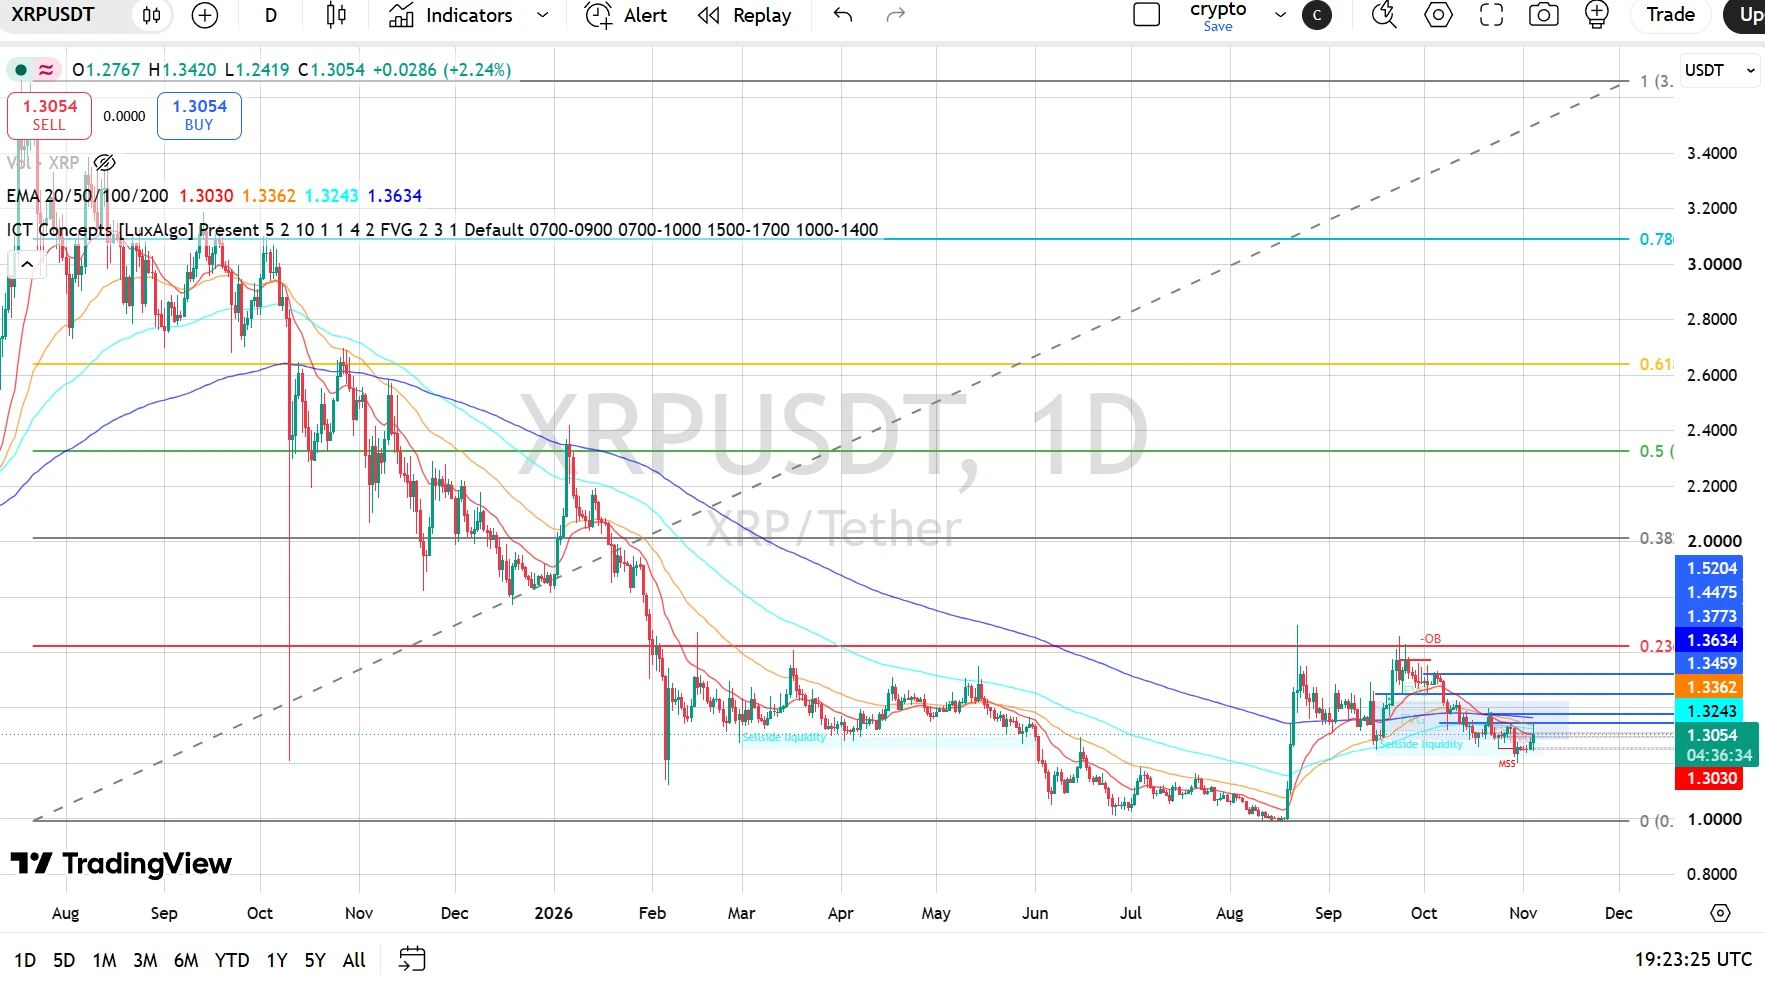
XRP Technical Outlook: XRP Consolidates Near $1.30 as Bulls Attempt to Defend Support
XRP is currently trading around $1.3049–$1.3051, consolidating after its recovery from the $1.00 region. The recent rally pushed price toward the $1.37 area, but XRP faced rejection and has since moved into a corrective phase.
The broader recovery has lost some momentum, with price trading below the 50, 100, and 200 EMAs. However, XRP is holding near the 20 EMA and attempting to stabilize around $1.30.
The immediate focus is whether buyers can defend the $1.30 area and reclaim the $1.3243–$1.3362 resistance z
post-image
asiftahsin
XRP Technical Outlook: XRP Consolidates Near $1.30 as Bulls Attempt to Defend Support
XRP is currently trading around $1.3049–$1.3051, consolidating after its recovery from the $1.00 region. The recent rally pushed price toward the $1.37 area, but XRP faced rejection and has since moved into a corrective phase.
The broader recovery has lost some momentum, with price trading below the 50, 100, and 200 EMAs. However, XRP is holding near the 20 EMA and attempting to stabilize around $1.30.
The immediate focus is whether buyers can defend the $1.30 area and reclaim the $1.3243–$1.3362 resistance zone. A sustained move above this zone would improve the recovery outlook, while a breakdown below support could expose XRP to further downside.
EMA Structure
* 20 EMA: $1.3030
* 50 EMA: $1.3362
* 100 EMA: $1.3243
* 200 EMA: $1.3634
XRP is trading slightly above the 20 EMA but remains below the 50, 100, and 200 EMAs. This indicates that short-term price action is attempting to stabilize, while the broader trend still faces significant overhead resistance.
The $1.3243–$1.3362 region is the first important resistance zone. Reclaiming the 50 EMA at $1.3362 would strengthen the short-term recovery, while the 200 EMA near $1.3634 remains a major barrier.
Fibonacci Levels
Based on the visible chart levels:
* 0.236: Around $1.3459
* 0.382: Around $2.00
* 0.5: Around $2.32
* 0.618: Around $2.64
* 0.786: Around $3.08
XRP is trading below the visible 0.236 Fibonacci resistance area. A sustained recovery above $1.3459 would be an early sign of improving momentum. The higher Fibonacci levels represent broader recovery objectives rather than immediate targets.
Bullish Scenario
If XRP holds the $1.30 support area and buyers manage to reclaim the nearby EMA resistance zone, the price could attempt a recovery toward:
* $1.3243
* $1.3362
* $1.3459
* $1.3634
* $1.3773
* $1.4475
* $1.5204
A decisive move above $1.3459 would improve the bullish outlook. Reclaiming $1.3634–$1.3773 could open the way toward the $1.4475 resistance area.
Pullback Scenario
If XRP fails to hold above $1.30 and selling pressure increases, the following support areas deserve attention:
* $1.3030 — 20 EMA
* $1.30 — Immediate psychological support
* $1.27–$1.25 — Potential lower support area
* $1.00 — Major historical support region
A sustained breakdown below $1.30 would weaken the current consolidation structure and increase the possibility of a deeper correction. The $1.00 region remains an important broader support reference on the chart.
RSI Momentum
* RSI: 47.82
* RSI Signal Average: 40.26
RSI is below the neutral 50 level, showing that bullish momentum remains limited. However, the RSI is above its signal average, suggesting a modest improvement in short-term momentum.
A move above 50–55 would provide stronger confirmation of a recovery attempt. If RSI turns lower and falls below 40, downside pressure could increase.
Market Structure & Liquidity
XRP has experienced a prolonged decline from its previous highs before finding support around the $1.00 region. The subsequent recovery pushed price toward the $1.37 area, but buyers have struggled to maintain that upward momentum.
The latest price action shows lower highs and consolidation around $1.30–$1.34. The market is currently testing whether the $1.30 region can hold as support.
The broader structure remains under pressure while XRP trades below the 50, 100, and 200 EMAs. A confirmed reclaim of the $1.3459–$1.3773 zone would be needed to establish a stronger bullish recovery.
Key Levels
Resistance
* $1.3243
* $1.3362
* $1.3459
* $1.3634
* $1.3773
* $1.4475
* $1.5204
Support
* $1.3030
* $1.30
* $1.27–$1.25
* $1.00
Final Outlook
XRP remains neutral-to-bearish while trading below the $1.3362–$1.3634 resistance zone. The price is attempting to stabilize around $1.30, but the broader recovery still needs confirmation.
A sustained breakout above $1.3459 could open the path toward $1.3773, followed by $1.4475. On the downside, losing $1.30 would increase the risk of a deeper correction.
Bias: Neutral-to-bearish below $1.3459 | Breakout above $1.3773 could strengthen recovery toward $1.4475–$1.5204.
Analysis based on the provided XRP/USDT 1D chart dated November 4, 2026. These levels represent technical scenarios, not guaranteed outcomes.
$XRP ‌
repost-content-media
XRP-1.12%
  • 6
  • 1
🔹Markets Sell Off Ahead of Election Results! BTC Falls Below $77,000 and ZEC Drops Nearly 10. Are I
live-cover
LIVE29
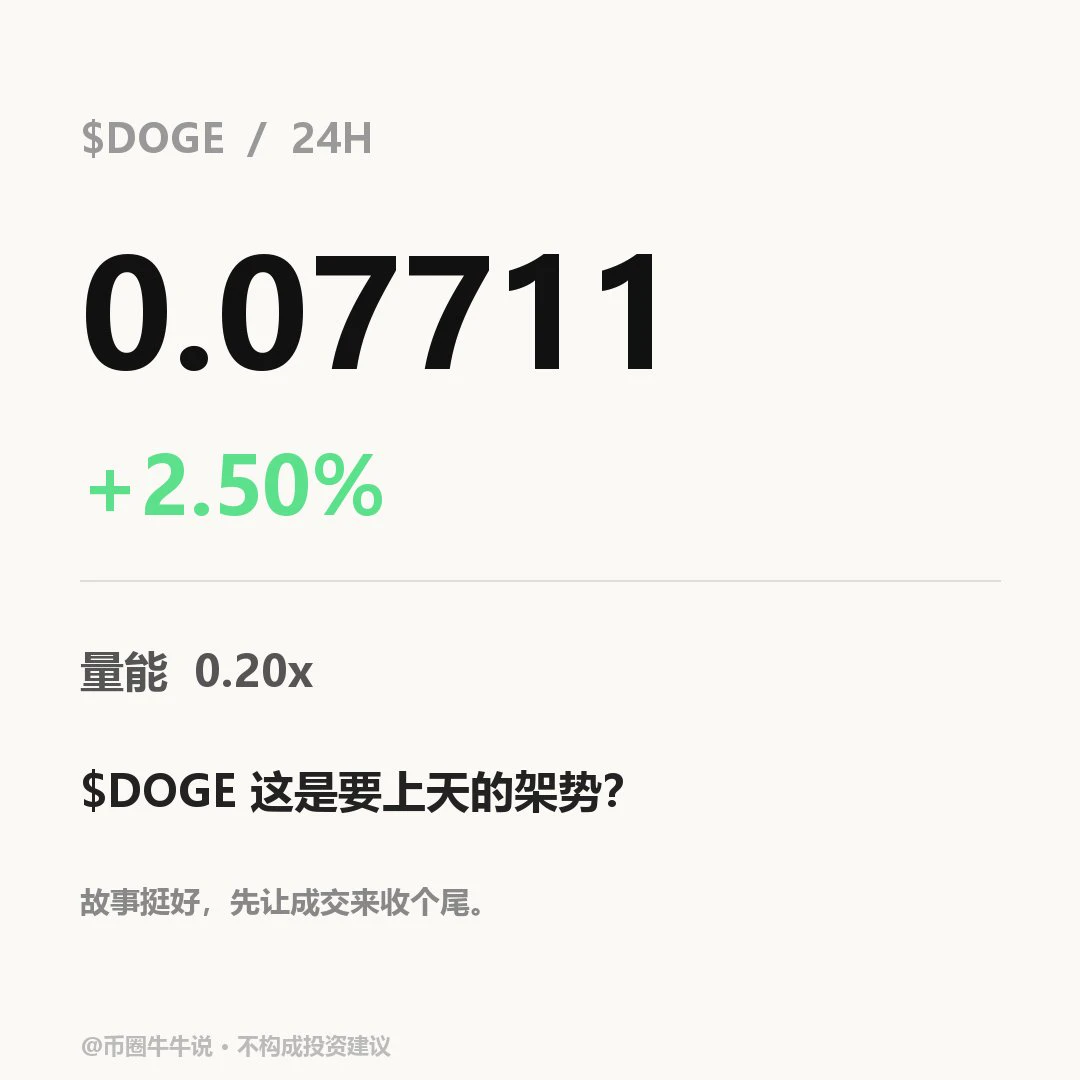
$DOGE Currently at 0.07711, up 2.50% over 24H (0.0723–0.07837). The 1H trend is strong, with RSI at 73.63 and EMA20 at 0.07571; the 4H trend is strong, with RSI at 58.25 and EMA20 at 0.07544. The 1H volume ratio is 0.20. Both the 1H and 4H trends are strong, but the 1H is overbought and volume is insufficient. If the price holds above the 0.07837 resistance, watch for continued momentum; if it falls below the 0.0723 support, the short-term trend may weaken. In the next review, check whether the price can hold above 0.07837 and whether it can recover after losing 0.0723. With the volume ratio a
post-image
DOGE-0.22%
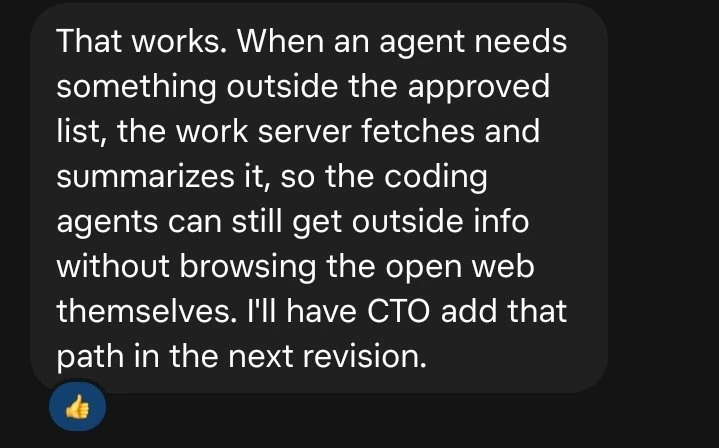
I setup Grokbot @Bot to build a work server for - cloud agents Claude, Codex & Anti Gravity to reach the internet by request, & only allow locally their own services to go through a firewall, all other ports and websites are blocked. So that my agents can't be poisoned by hidden AI prompts found online on forums, Reddit, websites etc. Yet they can still search online as not to limit the model through the VM work server. I suggest if you are using Grokbot with any other cloud model connected that you do the same structure. Although it costs me over $600 a year in just server fees. It's worth i
post-image
Load More

Join 40 M users in our growing community

⚡️ Join 40 M users in the crypto craze discussion

💬 Engage with your favorite top creators

👍 See what interests you

Trending Topics

GateLaunchesTaiwanStockTrading

10.7k Views227 Discussing

Gate has launched Taiwan stock trading with 19 stocks available for direct $USDT trading, including TSMC (2330) and MediaTek (2454). From U.S. and Hong Kong stocks to Japan, Korea and now Taiwan, Gate is connecting users with more global traditional assets. Which Taiwan stock would you most want to access with $USDT — TSMC, MediaTek, or another AI supply-chain name?

DemocratsWinBothChambers

9.87k Views362 Discussing

ChipStocksRebound

13.42k Views3.02k Discussing

View More