Square
Following
Hot
News
Profile

polaris_xbt

vip
Active for: 2y
Peak Tier 0
No content yet
0
Following
77
Followers
315
Liked
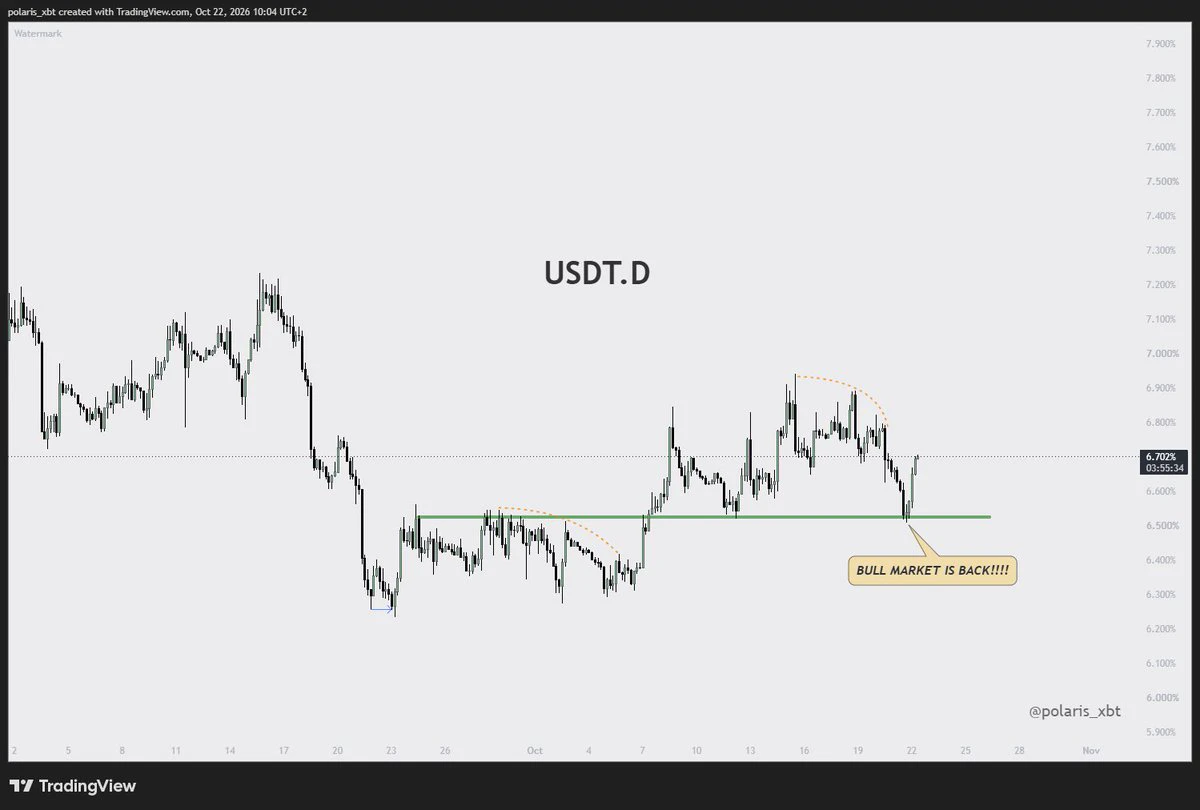
USDT Dominance
So... this chart looks incredibly bullish to me.
Tell me if you see otherwise... for I might be blind.
post-image
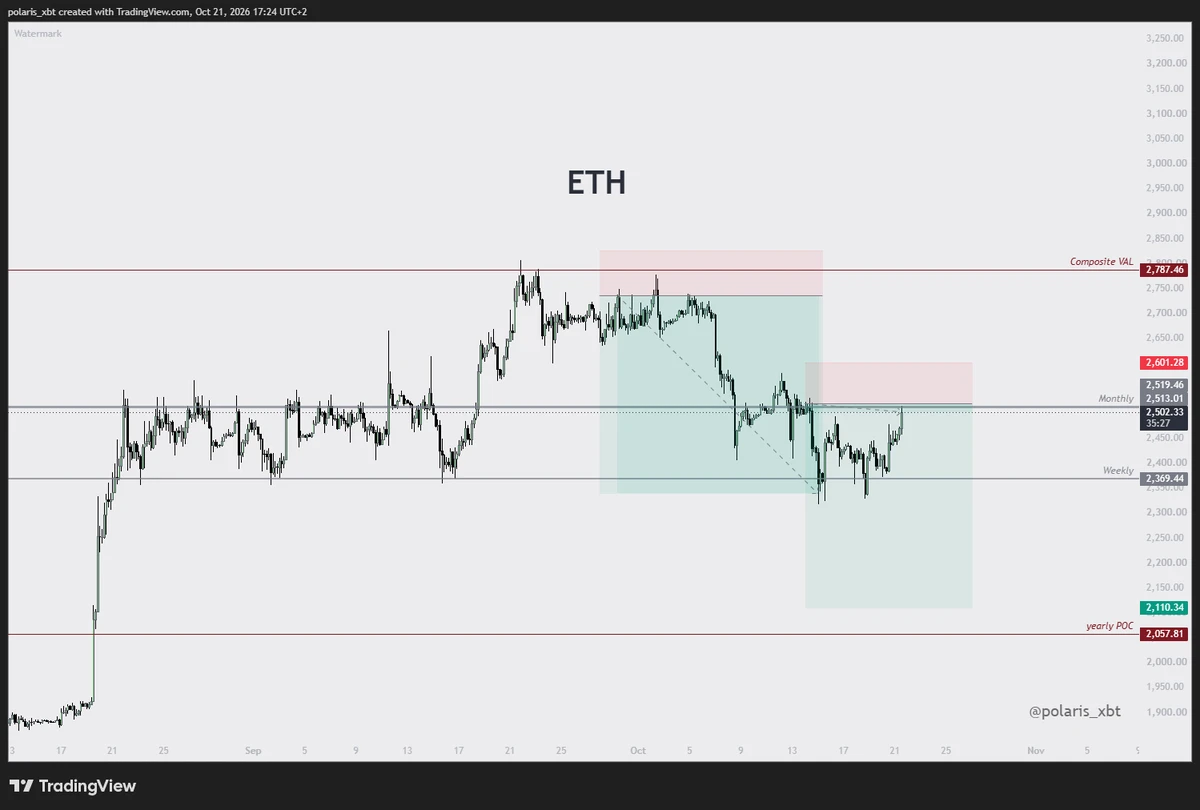
$ETH
Currently in one short, which is back at entry.
We are in a tight local range 2350 - 2500 which means we are at the range high so if I wasn't already in a short I would consider opening one here.
post-image
ETH-2.44%
  • 2
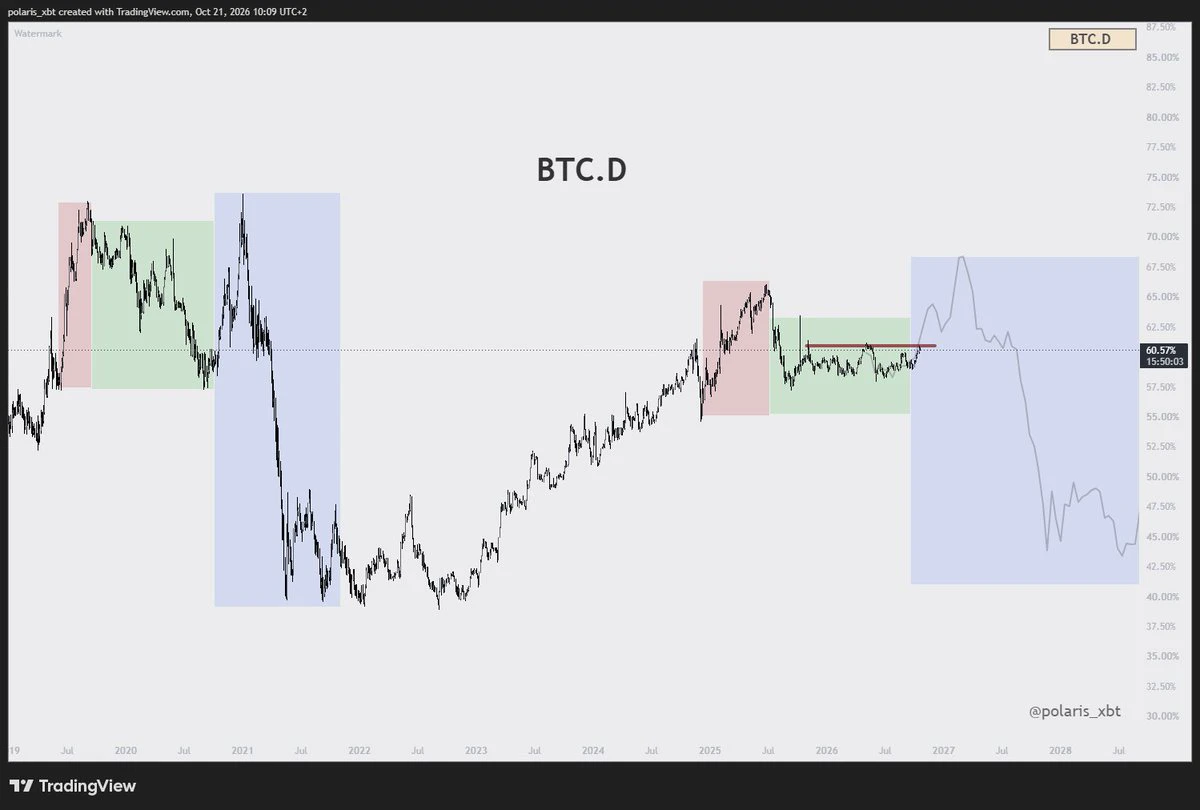
$BTC Dominance at the range high
Last 3 times we touched this line we got a few weeks of altcoin outperformance.
Why not bet on it again :)
post-image
BTC-1.92%
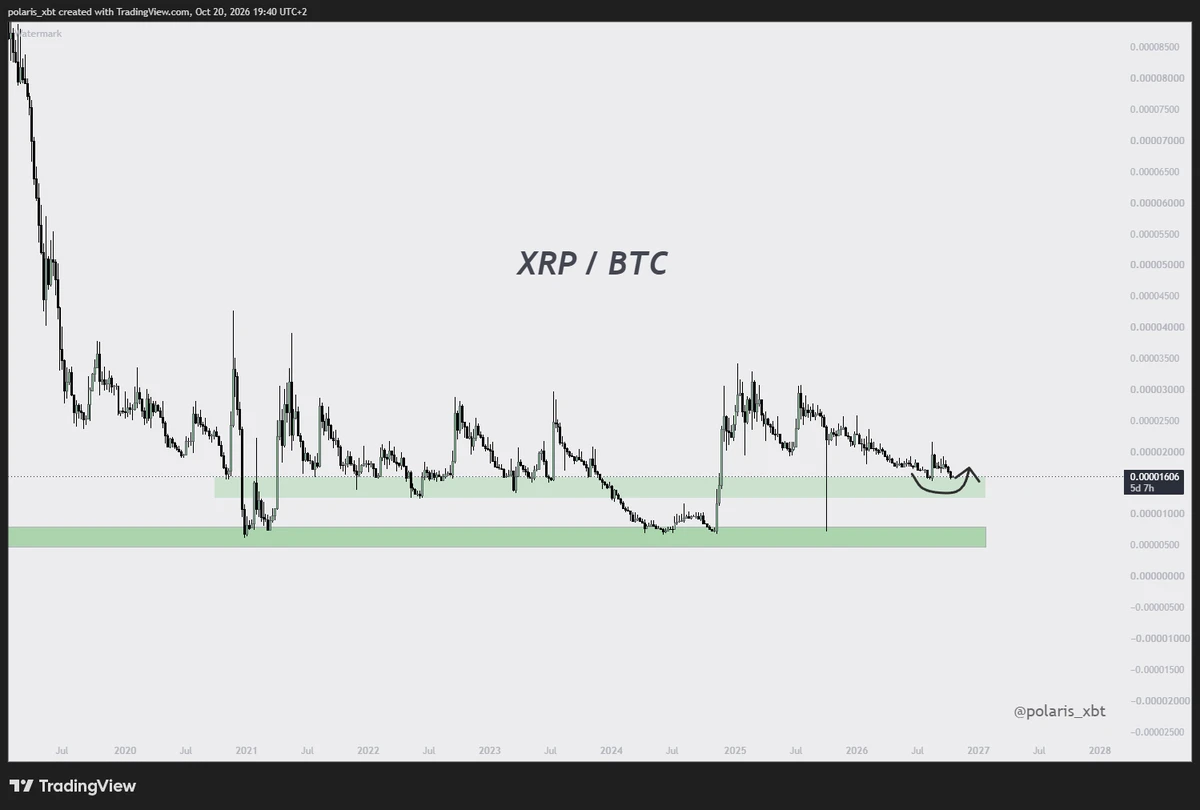
$XRP
Double tap on BIG support on btc pair.
If BTC doesn't nuke here we can see really nice pump on XRP as well.
post-image
XRP-2.42%
BTC-1.92%
$ETH
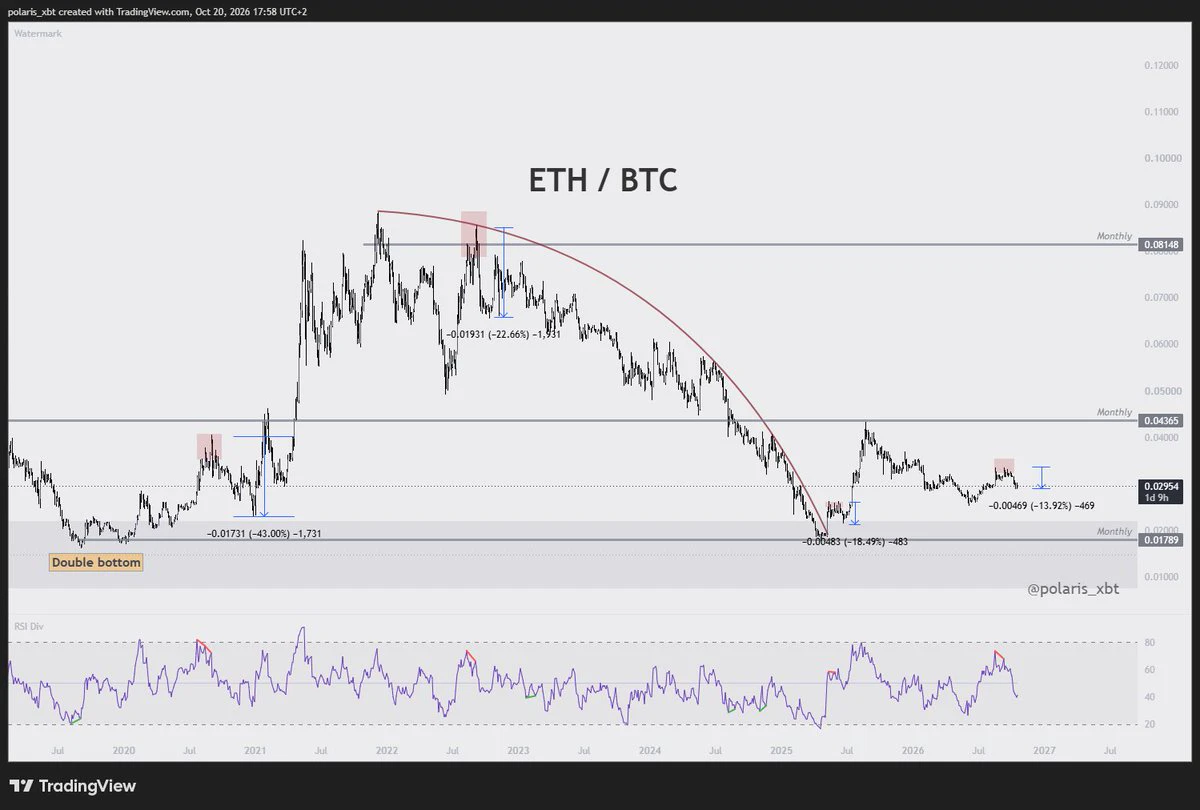
ETHBTC is down 11% against BTC since the 3-day bear div formed.
▫️ Previous 3-day bear divs gave us 20-40% retracements
▫️ We’re about a quarter to half of the way there
▫️ This could be the last good buying opportunity of this cycle
post-image
ETH-2.40%
BTC-1.92%
$BTC thoughts
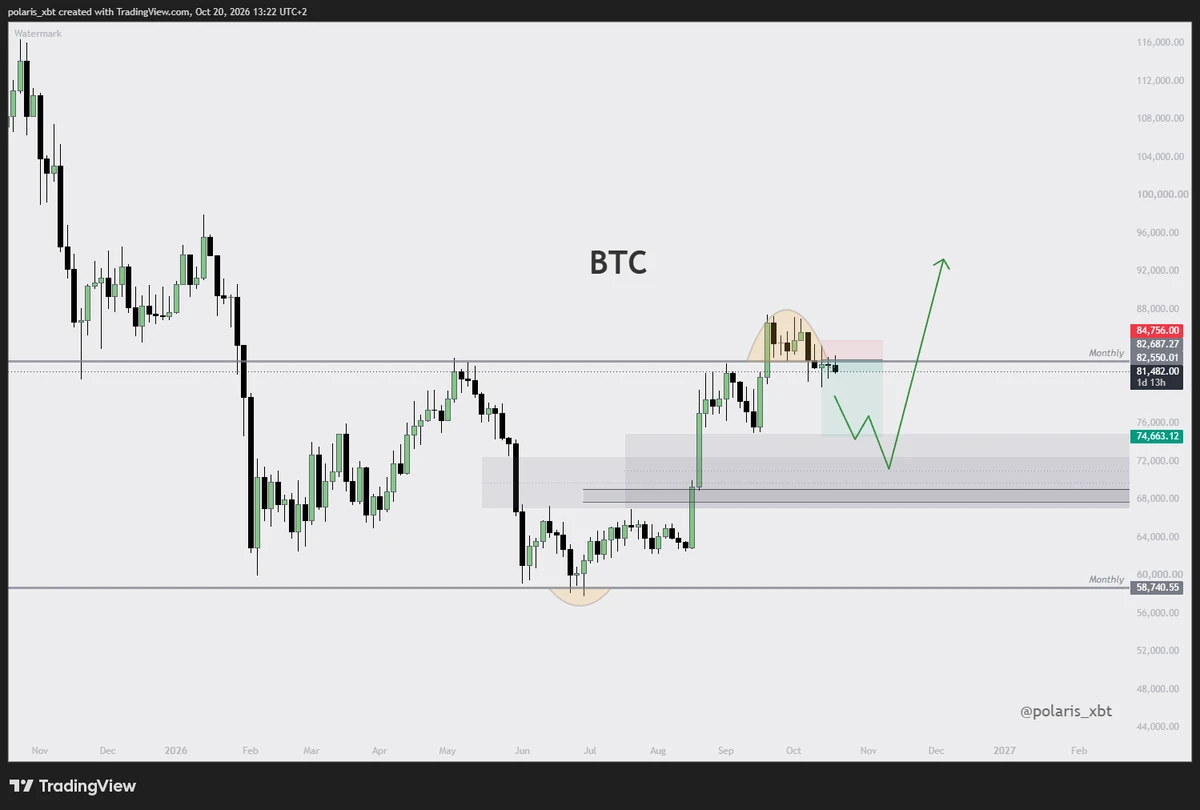
As long as we are below 82.5 there is no reason to close swing shorts.
Area where I would activate my spot buying is sub 75k.
This would likely give us 2k eth again and much much cheaper alts
post-image
BTC-1.92%
ETH-2.40%
$INJ
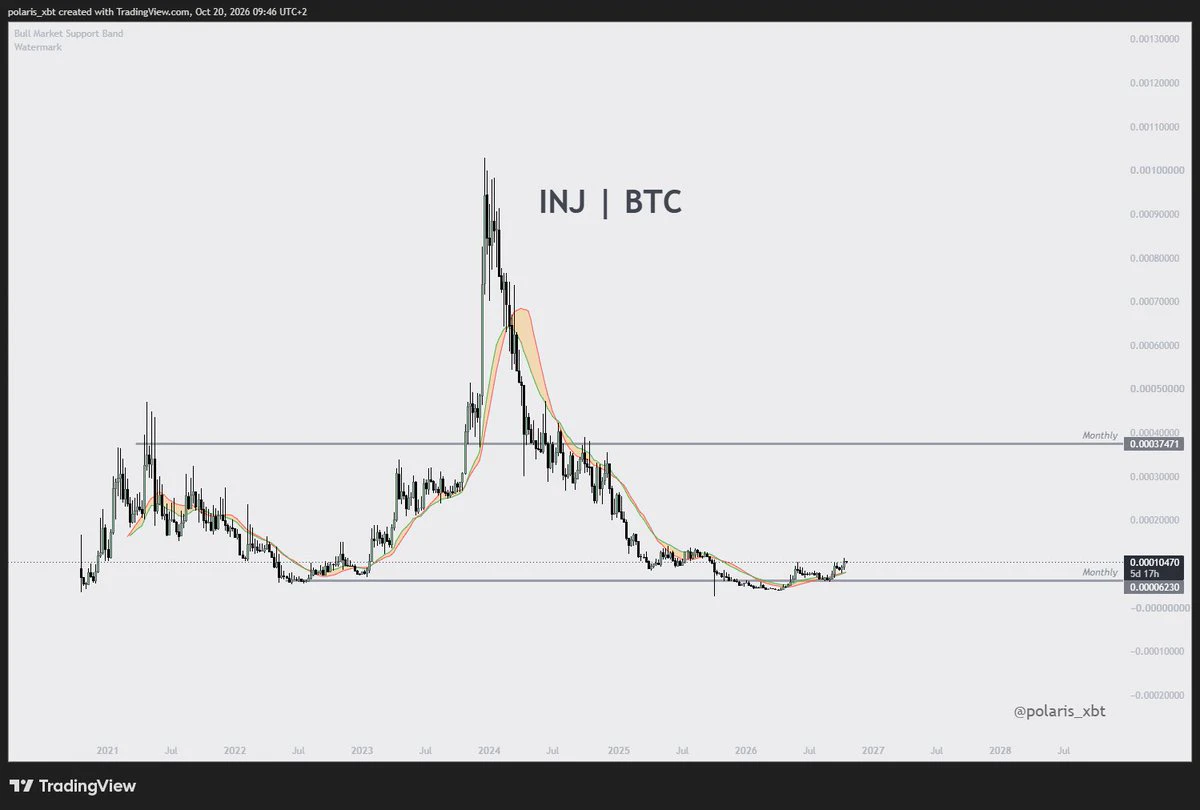
Continues to look amazing on BTC pair.
IMHO the bottom has formed and any pullbacks are good for buying.
Prefer this over ZCASH or HYPE anytime
post-image
INJ-7.67%
BTC-1.92%
ZEC-2.45%
HYPE-3.97%
  • 1
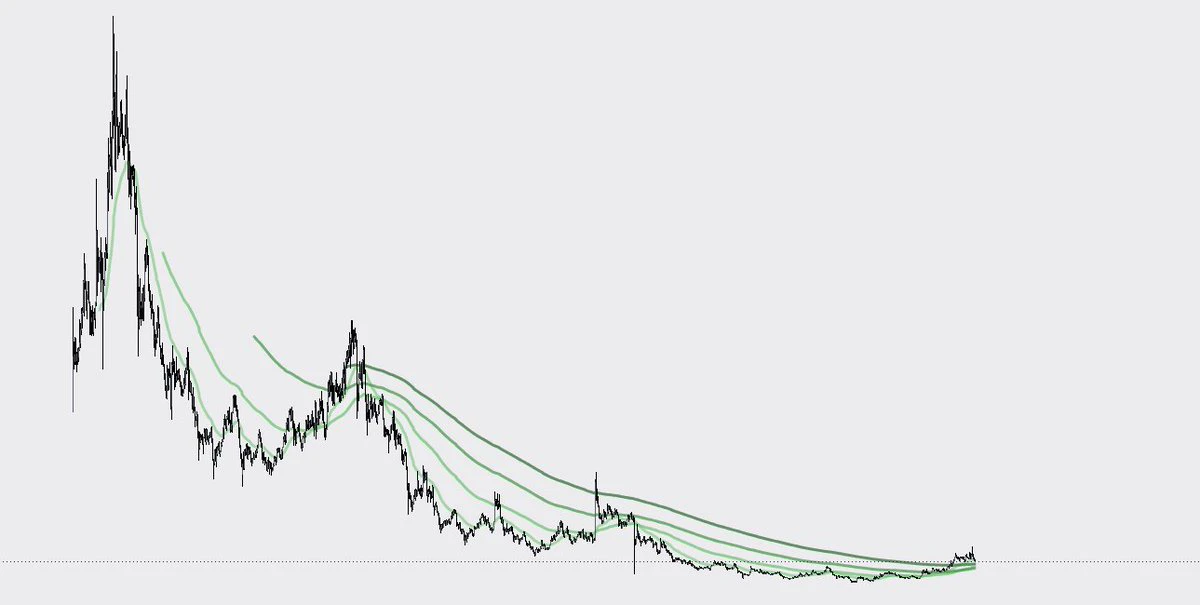
Some altcoin charts look absolutely PRIMED.
▫️ Long, boring bottoming phase
▫️ HTF EMAs flipped
▫️ This is a buy and ride
Most people are blind, focused on $HYPE , $ZCASH, and whatever is trending this week.
The 10x isn’t there.
The 10x is where nobody is looking...
post-image
HYPE-3.97%
ZEC-2.45%
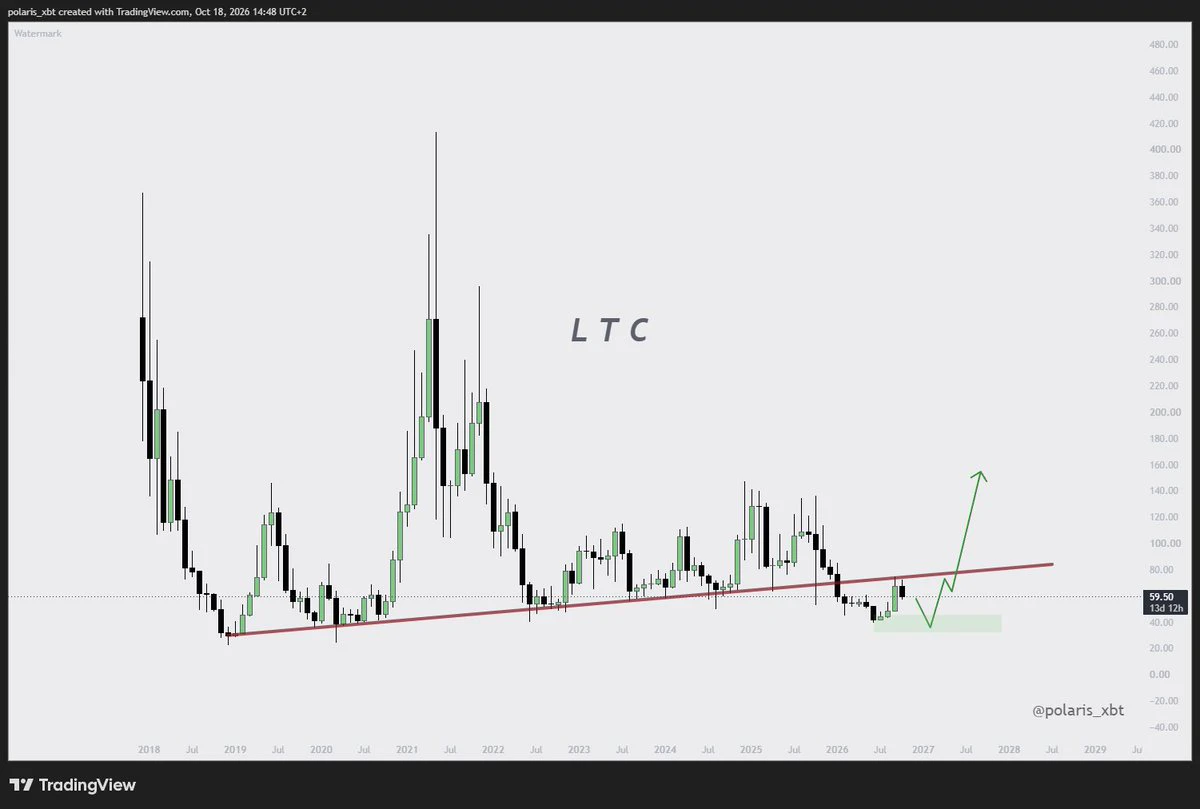
$LTC
Single line is enough for this chart.
I will be interested if we hit the lows again for potential double bottom... otherwise I will skip this
post-image
LTC-3.63%
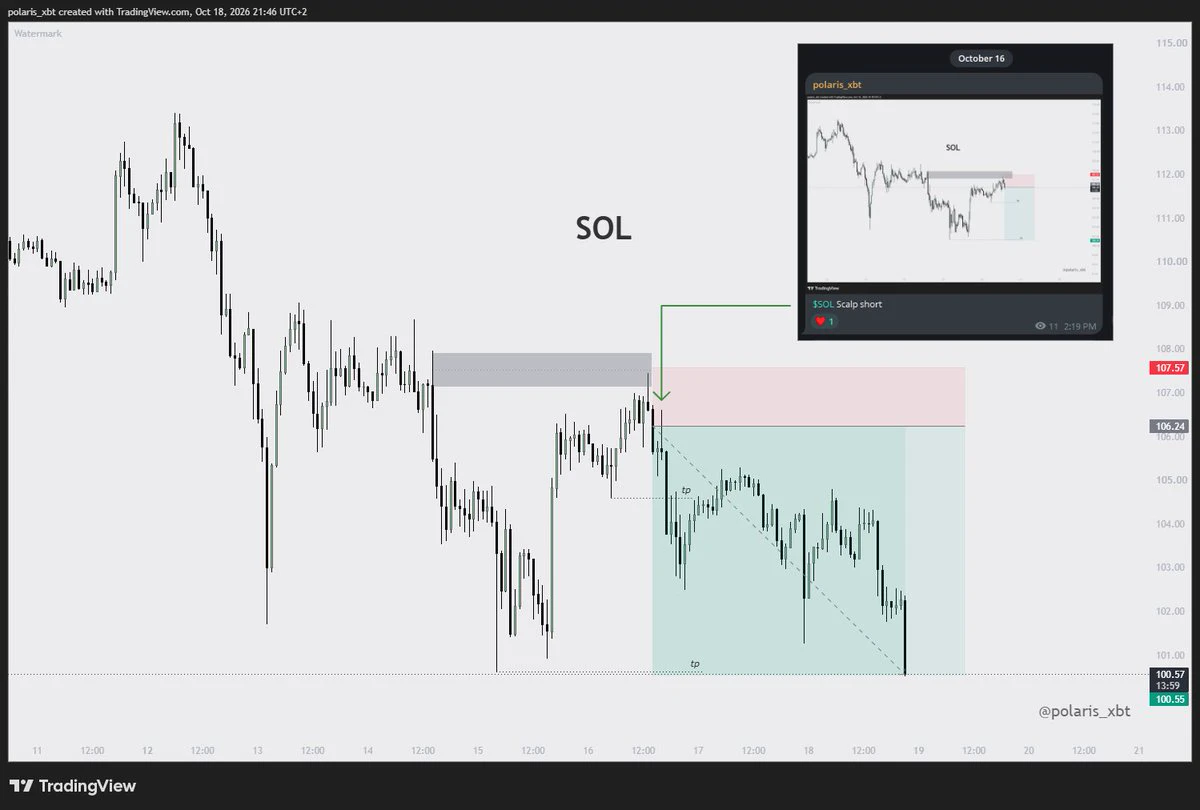
$SOL
Juicy short when everyone was screaming for the next leg up :)
One has to learn how to distinguish true strength from pure hype... and I've spent past 4 years doing just that.
post-image
SOL-2.77%
  • 1
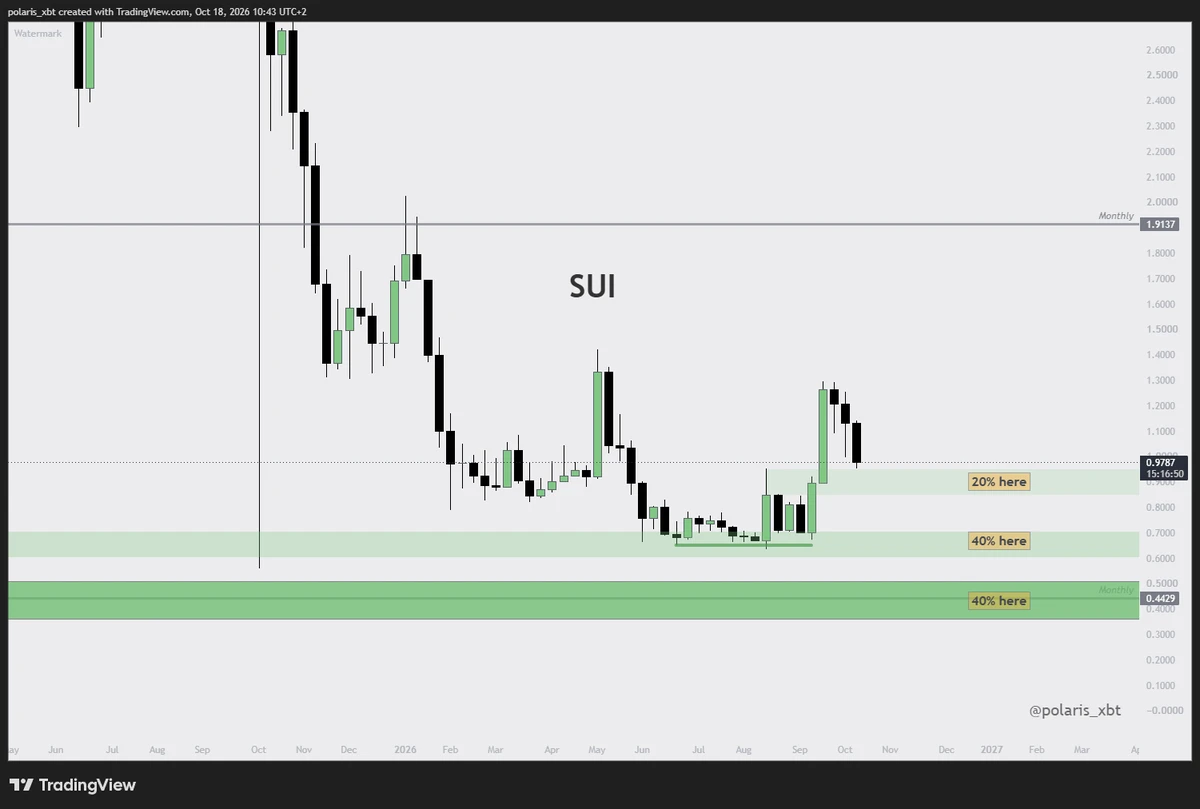
$SUI
Spot accumulation zones.
Hold time 1+ year from now.
Targets $2, $4 and $10
post-image
SUI-4.89%
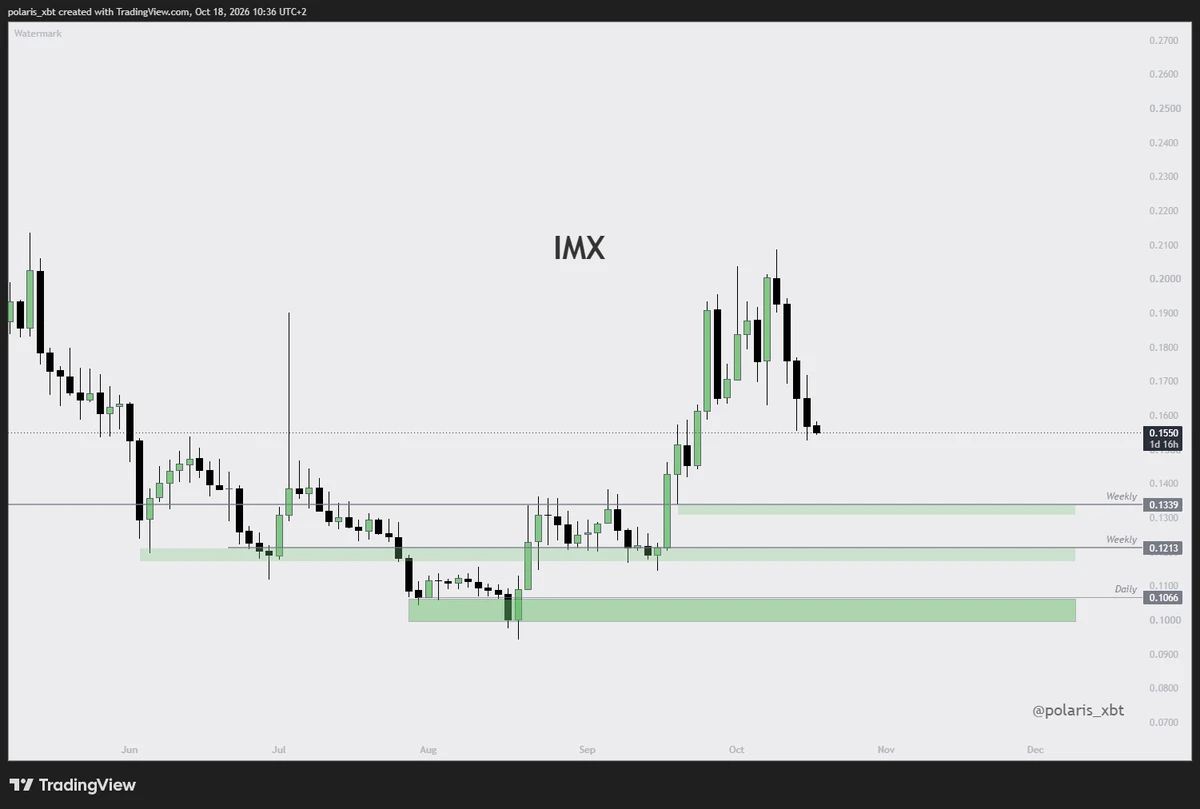
$IMX
Big buy zones marked on the chart.
I have stacked limit bids in each of the green zones, and looking to hold this for 1+ year.
post-image
IMX-4.33%
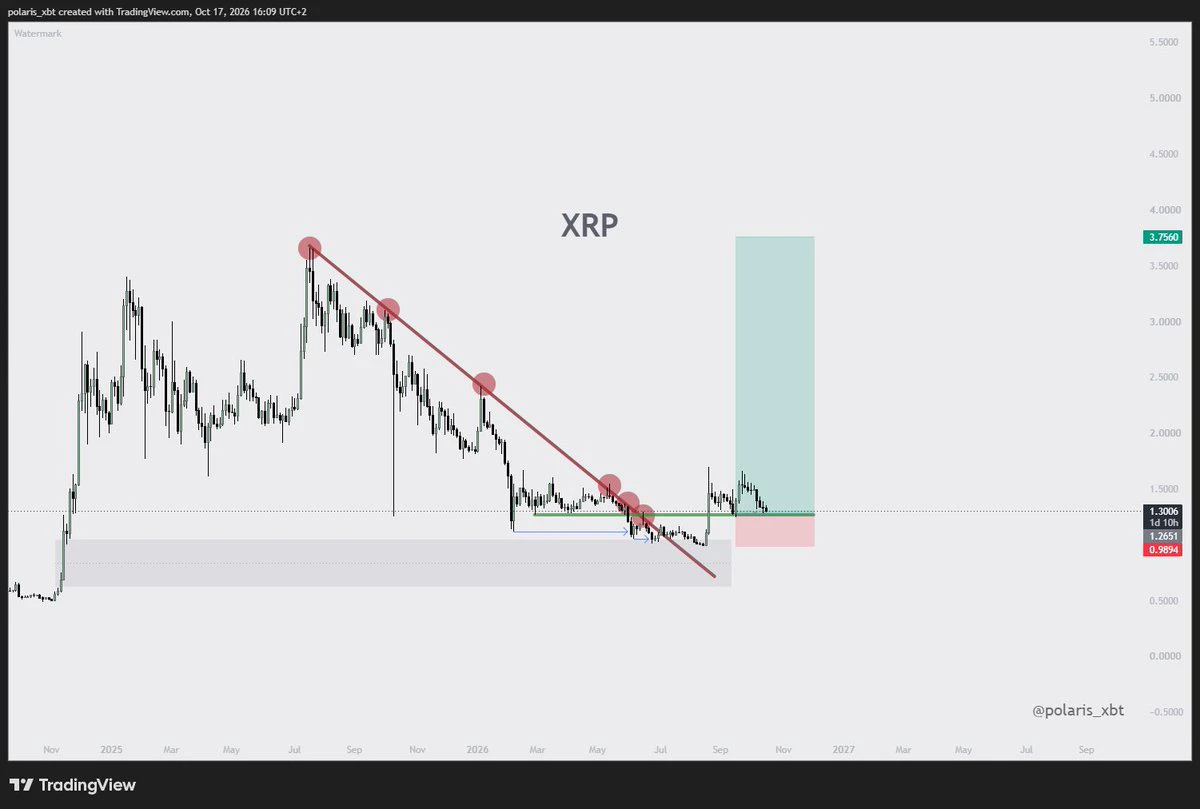
$XRP
Green support has been tested several times already and with each retest my confidence in this long goes lower.
I have reduced my size to 50% of my initial entry and will close the rest if we lose the support.
post-image
XRP-2.42%
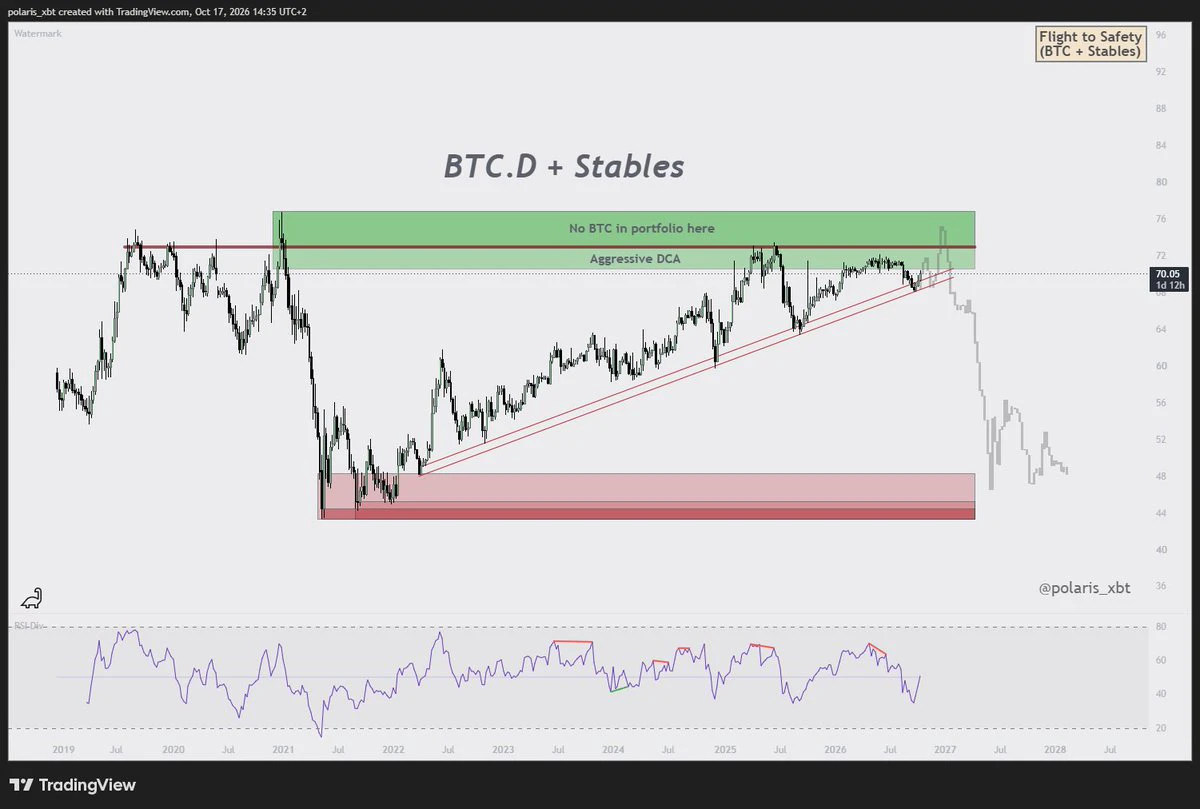
$BTC Dom
This chart has been my main guide
▫️ We touched the trendline in September, and that’s when the top on BTC formed
▫️ I’ve been risk-off ever since, focused only on shorts
▫️ This mode likely continues for several more weeks before we see a bottom
post-image
BTC-1.92%
  • 1
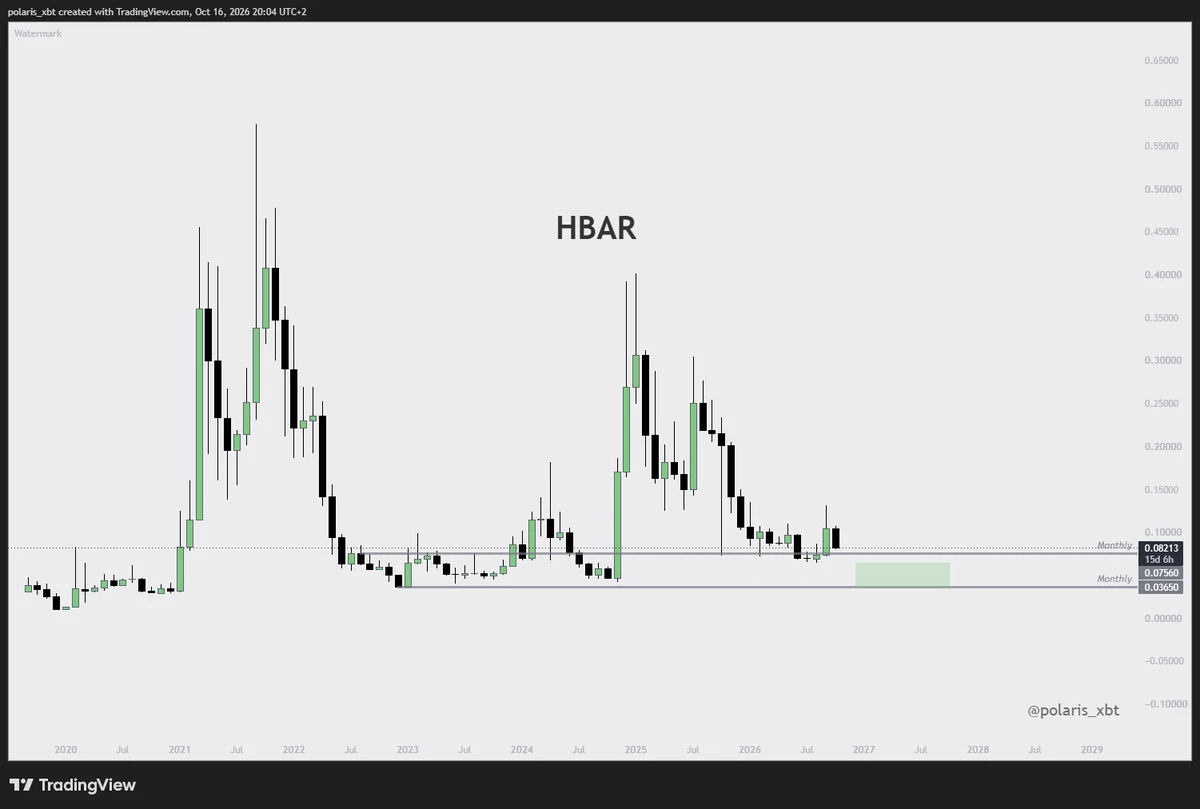
$HBAR
Doesn't look too good.
The huge local pump is now almost completely retraced and is turning into a big bull trap.
If we lose the monthly level I will start building a big spot position in the green zone.
post-image
HBAR-4.69%
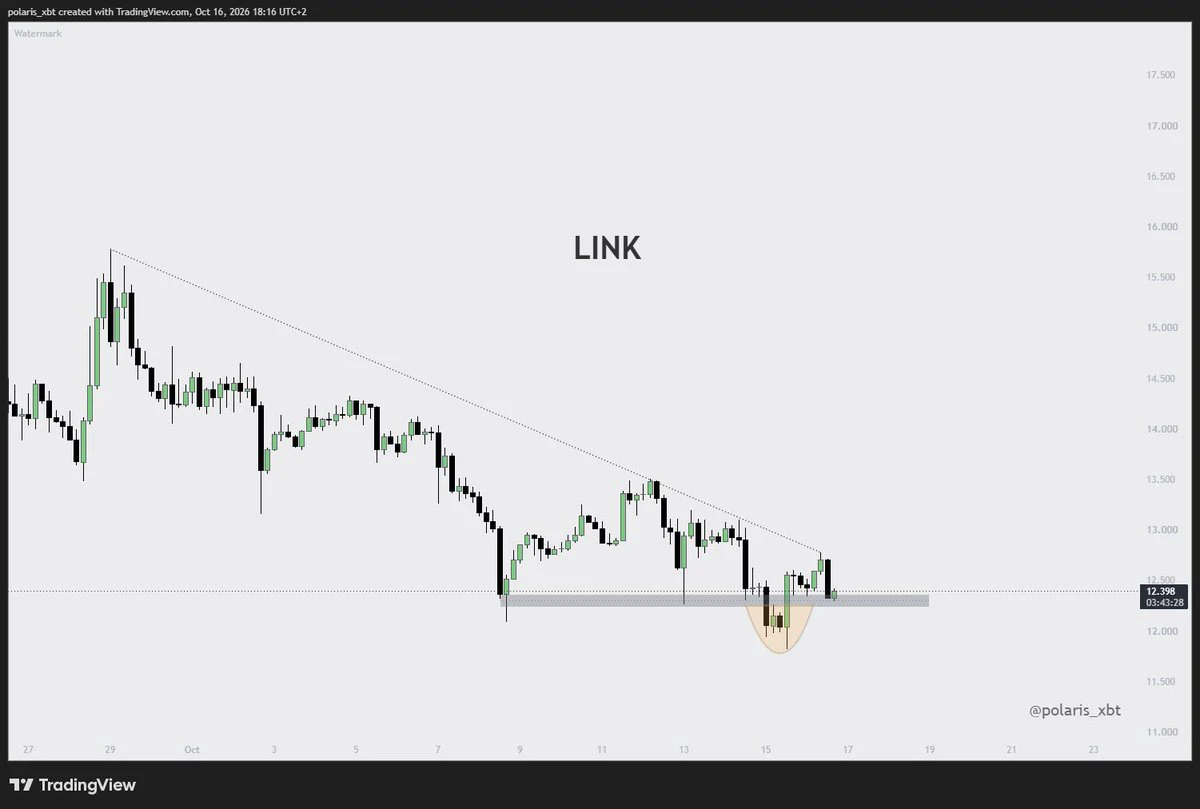
$LINK
Bounce here or die...
post-image
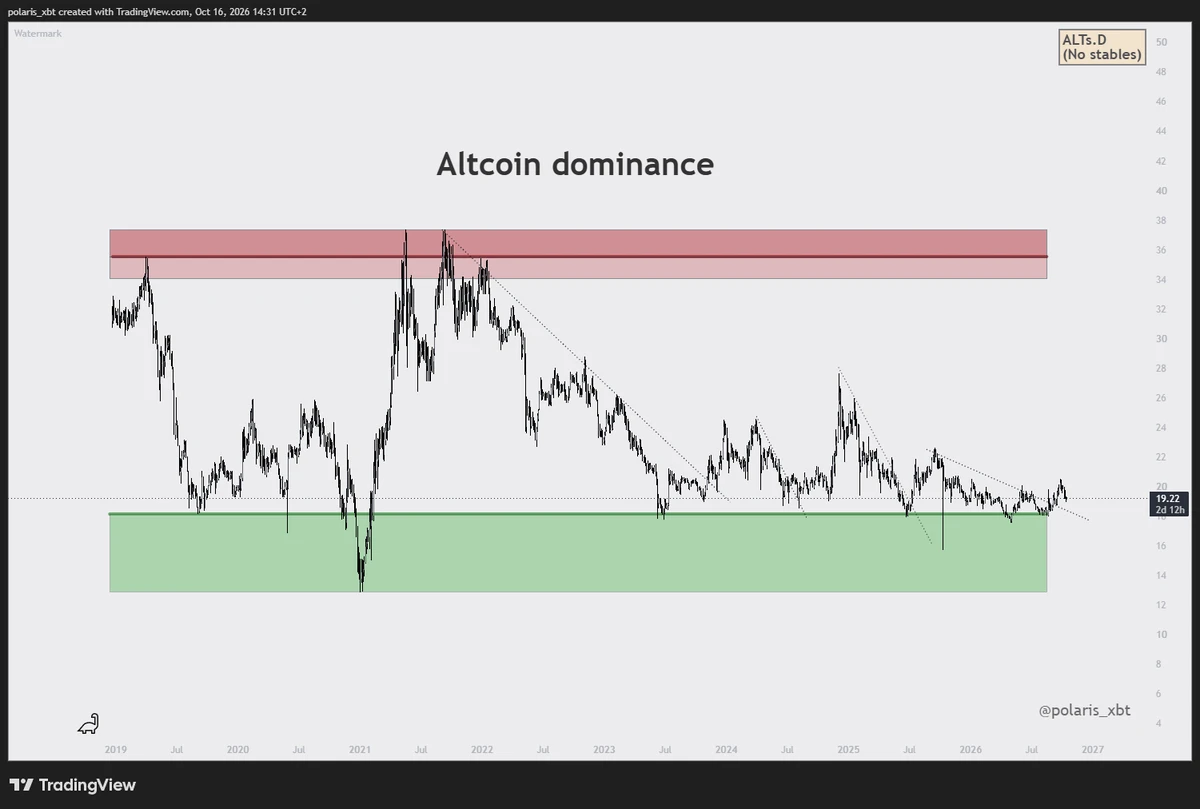
Decision time for alts
Do we make a higher low here and continue up..
or
everything fizzles once again and we test the range low for billionth time
post-image