Square
Following
Hot
News
Notifications
Profile

GertVanLagen

vip
No content yet
Peak Tier VIP 01.6 Year(s)
0
Following
21
Followers
131
Liked
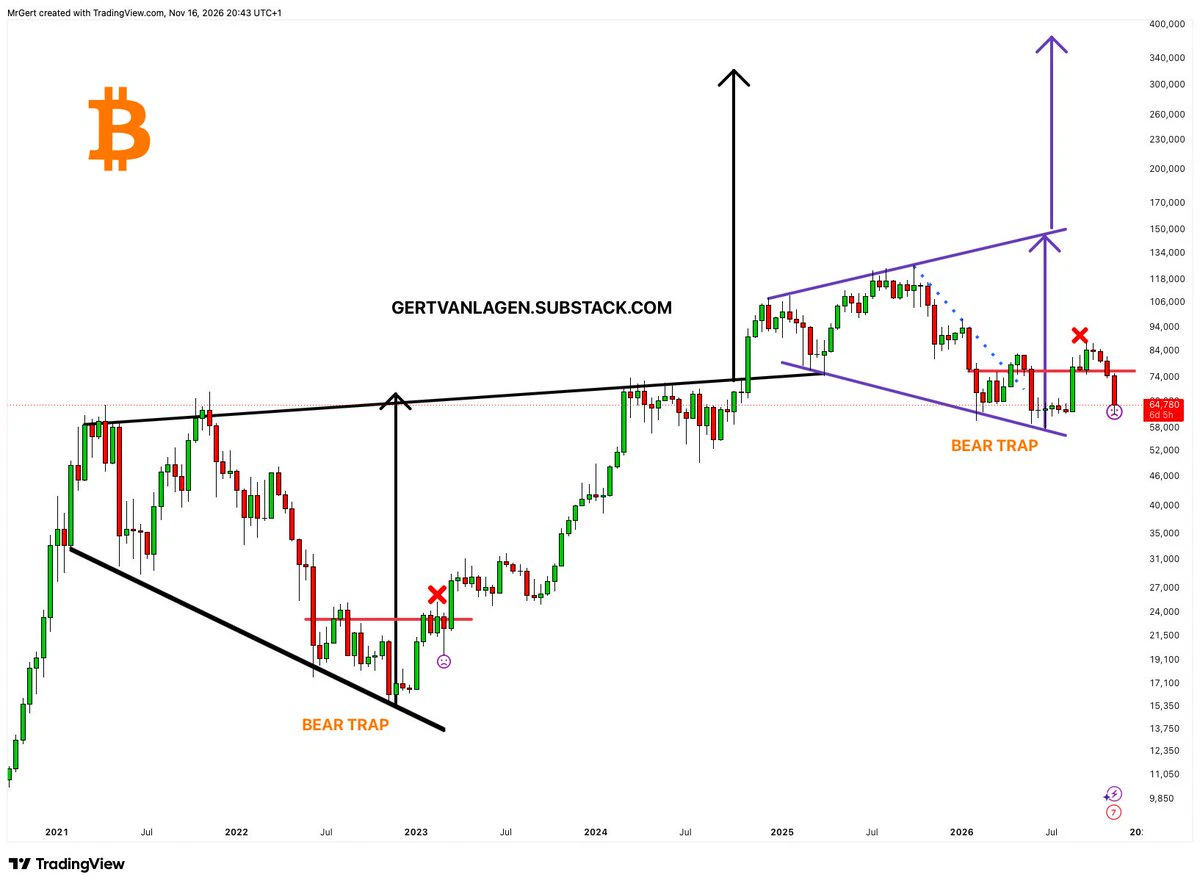
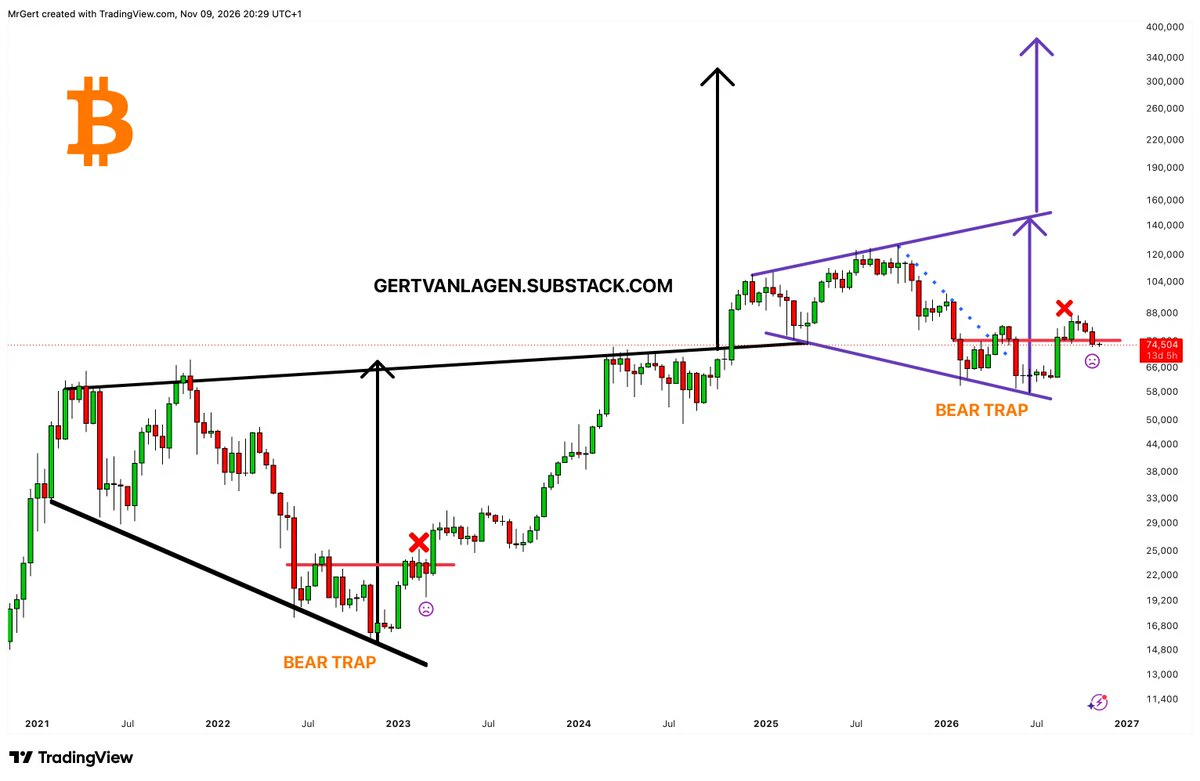
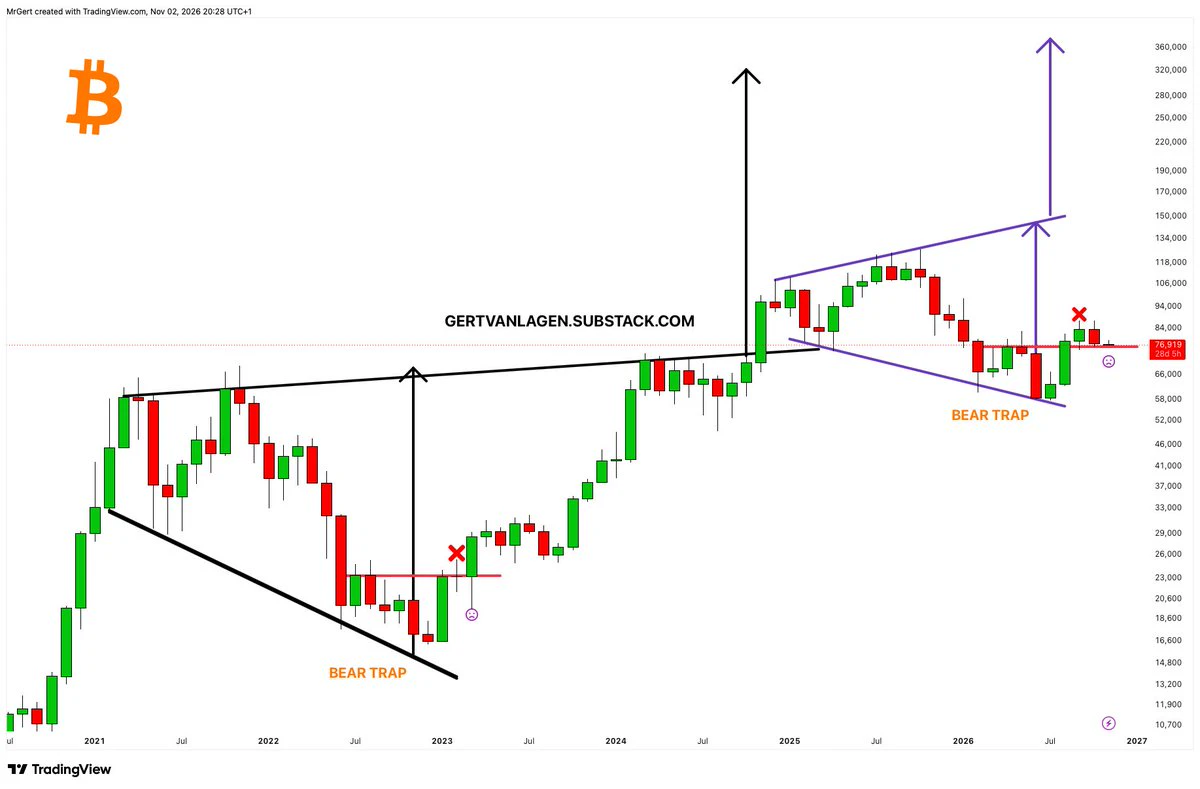
2026 vs 2022 bear market reversal:
🐻-trap at lower trendline of megaphone pattern;
❌: print higher high
☹️: print higher low
💹...
post-image
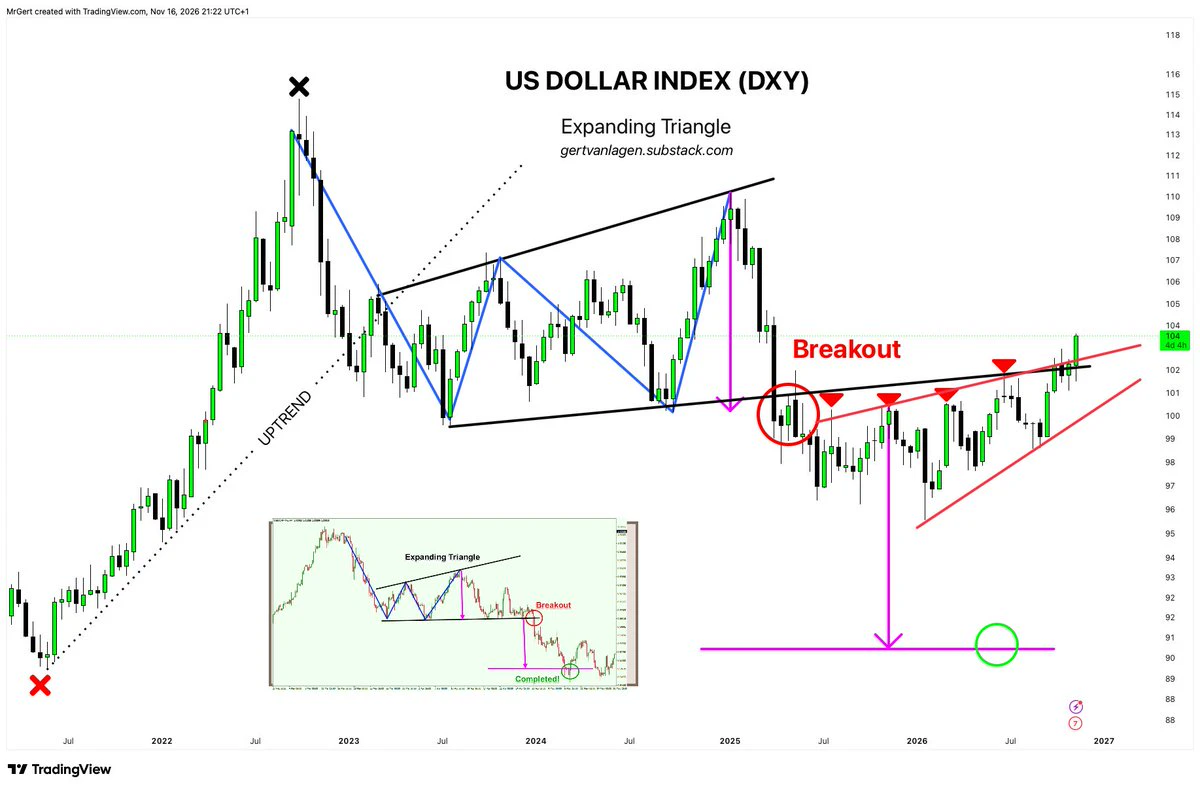
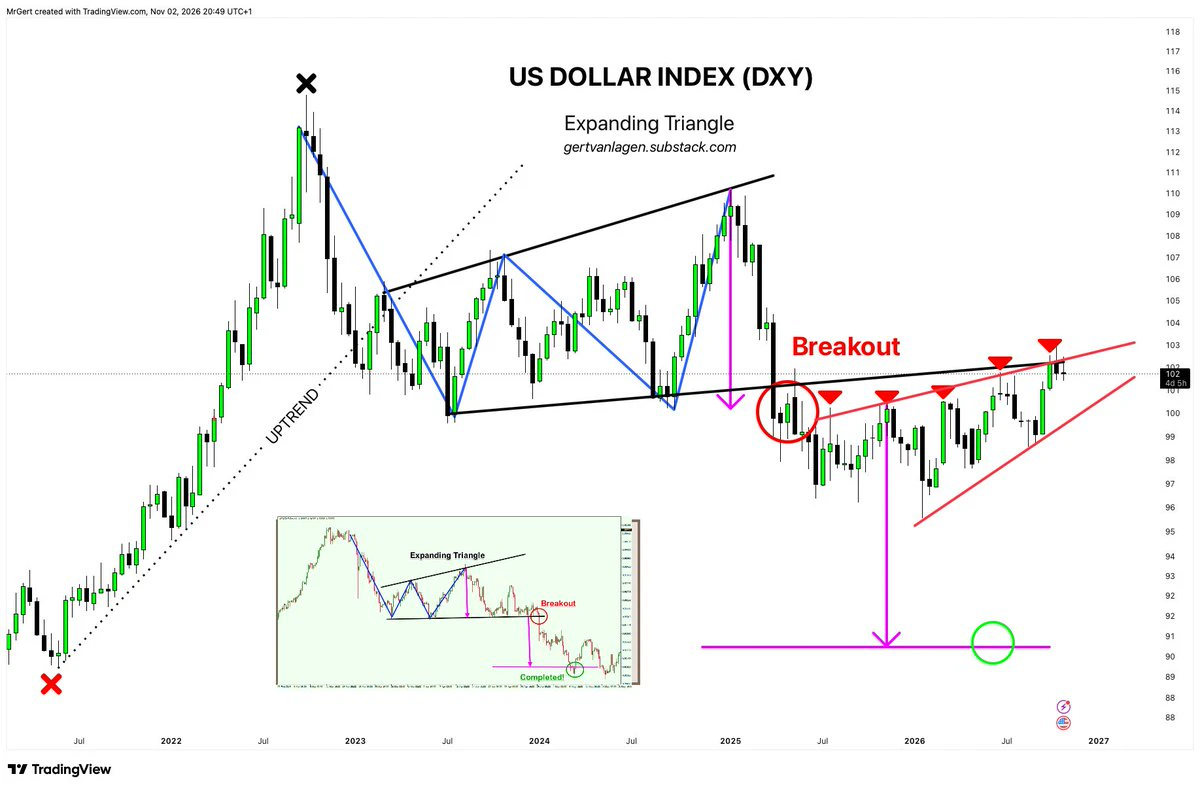
$DXY – not buying this breakout just yet.
Hawkish Fed expectations offer some support, but sharply falling oil challenges the higher-for-longer narrative.
At major multi-year resistance, a short-term macro repricing isn't enough to confirm this to be a structural breakout.
post-image
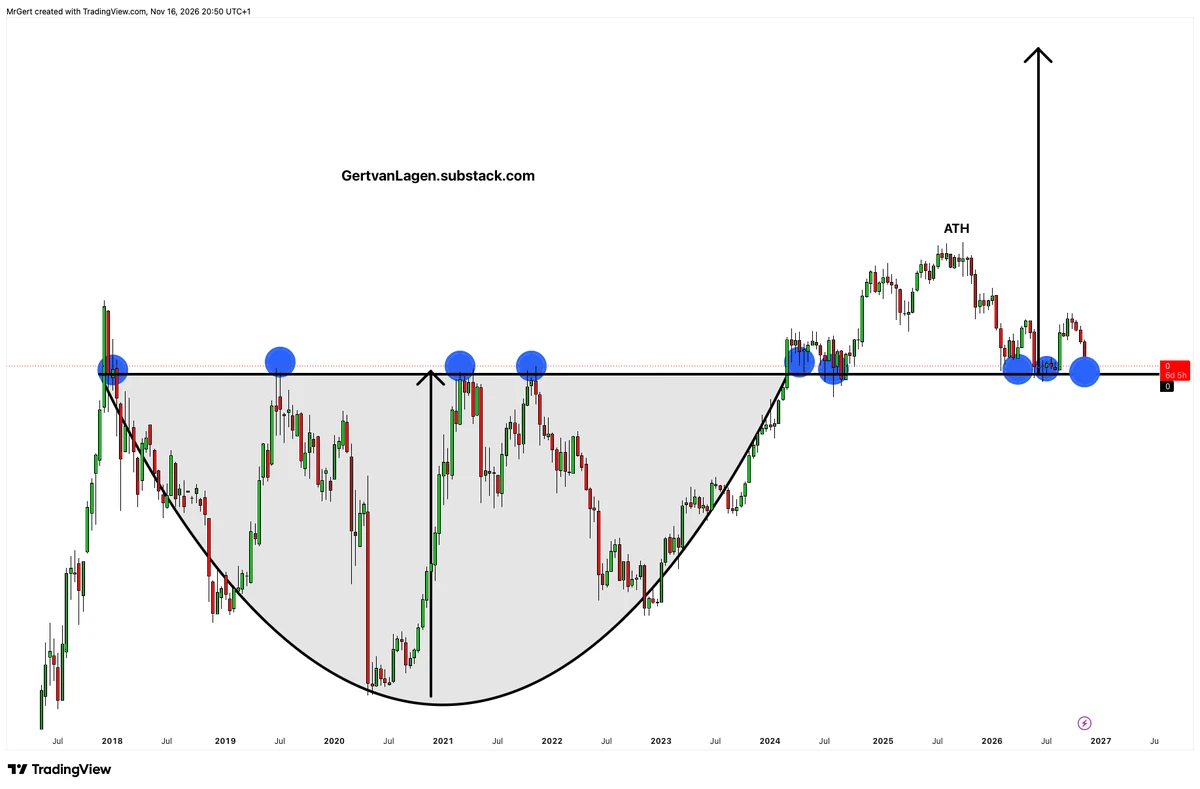
$BTC / M1 – Another retest of the key horizontal level since 2017. 🔵
BTC continues to hold its ground against monetary inflation.
post-image
BTC-0.67%
#Bitcoin dominance is coming down. Will the orange bearish channel finally break down?
BTC-0.67%
$ETH [2W] - As long as the $1.5K low holds, the bulls remain firmly in control.
The 1-year downtrend is broken, Q3 closed at a local higher high, now let's print the successive higher low to confirm trend reversal.
post-image
ETH-1.26%
$BTC [2W] – As long as the $57.8K low holds, the bulls remain firmly in control.
The 1-year downtrend is broken, Q3 closed at a local higher high, now let's print the successive higher low to confirm trend reversal.
post-image
BTC-0.67%
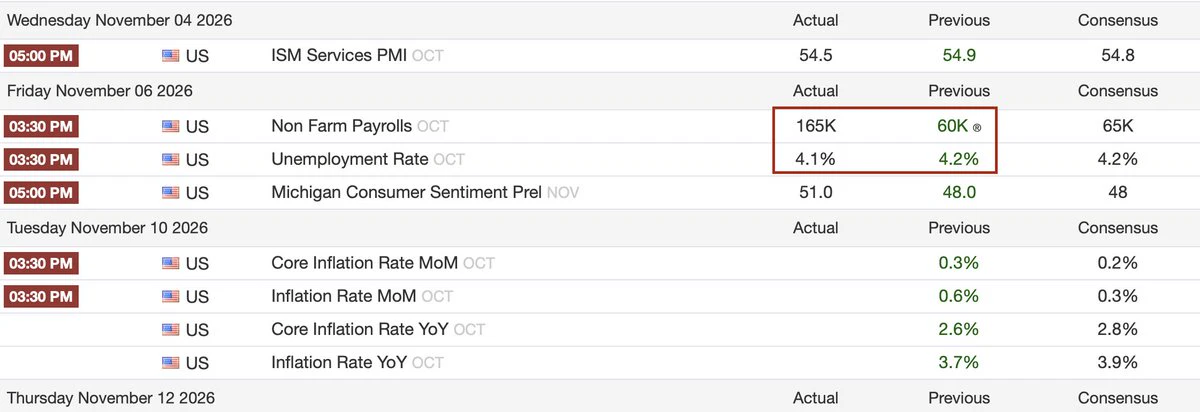
Last week's strong labor market data pushed December hike odds towards 80%.
But expectations are now heavily skewed hawkish.
A downside CPI surprise, particularly in core inflation, could trigger a sharp unwind in rate-hike bets → USD plunge?
The asymmetry is worth watching.
post-image
$BTC [2W] - The bulls remain in control as long as price holds above $57K. The important Q3 close above the $82.8K high is not easily reversed.
The double-bottom setup is getting more comparable to the 2022 reversal. Compare ❌ and ☹️.
post-image
BTC-0.67%
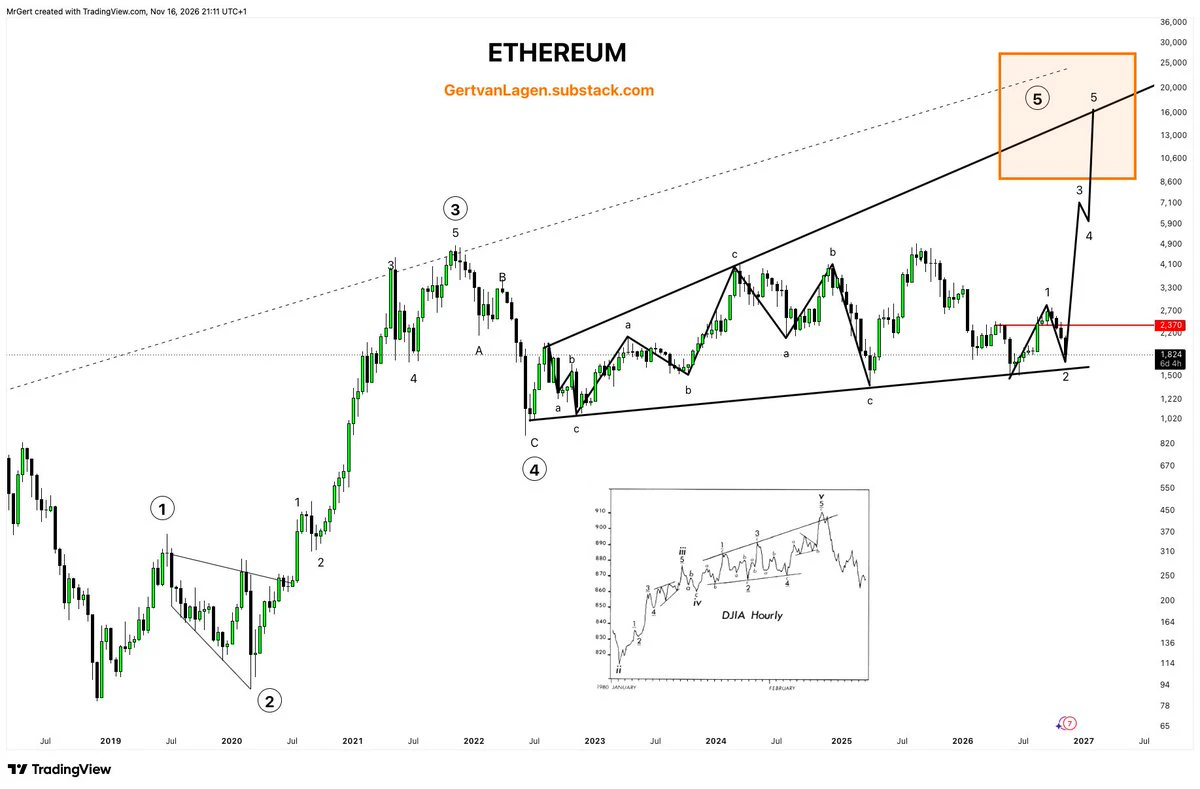
$ETH [2W] - Needs to print a higher low at -2- after breaking the 1-year downtrend and forming a higher high at -1-.
ETH-1.26%
$TSLA [1M] - is breaking through the horizontal Roadster backlight resistance.
History tells this often leads to the climb up of a steep ramp 🌪️
The final high-beta stocks are gearing up for one last speculative expansion - have severe lag w.r.t. SPX.
TSLA-2.31%
SPX+0.33%
SP500 [W] is distributing around the centennial resistance line through the 1929 and 2000 pre-recession tops.
🫧🫧🫧
#DXY [2W] is hanging from a cliff as well 🧗‍♂️
Expanding triangle with a bearish pennant flag 🩸🧨
post-image
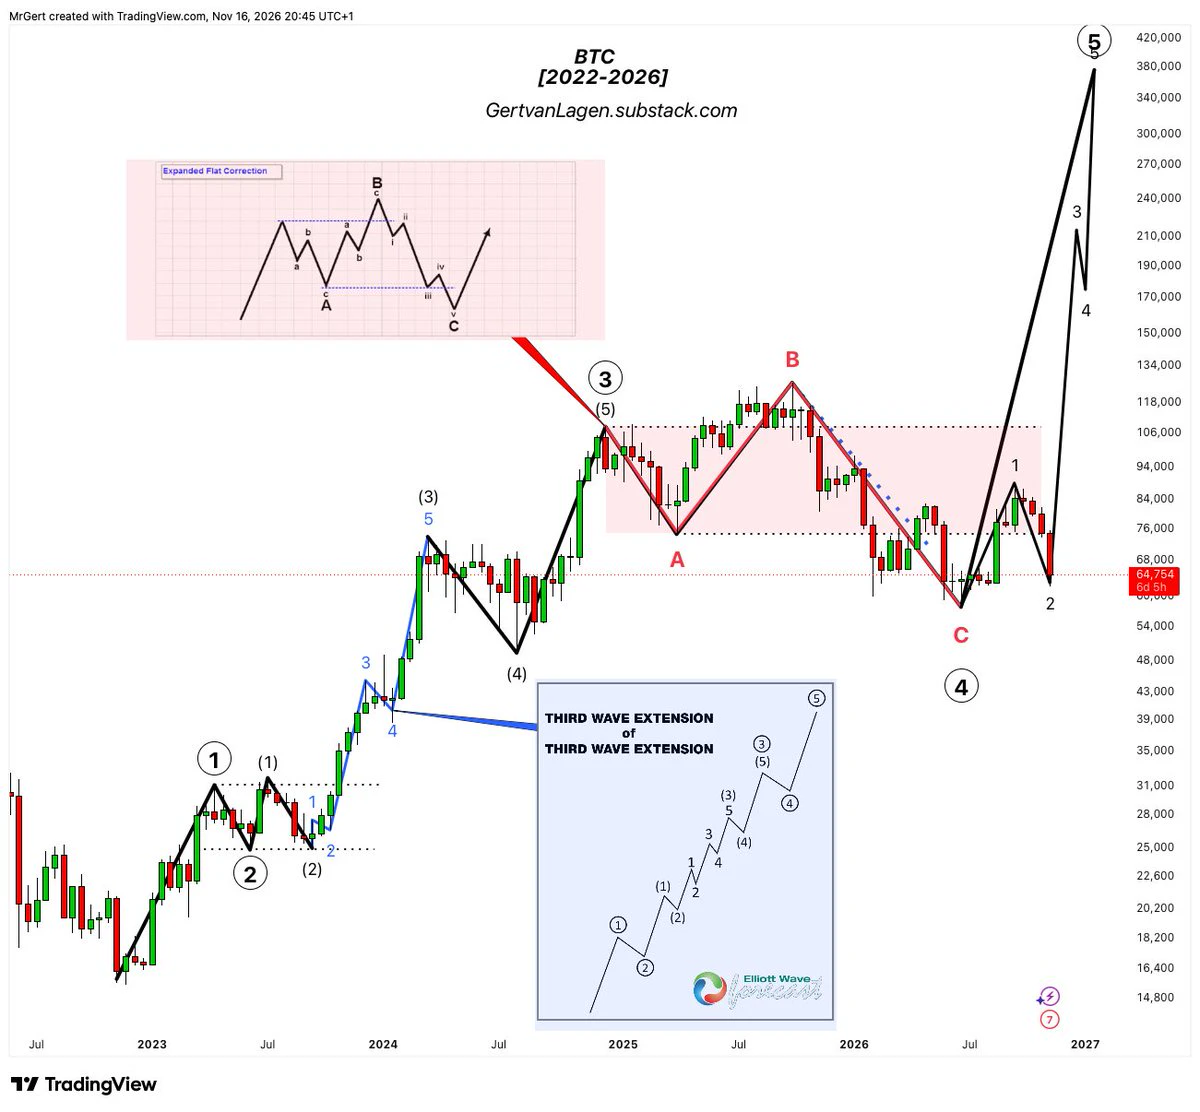
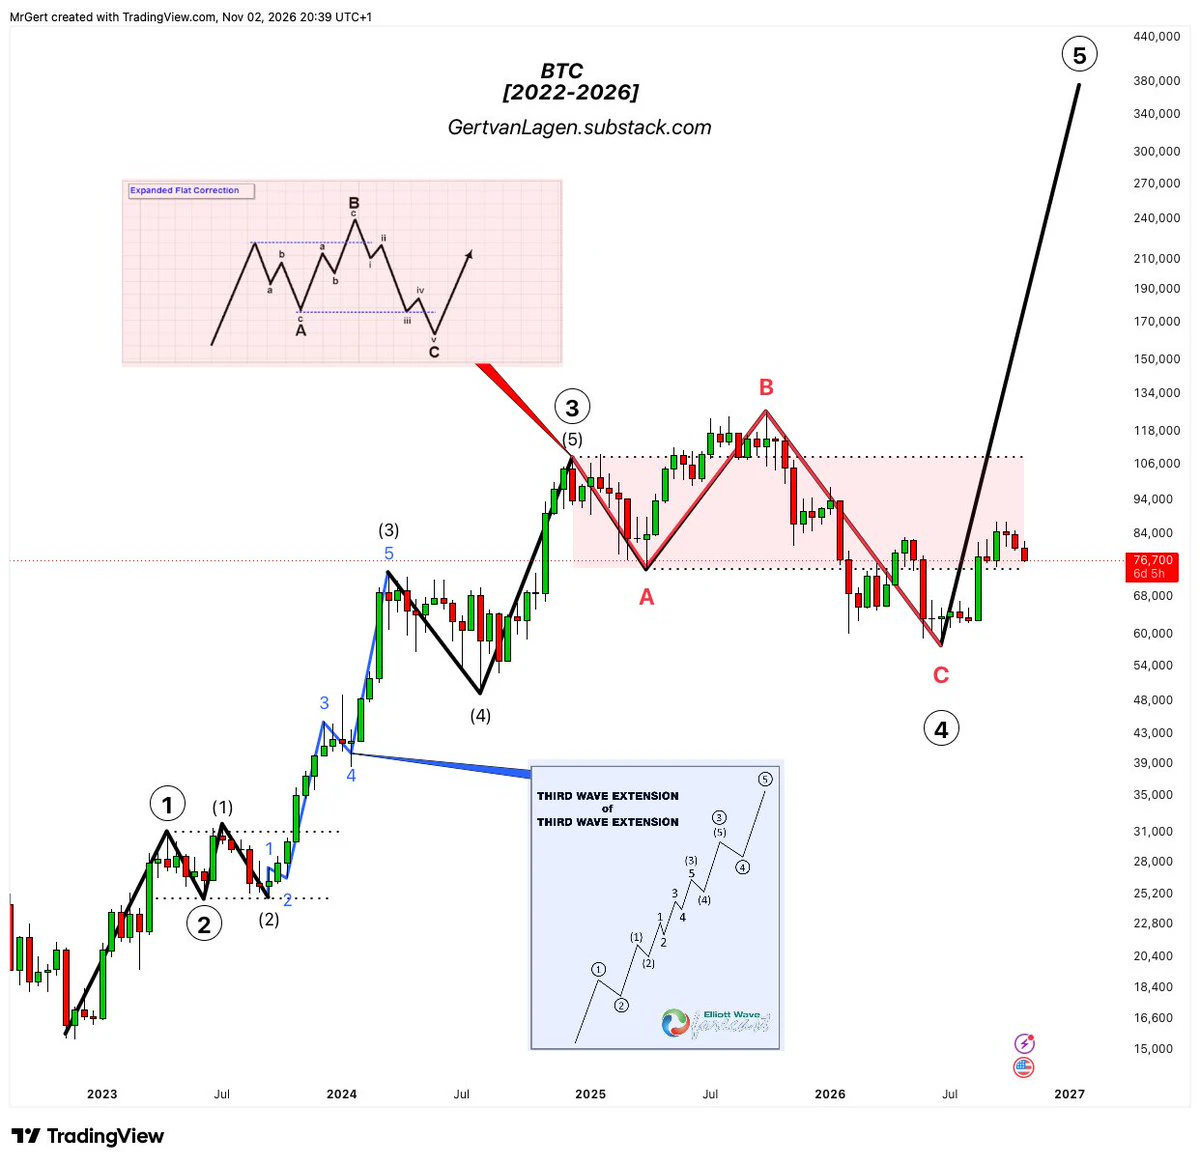
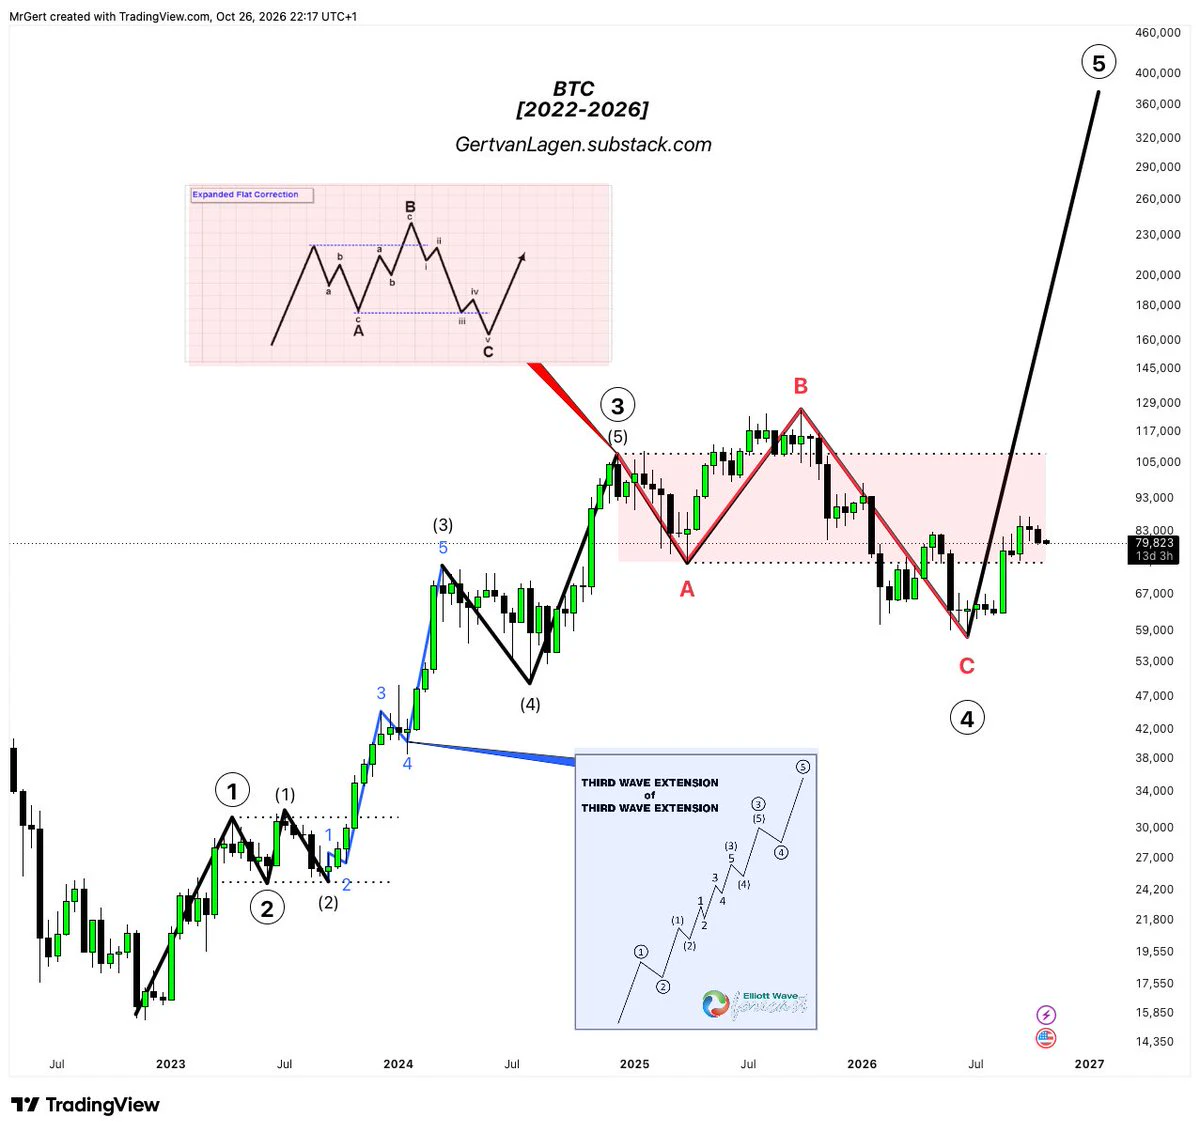
$BTC [2W] - The A-level of the expanded flat correction is being retested. Hold and bounce is necessary, for double bottom on low timeframe to remain intact.
post-image
BTC-0.67%
$BTC dominance is hanging from a cliff. 🧗‍♂️
BTC-0.67%
$ETH [2W] - the final impulse remains fully intact - currently wave 2.
ETH-1.26%
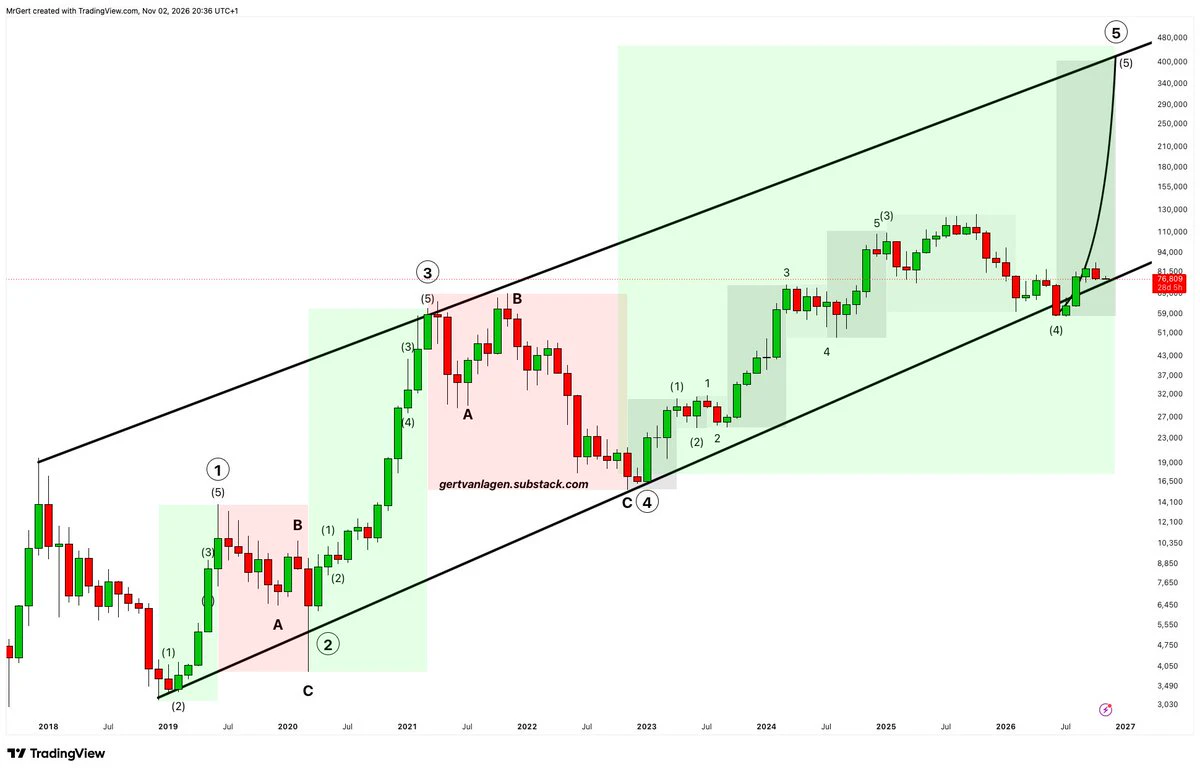
$BTC [1M] - Retesting the bottom trend line through the 2018 and 2022 lows of the 10-year bullish channel. Volatility guaranteed, historically.
post-image
BTC-0.67%
$BTC [1M] – The bullish structure remains fully intact.
The purple megaphone bottoming formation may still take one final ☹️-moment, should the horizontal level defined by monthly closes fail to hold.
So hold the line!
Either way, flush or bounce, 🚀 is loading.
post-image
BTC-0.67%
For $BTC and $ETH , holding above the June lows and printing a higher low is key.
Only that keeps the now bullish market structure intact.
The rest is noise.
post-image
BTC-0.67%
ETH-1.26%
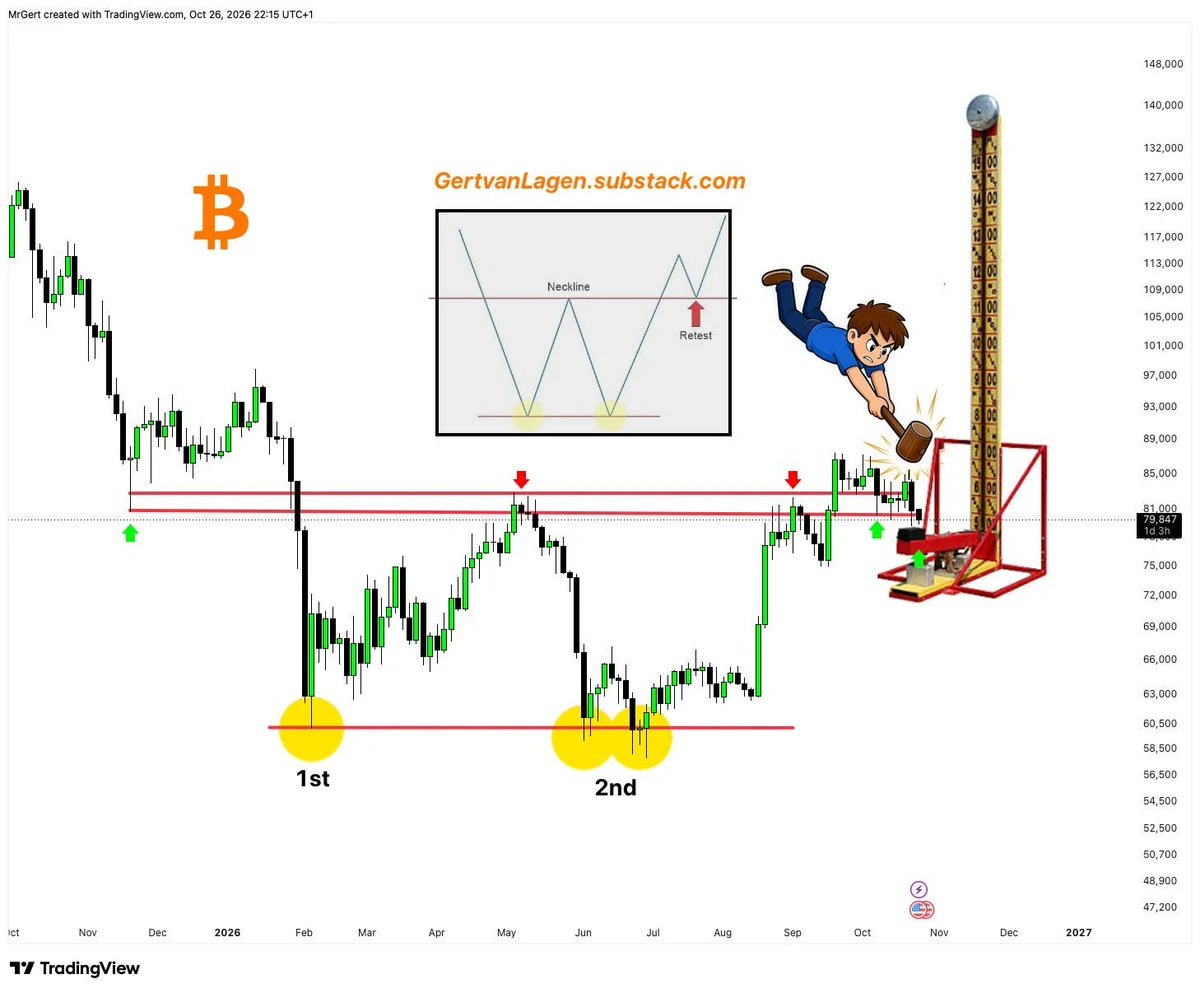
Does this look to you like a broken neckline?
The $75k higher low is the most important price level to watch on the lower timeframe.
Breaking this would morph the double bottom into a potential inverse Head and Shoulders - still targeting $120k.
post-image
Load More