



Square
Following
Hot
News
Notifications
Profile
Share your thoughts
placeholder
Article
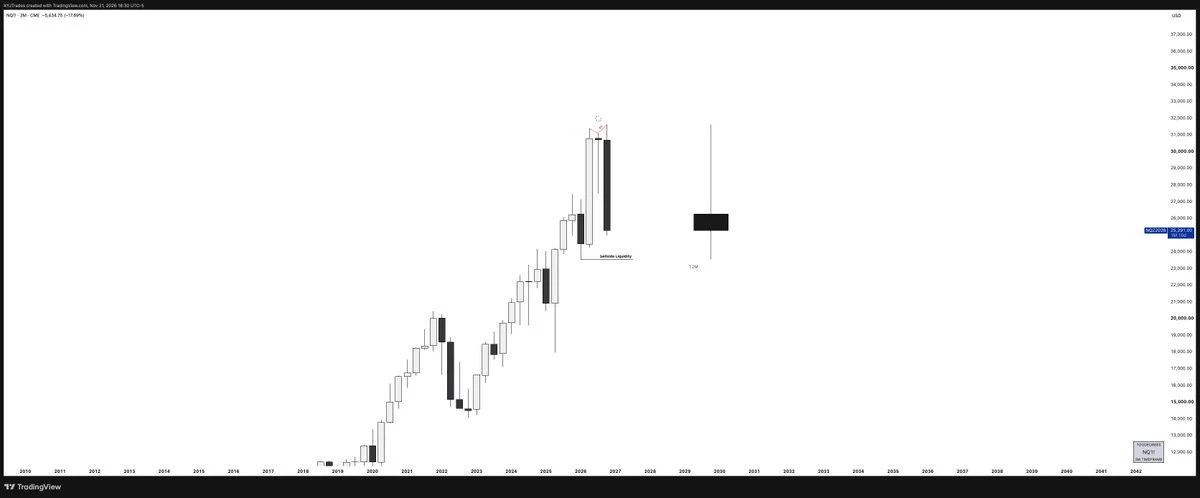
Reversal Sequence; Yearly Candle profiled by quarterly swing formation
post-image
DNF Sword Soul’s Otherworldly Adventure: Braving Super Mario and Slashing the Evil Princess
Trenches
IDOL
I
bade
b
IDOL
0x3b...ab07
Market Cap
$.
Change
.
24h Vol
$.
Holders
.
PIEVERSE
P
bade
b
PIEVERSE
0x0e...25a9
Market Cap
$.
Change
.
24h Vol
$.
Holders
.
FIONA
F
bade
b
FIONA
B34n...pump
Market Cap
$.
Change
.
24h Vol
$.
Holders
.
Singularity
S
bade
b
Singularity
7R4M...pump
Market Cap
$.
Change
.
24h Vol
$.
Holders
.
CLAUDIA
C
bade
b
CLAUDIA
2j5S...W2ZM
Market Cap
$.
Change
.
24h Vol
$.
Holders
.
#USNOVJoblessClaimsBeatExpectations #ShareWeekly

US Jobless Claims Rise Above Forecast: Why a Cooling Labor Market Is Not Enough to Change the Fed’s Direction

The latest U.S. unemployment claims report has delivered an important message to financial markets: America's labor market is gradually losing momentum, but it is not weakening fast enough to force the Federal Reserve to abandon its restrictive monetary policy. This distinction is becoming increasingly important for investors as inflation concerns, interest-rate expectations, and institutional liquidity continue to influence global fi
BTC-0.67%
US500-3.01%
US30-1.48%
BLK-3.02%
IBIT-5.97%
PLIAN market update
live-cover
LIVE1,891
BTC-0.67%
USDC+0.01%
AAVE-1.22%
TRUMP-0.95%
BCH+1.05%
3372.56@开户以来, that's a huge loss
Contract Strategy · A Contrarian Read of Long/Short Crowding
📉 A high long/short ratio does not mean prices will keep rising: BTC’s long/short ratio is 3.3860, and SOL’s is 3.7148. If prices rebound while the ratios remain elevated, beware of a spike followed by a pullback as longs become crowded; don’t chase the rally.
🔻 When longs are extremely crowded, first watch for signs of weakening: BTC’s funding rate is -0.0070%, and its basis is -0.063%. If the price falls while the long/short ratio remains high, longs may be getting squeezed; on a rebound, prioritize reducing positions and protect
BTC-0.65%
SOL-0.74%
ETH-1.23%
BNB-0.72%
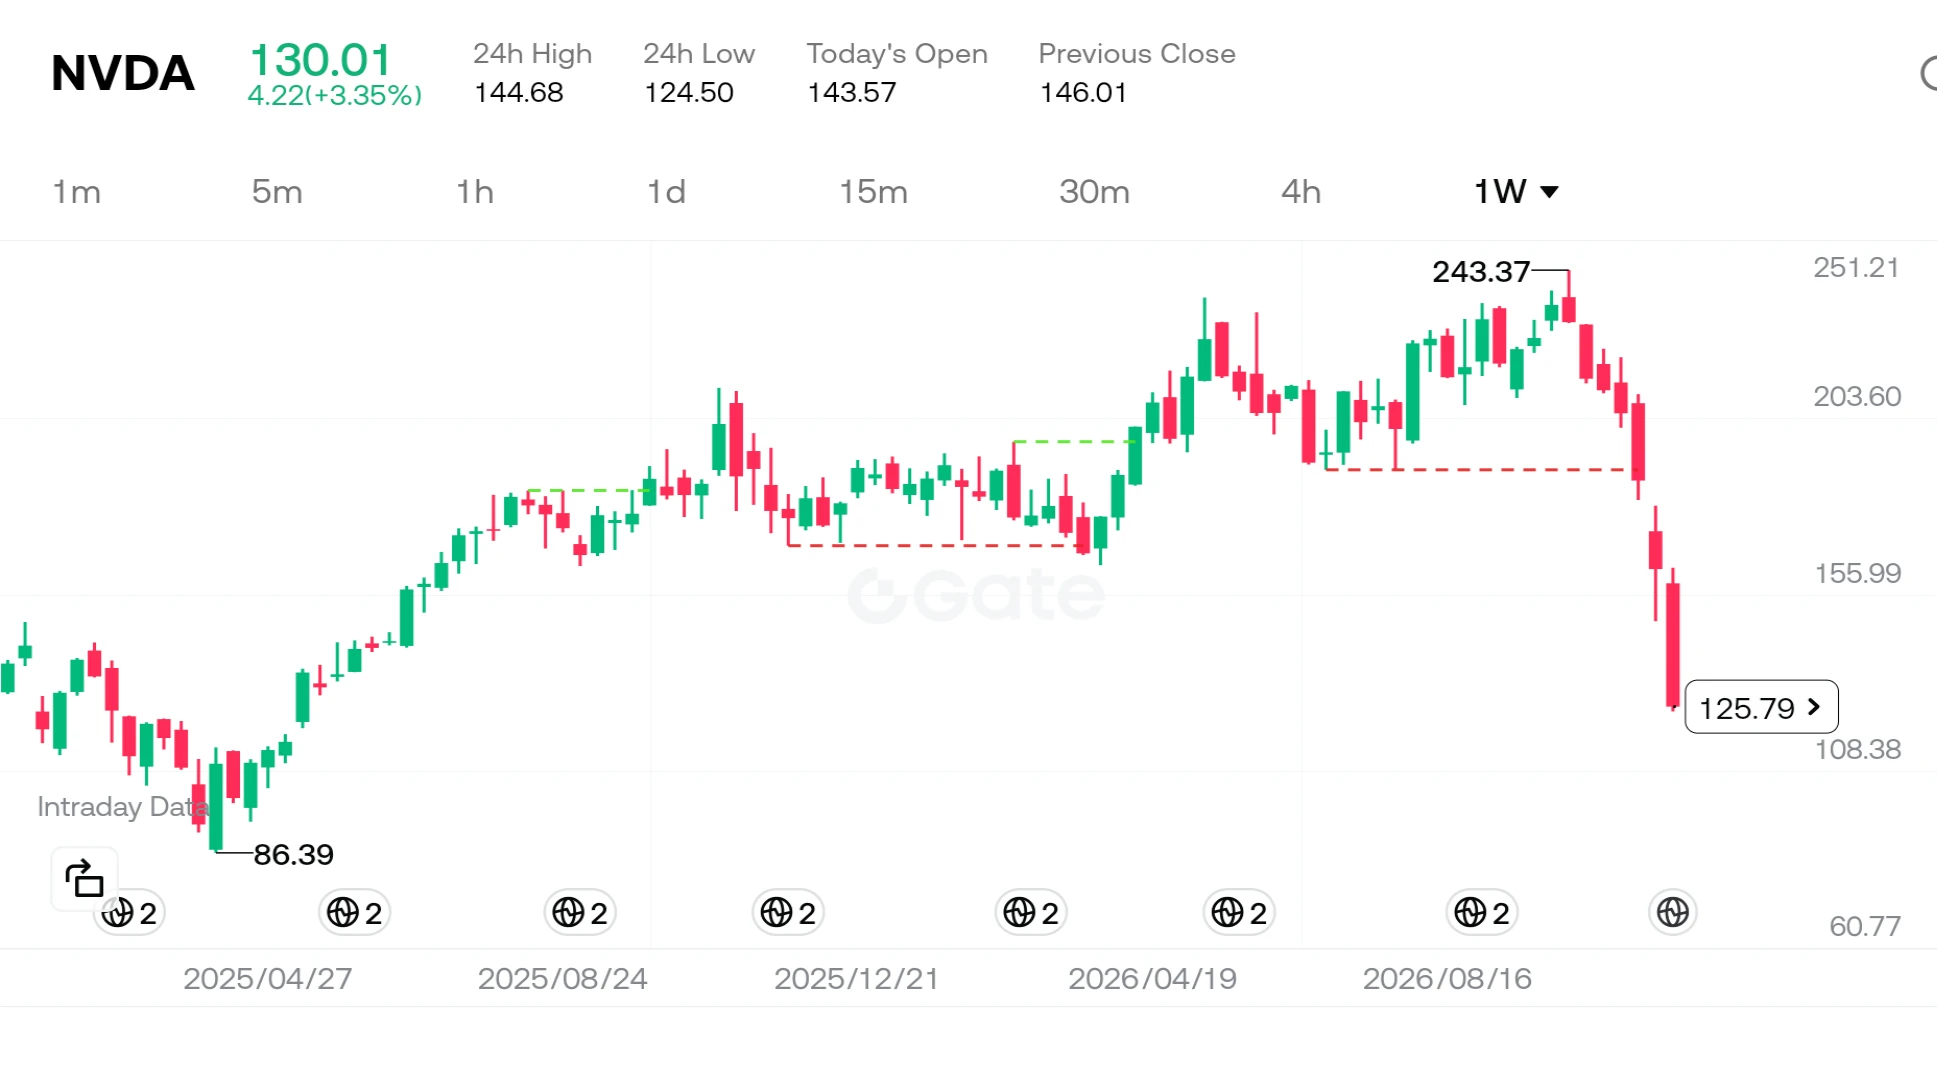
Nvidia shares failed to bring any cheer to investors, slipping to the $130 level in weekend trading. The sharp decline from the stock's peak of $243 can no longer be dismissed as a mere "market correction." The formal investigation launched by the U.S. Securities and Exchange Commission (SEC) into the company’s accounting practices has served as the primary catalyst for this downturn.

So, what does this investigation signify, and why has it shaken the stock price so profoundly?

Looking first at the company itself: as the driving force behind the artificial intelligence revolution, Nvidia has
post-image
User_any
$NVDA ‌
Nvidia has been losing ground for seven consecutive weeks—a trend not seen since 2008. The stock plummeted 14% last Friday alone, bringing its total decline over this seven-week period to approximately 46%. As clearly illustrated on the chart, the price has retreated from a peak of $243 to the $125 range. So, what is the story behind how this once-most-valuable company reached this point?
In reality, this is not merely a stock market correction; it is the result of three major, intersecting storms hitting the same vessel.
First, let’s look at the company’s internal dynamics. Uncertainty within management following a CEO transition, combined with the SEC’s decision to investigate the company’s accounting practices, has severely shaken market confidence. But that is not the whole story. The massive scale of spending on artificial intelligence has led investors to ask: "So much money is being spent—but when will we see a return?"
Meanwhile, macroeconomic headwinds have also shifted. Minutes from the Federal Reserve’s meetings indicate that nearly all officials expect interest rate hikes to continue. A high-interest-rate environment exerts significant pressure on growth stocks, which are valued based on their projected future cash flows. This situation has impacted not only Nvidia but the S&P 500 as well; the index fell 8.6%, marking its worst week since April 2025 and pushing it into correction territory.
Even the major Anthropic IPO that took place last week was not enough to halt this wave of selling. For many analysts, this situation serves as proof that the market is no longer focused on "new narratives," but rather exclusively on "cash flow and profitability." The fact that gold and silver have fallen to their lowest levels in over a year, combined with oil’s decline for the third consecutive week, highlights just how fragile risk appetite has become. Investors have effectively "retreated to their corners."
The most important lesson for individual investors here is that, regardless of how strong a company’s operational performance may be, macroeconomic headwinds and management uncertainties can fundamentally shake its valuation. Nvidia’s core business model remains robust, yet the market is currently pricing in risks rather than the company’s growth story. In times like these, the wisest approach is to avoid leverage and—instead of attempting to call the "bottom"—wait for prices to stabilize.
Do you believe this decline in Nvidia presents a long-term investment opportunity, or are we witnessing the deflation of an artificial intelligence bubble?
#Nvidia #Macro #TechStocks
#ShareWeekly #WCTCS9
Not investment advice.
repost-content-media
NVDA-13.84%
  • 2
  • 2
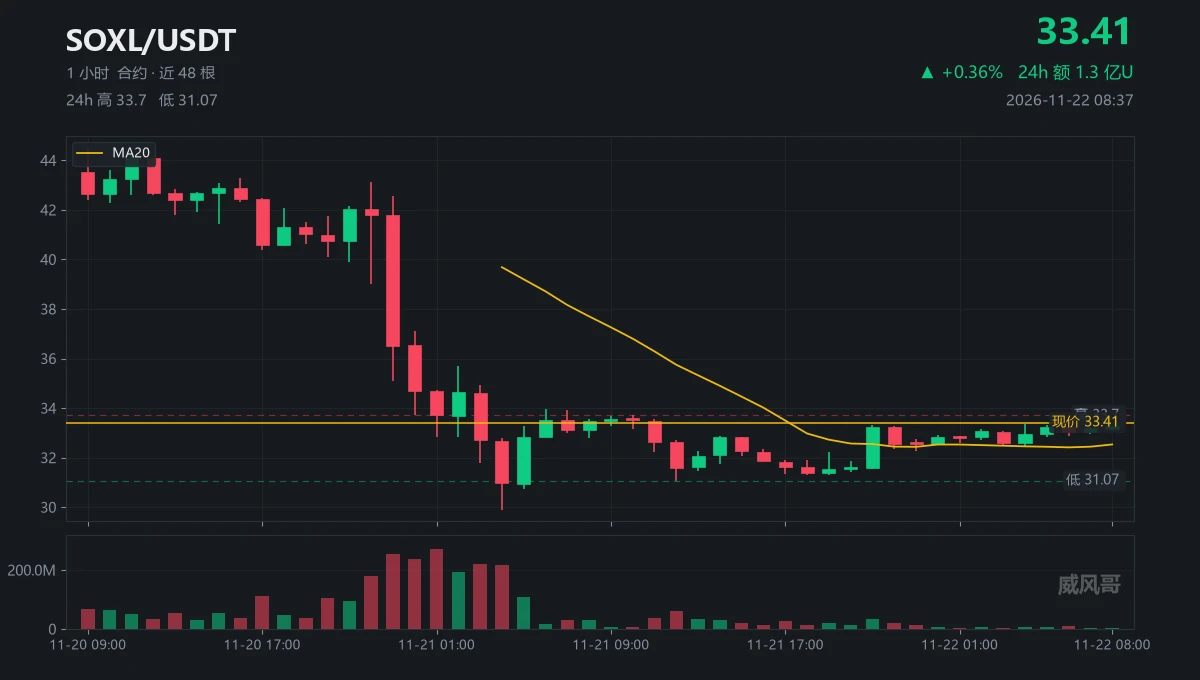
19 hours, from 44.54 to 29.89, down 0.77 bucks per hour
This stretch.
I didn't make that trade.
I was sitting on my hands then; no signal had flashed.
Four bars. 255 million, 238 million, 269 million, 222 million.
All around 4x volume, each one lower than the last.
Even if a signal had flashed, I wouldn't chase the fourth bar—that's how you become someone else's exit liquidity.
Now.
33.41, ranging for 28 hours, with a high of 33.70 and a low of 31.07.
This middle range.
I don't trade it.
If it breaks below 31.07, I'll go short; if it gets above 33.70 and volume returns to 60 million contracts,
post-image
SOXL-1.16%
  • 2
  • 1
BTC stremer
live-cover
LIVE1,483
BTC-0.67%
ETH-1.26%
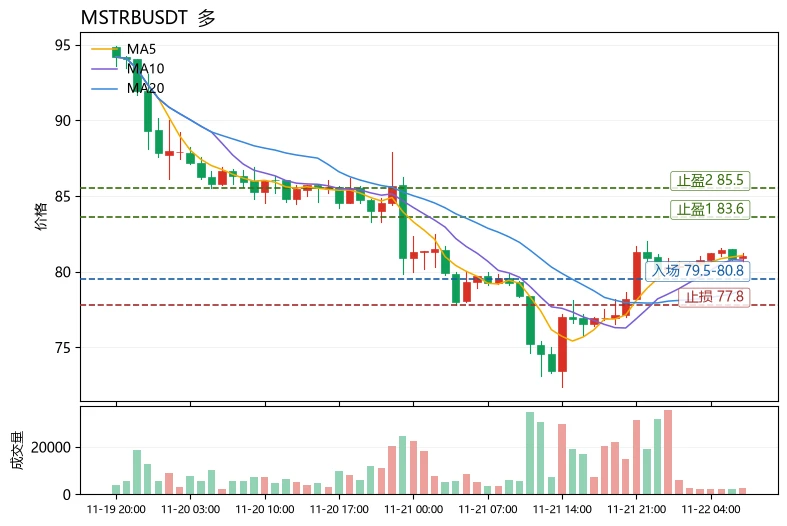
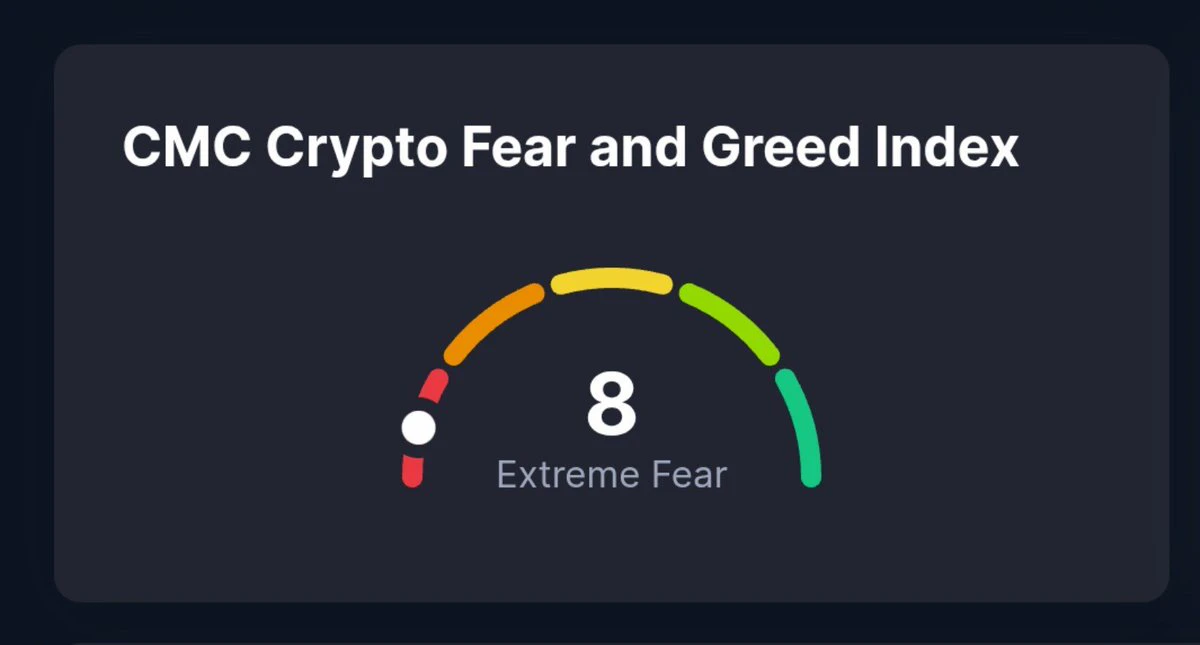
The most unusual detail in today’s market is that the Fear and Greed Index has plunged to 12, deep in the extreme fear zone, while MSTBUSDT bucked the trend and closed up 2.06%. MA5 (81.072) also held firmly above MA20 (78.83), and the MACD histogram remained bullish at +0.5023—a clear divergence between market panic and price structure. Among similarly active assets, $ENSO USDT$ENSOUSDT led with a 13.38% gain, but its MACD histogram showed a bearish signal at -0.001279, while its funding rate of -0.6305% indicates crowded longs and elevated risk of chasing the rally;
$PEPEUSDT fell 2.01% over
post-image
pepeusdt
pepeusdtUncle Pepe
Pump.Fun
MC:$2.33KHolders:1
0%
ENSO-3.03%
$IDOL ‌ ‌
IDOL has recently become one of the most talked-about—yet highly controversial—assets in the crypto market. The massive green candle visible on the chart signals a surge of over 50% within 24 hours. However, the story behind this rapid ascent is not merely one of "discovery"; it also involves a complex equation of liquidity and risk.

IDOL is the native token of the MEET48 ecosystem. The project aims to integrate AI-powered content creation, virtual idols, and the fan economy into the Web3 space. Fans can use the token to participate in voting, make purchases during virtual events,
IDOL-6.71%
  • 4
  • 1
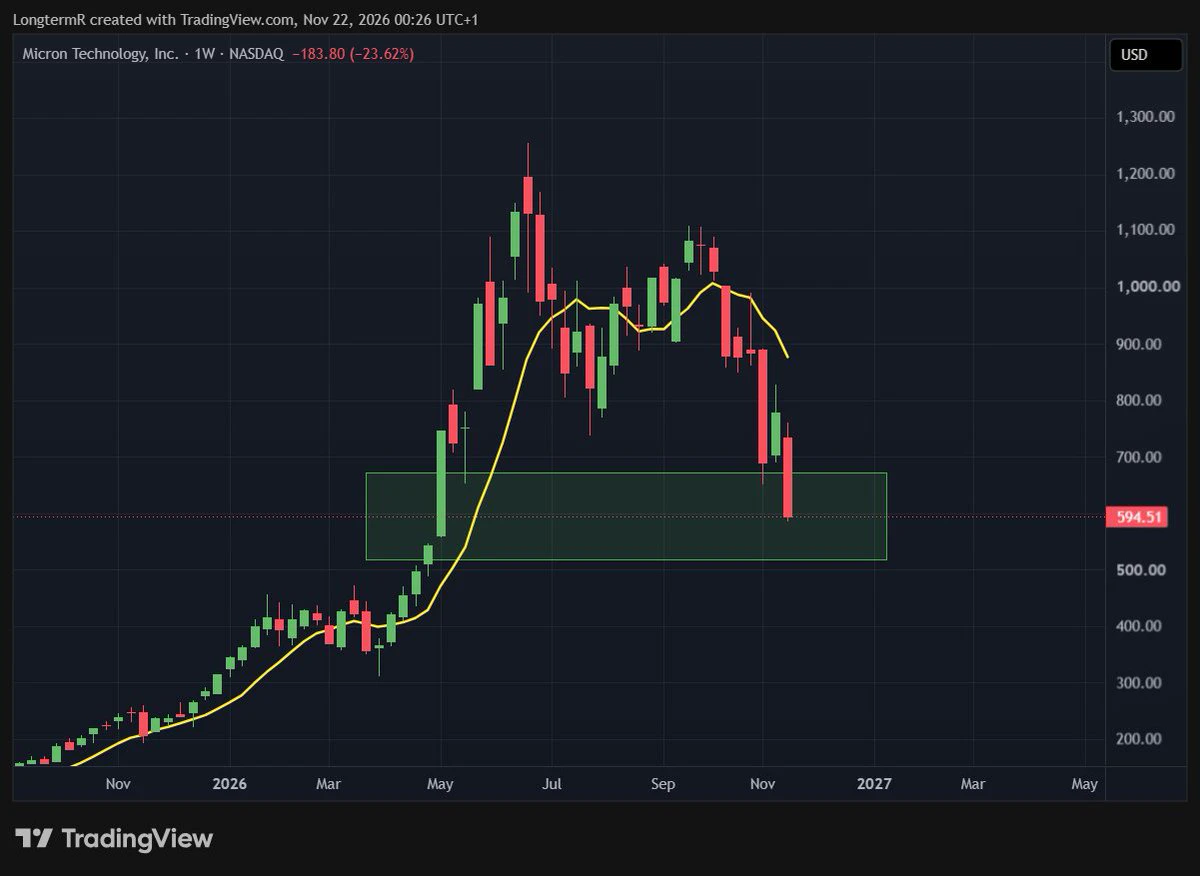
$MU Yeah, I know Micron looks like s*it here.
But it is actually in the Fib retracement area box.
Good to know ✍️🏼
post-image
MU-13.88%
#BTCBreaksBelow60K Bitcoin briefly slipped below the $60,000 mark on November 20, marking its lowest levels since the summer and testing a psychological floor that many market participants had been watching closely. The move came amid broader pressure on risk assets, with technology stocks facing significant selling and sentiment turning more cautious across markets. What began as a sharp intraday decline raised immediate questions about whether this level would hold or whether further downside was still ahead.
By Friday’s session, Bitcoin had dropped from levels near $61,400 earlier in the da
BTC-0.67%
Recent liquidity shortages, combined with panic over uncertainty around capital expenditures, are creating a huge “reverse tech bubble”—even Walmart’s forward P/E has reached 45x.

This explains why the AI bubble “bursts” almost every year. U.S. investors have long enjoyed asset-light business models and simply can’t stomach businesses that need massive capital expenditures to make money. 99% of people who trade stocks don’t use AI at all, so they have no firsthand experience of its value. Everyone is used to seeing the steady monthly growth of SaaS and doesn’t understand that AI revenue comes
WMT+1.54%
  • 4
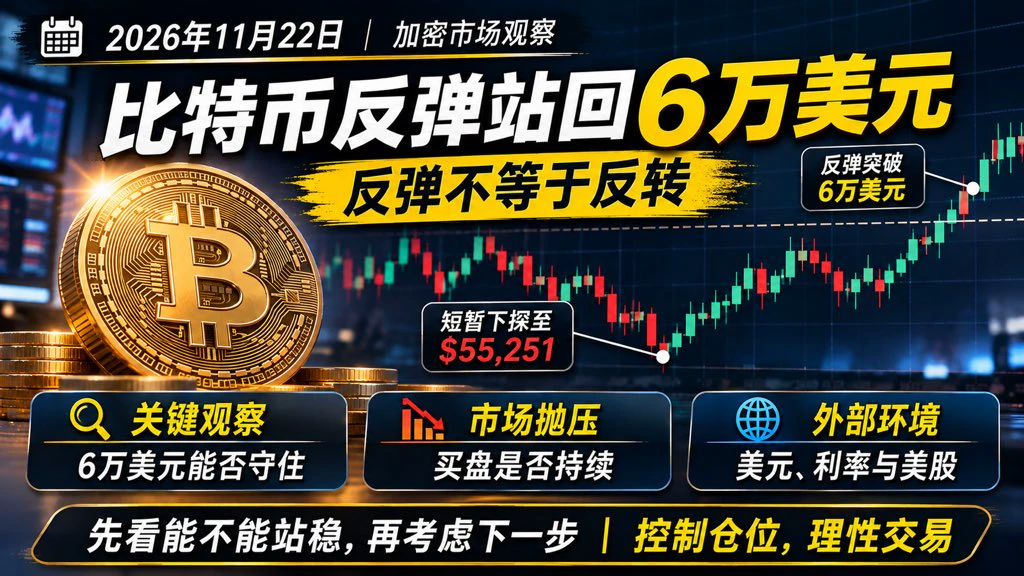
₿ Nov 22 | Bitcoin rebounds above $60,000—is crypto really stable now?
BTC has been quite a roller coaster these past couple of days.
It briefly fell to around $55,000, then quickly rebounded and climbed back above $60,000.
When it was falling, people worried it would keep dropping. When it rebounded, some started saying the bull market was back.
But I don't think we need to rush to any conclusions just yet.
There are three key things to watch in this rebound:
1️⃣ Can $60,000 hold?
Getting back above it is just the first step. The key is whether the price can stabilize, rather than reclaiming
post-image
BTC-0.67%
  • 1
U haven't felt enough pain yet
Buckle up alt coiners
$btc
post-image
BTC-0.67%
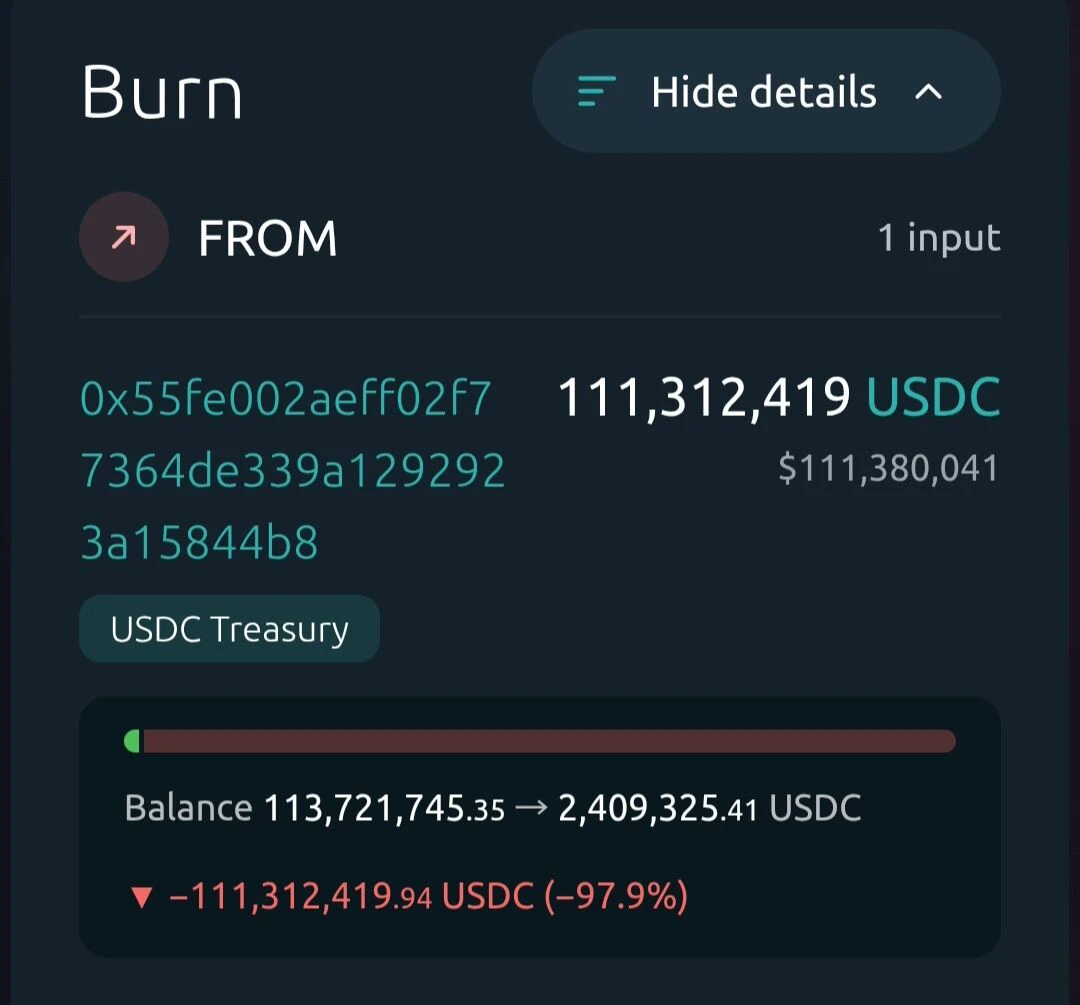
111.3 Million USDC Burned

A large USDC burn has caught attention after 111,312,419 USDC, worth approximately $111.3 million, was removed from circulation.

Token burns are part of stablecoin supply management and can happen for several reasons, including redemptions and liquidity adjustments.

However, a large burn does not automatically indicate bullish market sentiment. The bigger picture depends on overall supply, demand, and stablecoin activity.

An interesting on-chain development worth watching.
#BTCBreaksBelow60K #GateDirectIPOPhase3ANTAllocates92100Shares
post-image
USDC+0.01%
$UNI 4.737, 24H +5.71%. 1h RSI at 77 is overbought, and volume is only 0.28x the average. Resistance at 4.789 remains unbroken. I’m watching this level closely: I’d only look higher if it holds above 4.789; if it pulls back, I’ll wait and see. Not investment advice
#UNI #Uniswap
post-image
UNI+3.05%
Load More

Join 40 M users in our growing community

⚡️ Join 40 M users in the crypto craze discussion

💬 Engage with your favorite top creators

👍 See what interests you

Trending Topics

BTCBreaksBelow60K

2.1M Views30.1K Discussing

BTC fell below $60,000 on November 20 for the first time since July, alongside a tech stock selloff and broader pressure on risk assets. Will $60K become resistance, or can BTC quickly reclaim it? What price or volume signals would convince you that selling pressure is easing?

GateDirectIPOPhase3ANTAllocates92100Shares

799.8K Views4.9K Discussing

NvidiaDropsNearly14Percent

335K Views7.6K Discussing

View More