Share your thoughts
placeholder
Article
$ZAMA Current price is 0.07744, with the nearest overhead resistance at the Bollinger upper band of 0.081591 and the first support below at the MA5 level of 0.077742; the bullish-bearish dividing line is clear.
Horizontal comparison within the same sector makes the picture clearer. Among the 24h popular assets, $SY is up 37.41% with a trading volume of 22.5M, while $ZAMA is up 39.61% with a trading volume of 36.3M—the higher gain coupled with roughly 60% more volume shows significantly stronger capital support. Technically, $ZAMA 's MA5 (0.077742) has firmly moved above its MA20 (0.0662765)
post-image
ZAMA+45.09%
WLD-0.30%
SYN+34.24%
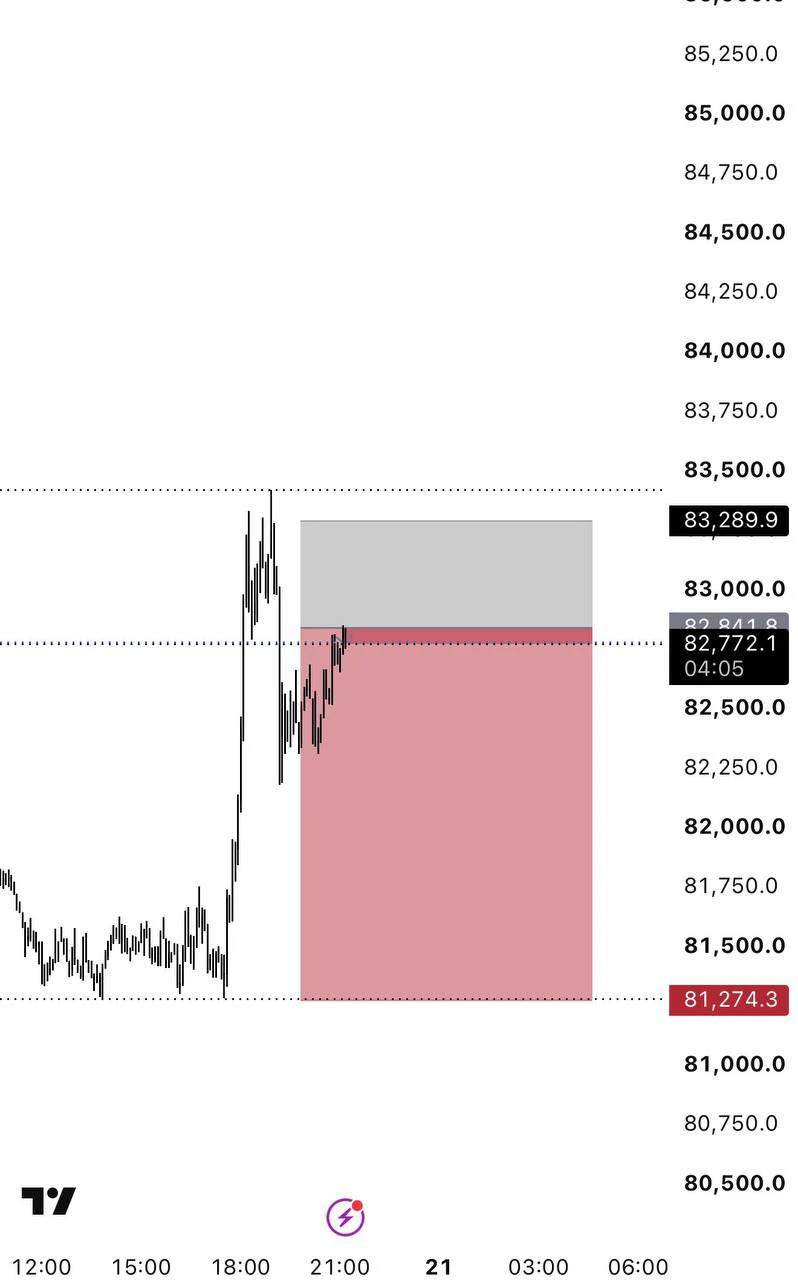
Would you long this???
#BTC
post-image
BTC+1.06%
Layout for Bitcoin, Ethereum, and Dogecoin
live-cover
LIVE3,501
  • 2
🟢 $MORPHO LONG
$MORPHO just made a powerful breakout and is trading around $2.73 after a sharp move above $2.50. Volume has expanded strongly, while the 4H MA7 is above MA25 and MA99 — momentum is clearly strong.
I wouldn’t chase the spike here. I’d watch a pullback into $2.60–$2.68 and look for buyers to defend it.
Entry: $2.60–$2.68
TP1: $2.81
TP2: $2.95
TP3: $3.15
SL: $2.48
The key is $2.81. A clean break and hold can open the next leg higher; losing $2.48 weakens this setup.
#MORPHO #TradingSignal
$MORPHO ‌
post-image
MORPHO+11.22%
🇫🇷 11% OF FRENCH GAS STATIONS RUN OUT OF FUEL!
Fuel runs out at 11% of pumps in France, diesel reaches near a record high of €2.38/L.
President Macron called an emergency meeting, preparing financial aid for long-distance drivers.
$SYN SYNUSDT Forming Bullish Momentum
SYNUSDT is forming a clear bullish momentum pattern, a classic bullish reversal signal that often indicates an upcoming breakout. The price has been consolidating within a narrowing range, suggesting that selling pressure is weakening while buyers are beginning to regain control. With consistent volume confirming accumulation at lower levels, the setup hints at a potential bullish breakout soon. The projected move could lead to an impressive gain of around 190% to 200% once the price breaks above the wedge resistance.
This bullish momentum pattern is typic
post-image
SYN+34.24%
#Gate广场中秋团圆局 Bitcoin’s move above $81,000 is not just a price breakout. Three different data streams are now moving together: $577M of combined spot ETF inflows, a fresh CFTC regulatory filing that adds another institutional-market catalyst, and miner selling that shows supply-side behavior remains active. The key for the next phase is whether demand can continue absorbing available supply at higher prices.
① ETF flows have turned into a major demand signal. On September 18, U.S. spot Bitcoin ETFs recorded $433M of net inflows, while Ethereum spot ETFs added another $144M, bringing the combine
post-image
BTC+1.06%
ETH+2.52%
BLK+1.45%
Watching the charts nonstop got annoying; once I turned them off, I could see things more clearly. With my eyes off the screen, my heart wasn’t as anxious either. A few days ago in the afternoon, $ONE stayed in a bottom-range consolidation for a long time, then held firm after a pullback. The feeling that funds were quietly entering was obvious, so I suggested that longs could be added gradually.

During the repeated intraday swings, many people were shaken out, but I chose to hold a little longer. Entered at 0.000713, now at 0.002392, with an unrealized gain of +4640.07%. Nailed the rhythm—
post-image
ONE+69.03%
SNDK+4.28%
ETH+2.54%
Range-bound $CL /USDT is about to break which way, and why smart money is already positioned for the downside.

$CL /USDT - SHORT

Trade Plan:
Entry: 96.02 – 96.20
SL: 96.97
TP1: 95.46
TP2: 95.03
TP3: 94.38

Why this setup?
Why now? The daily trend is range, but the 1h price is holding at 96.11 with a 15m RSI of 61.47, signaling weakening momentum despite the bounce. The 1h ATR of 0.359802 confirms enough volatility to push through the entry zone between 96.02 and 96.20, making the short setup valid. If $CL /USDT breaks the entry low, TP1 at 95.46 and TP2 at 95.03 become realistic targets,
CL-2.08%
Long $BR
is holding a fairly solid structure, so this setup could be watched for a long on wave 2 if the price continues to hold the support zone below.Entry 1: 1.0230 – 1.0240 (current entry zone, following the price-holding momentum)Entry 2: 0.9720 – 0.9730 (nearby support retest zone)Entry 3: 0.9300 – 0.9310 (deeper support zone, good for adding if there is a shakeout)Take Profit:TP1: 1.0800TP2: 1.2000TP3: 1.3980Stop Loss: 0.8800BR currently has a fairly solid bullish recovery structure after the BOS. If it holds the 0.9720 area, there is a good chance it will continue wave 2 upward to ret
post-image
BR+20.96%
The Fed Just Hiked, and the Odds of Another 25bp Hike in October Have Already Risen to 49.8! As expe
live-cover
LIVE2,186
#美股AI概念股全线反弹 + #Gate广场中秋团圆局
AI STOCKS ARE BACK IN FOCUS — BUT IS THIS THE START OF A NEW LEG OR JUST A RELIEF RALLY?
The U.S. technology market has entered another important phase. After a sharp wave of volatility triggered by the Federal Reserve’s latest rate decision and renewed concerns around AI valuations, artificial-intelligence and semiconductor stocks bounced strongly.
On Sep 17, the Nasdaq Composite jumped around 1.7%, while the S&P 500 gained roughly 1.1%. Semiconductor stocks were among the strongest performers, with the Philadelphia Semiconductor Index rising about 3.3%. Nvidia, A
CryptoChampion
#美股AI概念股全线反弹 + #Gate广场中秋团圆局
AI STOCKS ARE BACK IN FOCUS — BUT IS THIS THE START OF A NEW LEG OR JUST A RELIEF RALLY?
The U.S. technology market has entered another important phase. After a sharp wave of volatility triggered by the Federal Reserve’s latest rate decision and renewed concerns around AI valuations, artificial-intelligence and semiconductor stocks bounced strongly.
On Sep 17, the Nasdaq Composite jumped around 1.7%, while the S&P 500 gained roughly 1.1%. Semiconductor stocks were among the strongest performers, with the Philadelphia Semiconductor Index rising about 3.3%. Nvidia, AMD, Micron and other AI-related names helped lead the recovery.
But for me, the most important question is not simply whether AI stocks are rising again.
The bigger question is:
CAN THE FUNDAMENTALS SUPPORT ANOTHER SUSTAINED MOVE?
1. AI Demand Has Not Disappeared
The strongest argument behind the AI market remains real infrastructure demand.
AI development requires enormous amounts of computing power, advanced semiconductors, high-speed networking, memory, data centers and electricity. That creates a much broader investment cycle than simply buying shares of one AI software company.
Recent developments continue to show that companies are committing significant resources to AI infrastructure. Nvidia CEO Jensen Huang has also pointed to continued strong demand for AI computing, while the broader infrastructure ecosystem continues expanding.
This means the AI story is increasingly connected to physical infrastructure rather than only market hype.
2. Interest Rates Are Still the Major Risk
At the same time, investors cannot ignore the macro environment.
The Federal Reserve recently raised its benchmark rate by 25 basis points to 3.75%–4.00%, its first hike in more than three years, while signaling the possibility of another increase this year.
That creates an important challenge for high-growth technology companies.
When Treasury yields remain elevated, the future cash flows of high-valuation companies become more sensitive to discount rates. On September 18, the 10-year Treasury yield moved back toward 5%, showing that financial conditions remain restrictive.
So even when AI fundamentals remain strong, valuations can still experience sharp swings.
3. The Rebound Needs Confirmation
Another important factor is market breadth.
The recent recovery was powerful, but one or two strong sessions do not automatically establish a long-term trend.
For me, the next phase should be watched through several signals:
AI semiconductor leadership
Data-center spending
Corporate AI investment
Treasury yields
Oil prices
Earnings expectations
Market breadth and trading volume
If these factors improve together, the rebound could develop into a broader technology recovery.
If yields rise again while AI spending expectations weaken, the market could return to a more defensive setup.
My Market View
I see the current environment as a battle between AI structural growth and macro valuation pressure.
The AI infrastructure cycle remains one of the most important themes in global markets, but investors are also dealing with higher interest rates, elevated bond yields and volatile energy prices.
That makes confirmation more important than chasing a single green session.
The next move in AI stocks may therefore depend less on headlines and more on whether real corporate spending, earnings growth and infrastructure demand continue validating the enormous expectations already built into the sector.
For Gate Square, this is exactly the type of market environment worth discussing during the Mid-Autumn season: different markets, different narratives, but one common question — what is actually driving the next move?
#GateSquare #weeklyshare #ShareWeekly @Gate_Square
repost-content-media
SPX500+0.45%
INDEX-12.00%
NVDA+1.23%
AMD+2.76%
MU+3.80%
Everyone is calling ENA a buy but the shorts are building a massive trap.

$ENA /USDT - SHORT

Trade Plan:
Entry: 0.19620 – 0.19926
SL: 0.21682
TP1: 0.18342
TP2: 0.17387
TP3: 0.15956

Why this setup?
Why now? The 1h price is hovering at 0.19768 inside a narrow entry zone between 0.19620 and 0.19926, setting up a precise short setup. The 15m RSI sits at 63.92, showing enough momentum to push toward the first target of 0.18342 without hitting exhaustion. With the 1h ATR at 0.006117, the expected volatility supports a clean move to TP2 at 0.17387 before any meaningful reaction. The daily trend
post-image
ENA+21.11%
JUST IN: A ZEC whale has about $10M in unrealized gains from a ~9.81k ZEC long opened a month ago at $517.68; current price around $1,534.70. The same holder also flags a $2.6M loss on a 3,550 ETH short. $ZEC $ETH
post-image
ZEC+2.95%
ETH+2.54%
#SECApprovesLimitedOnChainTradingOfTokenizedStocks
#gStocksTokenizedStocksLive
gStocks Tokenized Shares Live Trading Now Available on Gate.com
A revolutionary step in the global crypto market has been officially announced by Gate.com with the launch of live trading for tokenized shares on their gStocks platform. This service marks the beginning of a new era for investors and traders where the boundaries between traditional stock markets and the crypto world have been dissolved. Now you can buy and sell digital shares of the world's largest companies directly using USDT.
What is gStocks and H
post-image
AAPLX+0.52%
TSLAG-0.34%
NVDAG+1.32%
GOOGLG-0.25%
METAG-0.77%
$NVDA
NVDA PRICE ACTION
$NVDA is showing a constructive intraday recovery after initially dropping to 218.03 dollars and then rebounding strongly to 222.08 dollars.
The stock opened around 219.35 dollars and reached an intraday high of 222.73 dollars. It is currently trading near the upper end of the session range, showing that buyers managed to recover most of the early weakness.
After hours, NVDA is around 222.51 dollars, keeping the price close to the session high.
VWAP RECLAIM
The key development in the intraday structure was the recovery back above VWAP.
NVDA dipped toward 218.03 dollars
post-image
NVDA+1.23%
#btc Amiya’s final reminder: one last time, have you not seen what happened with Myanmar A?
post-image
BTC+1.06%
#ShareWeekly #WeekendMarketBullishOrBearish
This weekend I am starting from a market that took three separate shocks in five days and still closed the week roughly where it opened, and that single fact is the reason I am not bearish going into Saturday and Sunday.

Bitcoin's seven days, session by session, because the path matters more than the destination. BTC began the week around $77,300 and traded a range of roughly $75,000 to $79,538. Monday, September 14, it gained about 1.75% and closed near $78,185 after tagging that weekly high. Tuesday, September 15, was the break, down about 3
post-image
you’re here.
keep creating
keep building
keep showing up
keep going.
post-image
Smart money is quietly stacking shorts on $XAU /USDT while you are still waiting.

$XAU /USDT - SHORT

Trade Plan:
Entry: 4381.75 – 4384.69
SL: 4397.37
TP1: 4372.61
TP2: 4365.54
TP3: 4354.93

Why this setup?
Why now? The 4h trend is range bound, which often precedes a sharp directional breakdown. The 1h ATR of 5.89 confirms enough momentum to reach the first target. The 15m RSI at 59.81 shows room to drop before oversold, supporting a move toward 4372.61. Entering near 4383.22 gives a clean risk reward, with the invalidation level at 4369.76 acting as the line in the sand.

Debate:
Are we
XAU+0.54%
Load More

Join 40 M users in our growing community

⚡️ Join 40 M users in the crypto craze discussion

💬 Engage with your favorite top creators

👍 See what interests you

Trending Topics

JapanRealEstatePowerChipStocksRise

59.52k Views4.39k Discussing

Japan's Nikkei extended gains on Sept 18, with real estate, power, and semiconductor sectors leading. Gate covers over 12,800 global stocks and ETFs, offering one-stop USDT trading across US, HK, Korean, and Japanese markets. [👉 Read more](https://www.odaily.news/en/newsflash/518749)

USAIConceptStocksRally

34.17k Views950 Discussing

GateTopsStockPerpetualCoverage

38.45k Views2.56k Discussing

View More