Share your thoughts
placeholder
Article
$TSLA ‌TSLA shares are trading down 6.36% at $352.41 in intraday trading. The daily trading range is between $351.34 and $364.68, with the stock opening at $362.07. The company, which closed at $376.35 yesterday, has a total market capitalization of $1.39 trillion ($1,391.74 billion), and its Price/Earnings (P/E) ratio is recorded at 325.54.
In terms of technical indicators, short-term moving averages show the pressure on the price and potential support levels. The MA5 level at $361.95 and the MA10 level at $355.80 are forming resistance just above the current price, while the MA30 level at $
TSLA-5.80%
  • 1
Pressed “Buy” on an exchange for the first time and had zero clue what I was actually asking it to do.
Convert? Market order? Limit order?
They all just… buy crypto. Right?
Not exactly. Each one tells the exchange to do something different.
post-image
BITCOIN'S GOLDEN CROSS IS HERE. 👀🔥
Historically, this setup has preceded some HUGE moves.
But is $100K guaranteed?
Absolutely not.
The Golden Cross has appeared 12 times since 2012. Some produced massive rallies:
📈 2012: +306%
📈 2020: +312%
The average 3-month gain across nine signals was 24.9%.
But there's a catch…
Only 3 of 12 signals remained intact for a full year without a Death Cross.
WHY $100K IS BACK ON THE TABLE:
🔹 Strong institutional ETF demand
🔹 $3.5B+ in August Bitcoin ETF inflows
🔹 USDT dominance potentially forming a Death Cross
🔹 Capital potentially rotating into risk a
post-image
BTC-2.21%
Gold | Recruitment Notice
The market is always there; what’s missing is timing.
Chasing rallies and selling dips, holding oversized positions through losses, and repeatedly getting shaken out in sideways markets—this is the reality for most retail traders. It’s not that they can’t read the market; they can’t hold on to profits. Once their mindset falls apart, no strategy can help.
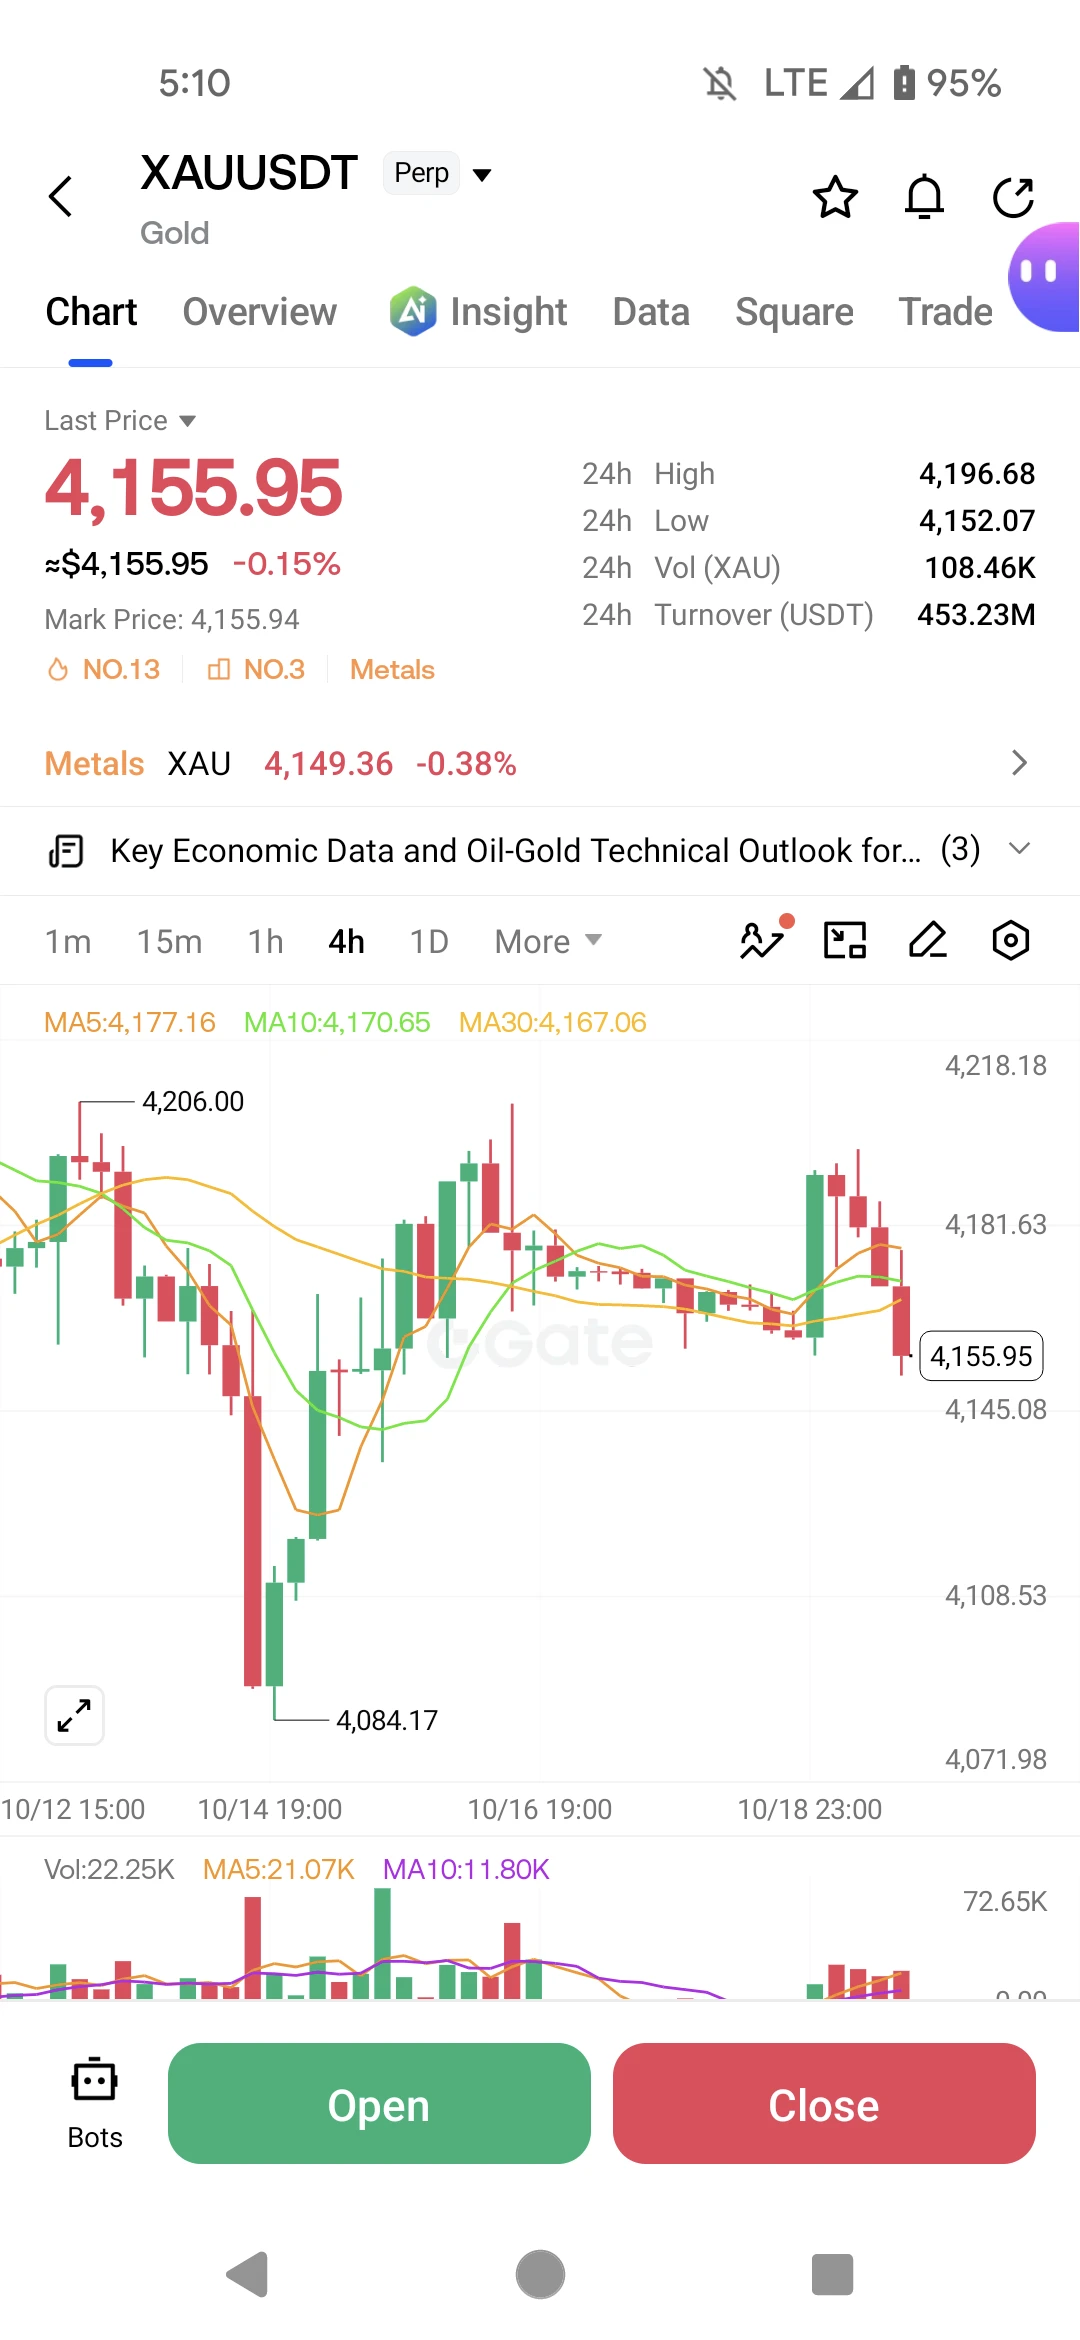
Nanci focuses on swing trading precious metals, with three core principles: follow the trend, control position sizes, and wait for certainty. Trades are entered only when fundamentals and technicals resonate. No bett
post-image
GLDX-1.00%
PAXG-1.01%
Market updates BTC
live-cover
LIVE1,460
I was just about to start cursing, but then I looked at my balance and let it go—the market is always right. Shortly after the market opened this afternoon, $PLAY ’s rebound lacked momentum, with every upward push falling just short and volume failing to follow at all. This kind of movement is a classic bull trap. I gave a reminder: Don’t rush to buy the dip—no one is there to catch it on the way up. Sure enough, after grinding from 0.08210 to 0.03512, +567.54% is now in the bag. That was a really satisfying bite of meat. Feels great—the guys on board should be waking up laughing, right? I’ve h
post-image
PLAY-6.15%
XRP-4.50%
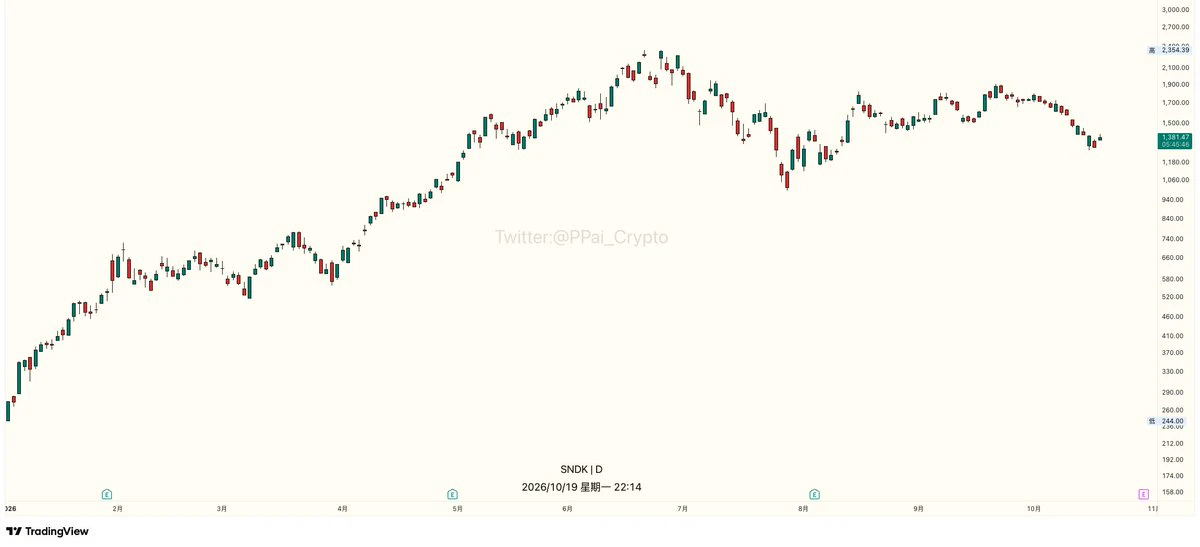
SNDK+10.83%
$ZEC and $XRP are showing strength. But is altseason really starting?
I’d be careful with that conclusion.
The important signal isn’t two coins outperforming. It’s whether capital starts rotating across a wider part of the altcoin market.
#BTC ’s pullback after stronger U.S. jobs data adds another layer to the move, with higher Treasury yields putting pressure on risk assets.
So the real test from here is simple:
Does the strength broaden?
More altcoins outperforming BTC + stronger volume + deeper liquidity would make the rotation much more convincing.
Until then, I see this as selective str
post-image
ZEC+5.46%
XRP-4.48%
The first time I bought stocks with USDT, I checked three times
Last year, when I first bought U.S. stocks on Gate, I felt particularly uncertain—buying Apple stock with USDT? Is this legal? Is it reliable?
I checked the order three times, then went to read Gate's official announcement to confirm that this was a legitimate stock trading service. Only then did I nervously click “Buy.”
Only later did I learn that Gate's U.S. stock trading has zero fees and supports fractional shares, with purchases starting at just 0.01 share. Being able to become a shareholder of Apple or Tesla with just a few
NAS100+0.06%
Everyone’s staring at NEAR’s breakout, but the real trade is hiding in the 4h candle that just armed itself.

$NEAR /USDT - LONG

Trade Plan:
Entry: 2.0117 – 2.0319
SL: 1.9247
TP1: 2.0946
TP2: 2.1432
TP3: 2.2161

Why this setup?
Why now? The 1D trend is bullish, and the 4h MTF just triggered a LONG with 95% confidence.
- RSI 15m at 67.96—momentum is hot but not exhausted.
- Entry zone: 2.0117–2.0319, with TP1 at 2.0946 and TP2 at 2.1432.
- Stop at 1.9247 keeps risk tight while the ATR (0.0405) supports a clean move.
- Alt setup? Only if price flips below 1.8680—that’s your invalidat
post-image
NEAR+3.65%
$DRAM notable breakout
post-image
DRAM+5.64%
How it feels trading on solana rn 🚶🏾‍♂️
post-image
SOL-3.47%
I just switched the app to the background, and it shot right back up—are you playing hide-and-seek with me?
During the repeated intraday swings, $GWEI someone caught every dip. The bottoming range dragged on until I couldn't stand it anymore, so I finally opened a position at 0.024291, planning to exit if it broke down.
Then it climbed all the way to the current 0.025167, delivering a +36.24% return. All that waiting paid off! It had been moving as slowly as an old lady walking, but once it got going, it was really fast.
I’ve taken 80% off the table and moved the stop-loss on the remaining 20
post-image
GWEI+2.61%
SNDK+10.83%
ADA-4.01%
Everyone’s bragging about ZEC’s 1D trend—but my 4h chart just whispered a secret that 84% of traders missed.

$ZEC /USDT - SHORT

Trade Plan:
Entry: 1018.21 – 1032.15
SL: 1112.14
TP1: 959.96
TP2: 916.48
TP3: 851.26

Why this setup?
- The daily trend says “bullish,” yet the 4h setup is screaming SHORT with 84% confidence.
- Price is stalling near 1025.18, right under the 1h ATR of 27.87—a classic squeeze zone.
- RSI on the 15m (60.45) shows fading momentum, not a breakout spark.
- Why now? The “Waiting” status means the trap is set: a drop to TP1 (959.96) is a 6.4% move before the dail
ZEC+5.36%
🔹Oil Rally Pauses, U.S. Stocks Snap a Three-Day Losing Streak! Inflation Fears Ease, How Much Longe
live-cover
LIVE791
I was just about to go to the forum and rant, but then I saw my balance. Never mind—the market is always right.

While everyone else was running, $RIVER was bouncing quite vigorously instead, but every bullish candle felt hollow underneath. The more I looked, the more it seemed like a heavy bull trap. I warned about it at the time: this kind of rebound is the last bit of dignity for those who failed to get out earlier, not a reason for you to enter. So I opened a short, entering at 6.705.

Looking at it now, the price has already been dragged down to 1.261, +1598.68%, a huge bite of profit.
post-image
RIVER-3.59%
XRP-4.50%
DOGE-5.19%
Tether ($USDT ) — 2014
USDT: Bringing Dollar Stability Into Crypto
Tether launched its first USD-pegged token in 2014, creating one of the earliest major stablecoins in the cryptocurrency industry.
Unlike assets such as BTC and ETH, USDT is designed to maintain a value close to the U.S. dollar rather than generate price appreciation.
USDT became extremely important for crypto trading because it allows users to move dollar-denominated value across blockchain networks without leaving the digital-asset ecosystem.
Today, stablecoins are an important bridge between traditional finance and cryptocur
post-image
USDT0.00%
  • 10
  • 2
Everyone’s staring at ADA’s breakout—but the 4h tape is quietly screaming lower.

$ADA /USDT - SHORT

Trade Plan:
Entry: 0.2119 – 0.2137
SL: 0.2212
TP1: 0.2065
TP2: 0.2023
TP3: 0.1960

Why this setup?
Why now? The daily is stuck in a range, yet the 4h structure is armed for a SHORT at 0.2128 with only 55% conviction—meaning the path of least resistance is down, not up.
- RSI on the 15m is already at 42.5, losing momentum before any bounce.
- ATR on the 1h is tight (0.0035), so the drop to TP1 (0.2065) is a clean 3% ride if 0.2095 breaks.
- If bulls can’t reclaim 0.2137 fast, this is a
ADA-4.01%
SpaceX (SPCX) stock is trading at $148.53, experiencing a limited pullback of 0.79% in intraday trading. The daily range is a narrow 2.35%, with the price testing a low of $147.32 and a high of $150.84 during the day. The asset, which started the day at $148.59, is currently trading slightly below its previous closing level of $149.72. Market capitalization remains at $1,957.75 billion, while the Price/Earnings (P/E) ratio is at -221.081.
Technical indicators show that moving averages are providing short-term support to the price from below. The MA5 level is at $144.99, the MA10 level is at $1
SPCX-0.34%
  • 1
  • 1
From “only buying crypto” to “buying everything,” it took just one year
When I registered with Gate last year, my understanding was very simple: an exchange was a place to buy crypto.
But over the past year, I’ve realized that Gate stopped being just an “exchange” a long time ago. In the second quarter of this year, the platform already supported more than 12,500 stocks and ETF assets. U.S. stocks, Hong Kong stocks, South Korean stocks, and Japanese stocks—all four major markets are available in one account. Japanese stocks were also launched in August, with the first batch covering major name
SNDK+10.06%
Load More

Join 40 M users in our growing community

⚡️ Join 40 M users in the crypto craze discussion

💬 Engage with your favorite top creators

👍 See what interests you

View More