



Square
Following
Hot
News
Notifications
Profile
Share your thoughts
placeholder
Article
$BULLA pulled off a great trade. Glad to walk away with a profit. ROI: 90% Amount: 847 USDT Popular names: $NAORIS : Current price 0.03569 - 24-hour change: +15.69% $XRP : Current price 0.9311 - 24-hour change: +1.99%
post-image
BULLA+10.92%
NAORIS+0.66%
XRP-1.15%
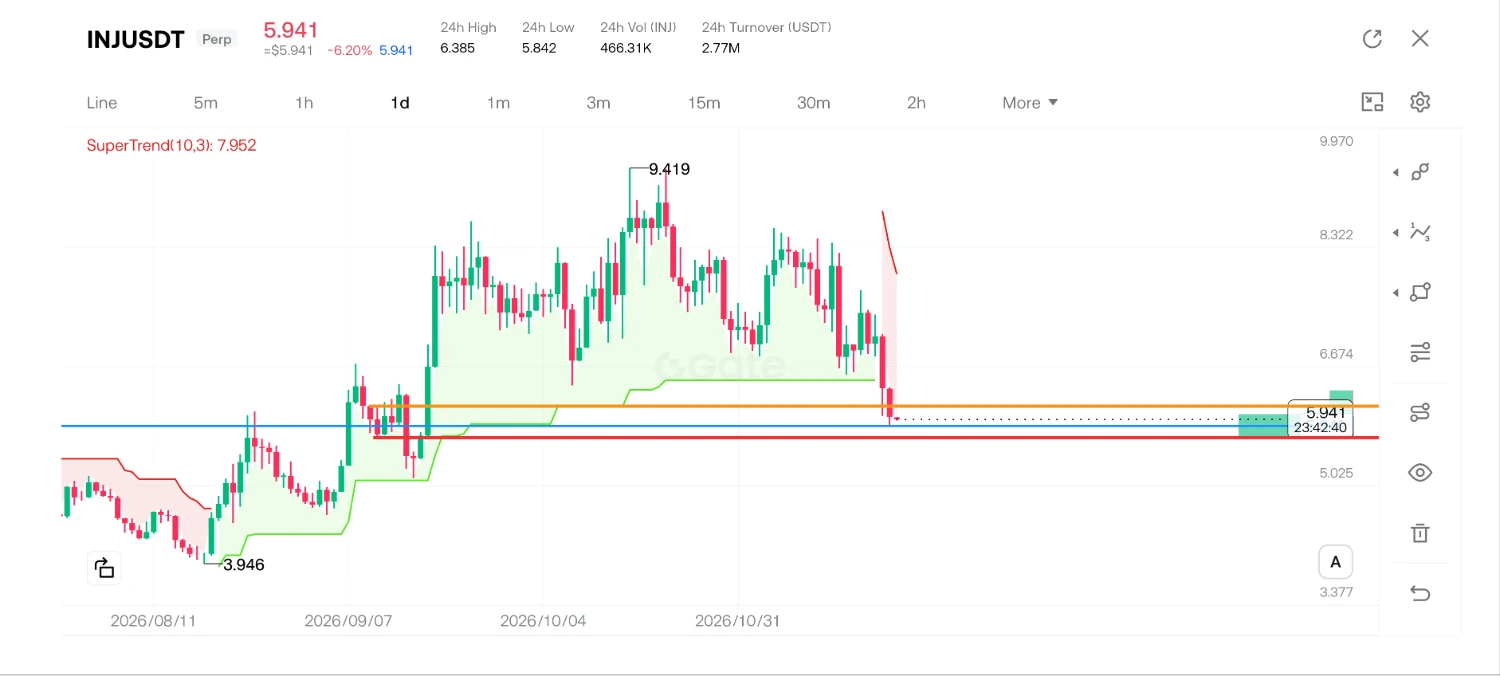
$INJ ‌
⏳If my calculations are correct, the candle will close bullish today.
✅ I am adding to my long position today.
post-image
INJ-1.67%
Trenches
IDOL
I
bade
b
IDOL
0x3b...ab07
Market Cap
$.
Change
.
24h Vol
$.
Holders
.
PIEVERSE
P
bade
b
PIEVERSE
0x0e...25a9
Market Cap
$.
Change
.
24h Vol
$.
Holders
.
FIONA
F
bade
b
FIONA
B34n...pump
Market Cap
$.
Change
.
24h Vol
$.
Holders
.
CLAUDIA
C
bade
b
CLAUDIA
2j5S...W2ZM
Market Cap
$.
Change
.
24h Vol
$.
Holders
.
Singularity
S
bade
b
Singularity
7R4M...pump
Market Cap
$.
Change
.
24h Vol
$.
Holders
.
#英伟达单日重挫近14%
Nvidia closed down 13.8% on November 20, while the Nasdaq Composite fell 5.28%. Despite reporting strong earnings, the market is repricing the AI sector due to ongoing concerns over heavy capital spending, stretched valuations, and return on investment.

Here is a technical breakdown of the price action based on the provided charts:

Daily Chart (1D): The asset has experienced a severe breakdown, falling from a high of 243.42 down to the 125 area. The price is trading significantly below the 5, 10, and 30 moving averages. The MACD is deeply negative, and the OBV shows a clear dow
NVDA-13.84%
NDAQ-0.95%
$UNI ’s 5.74% rebound, from 4.18 to 4.78 in a single day, isn’t just a crypto story. Last Friday, the U.S. reported core PCE at 0.2% month over month, below expectations, and the dollar index weakened on the spot. That was the first turn of the faucet. The effect reaches crypto through two steps: a weaker dollar and falling Treasury yields. Money first flows into high-beta tech stocks, then spills over into crypto, at the far end of the risk curve. So $UNI ’s move isn’t independent; it’s following the rhythm of Nasdaq futures.
Looking at the structure, the 4.18 low was carved out as U.S. stocks
UNI+3.05%
  • 1
  • 2
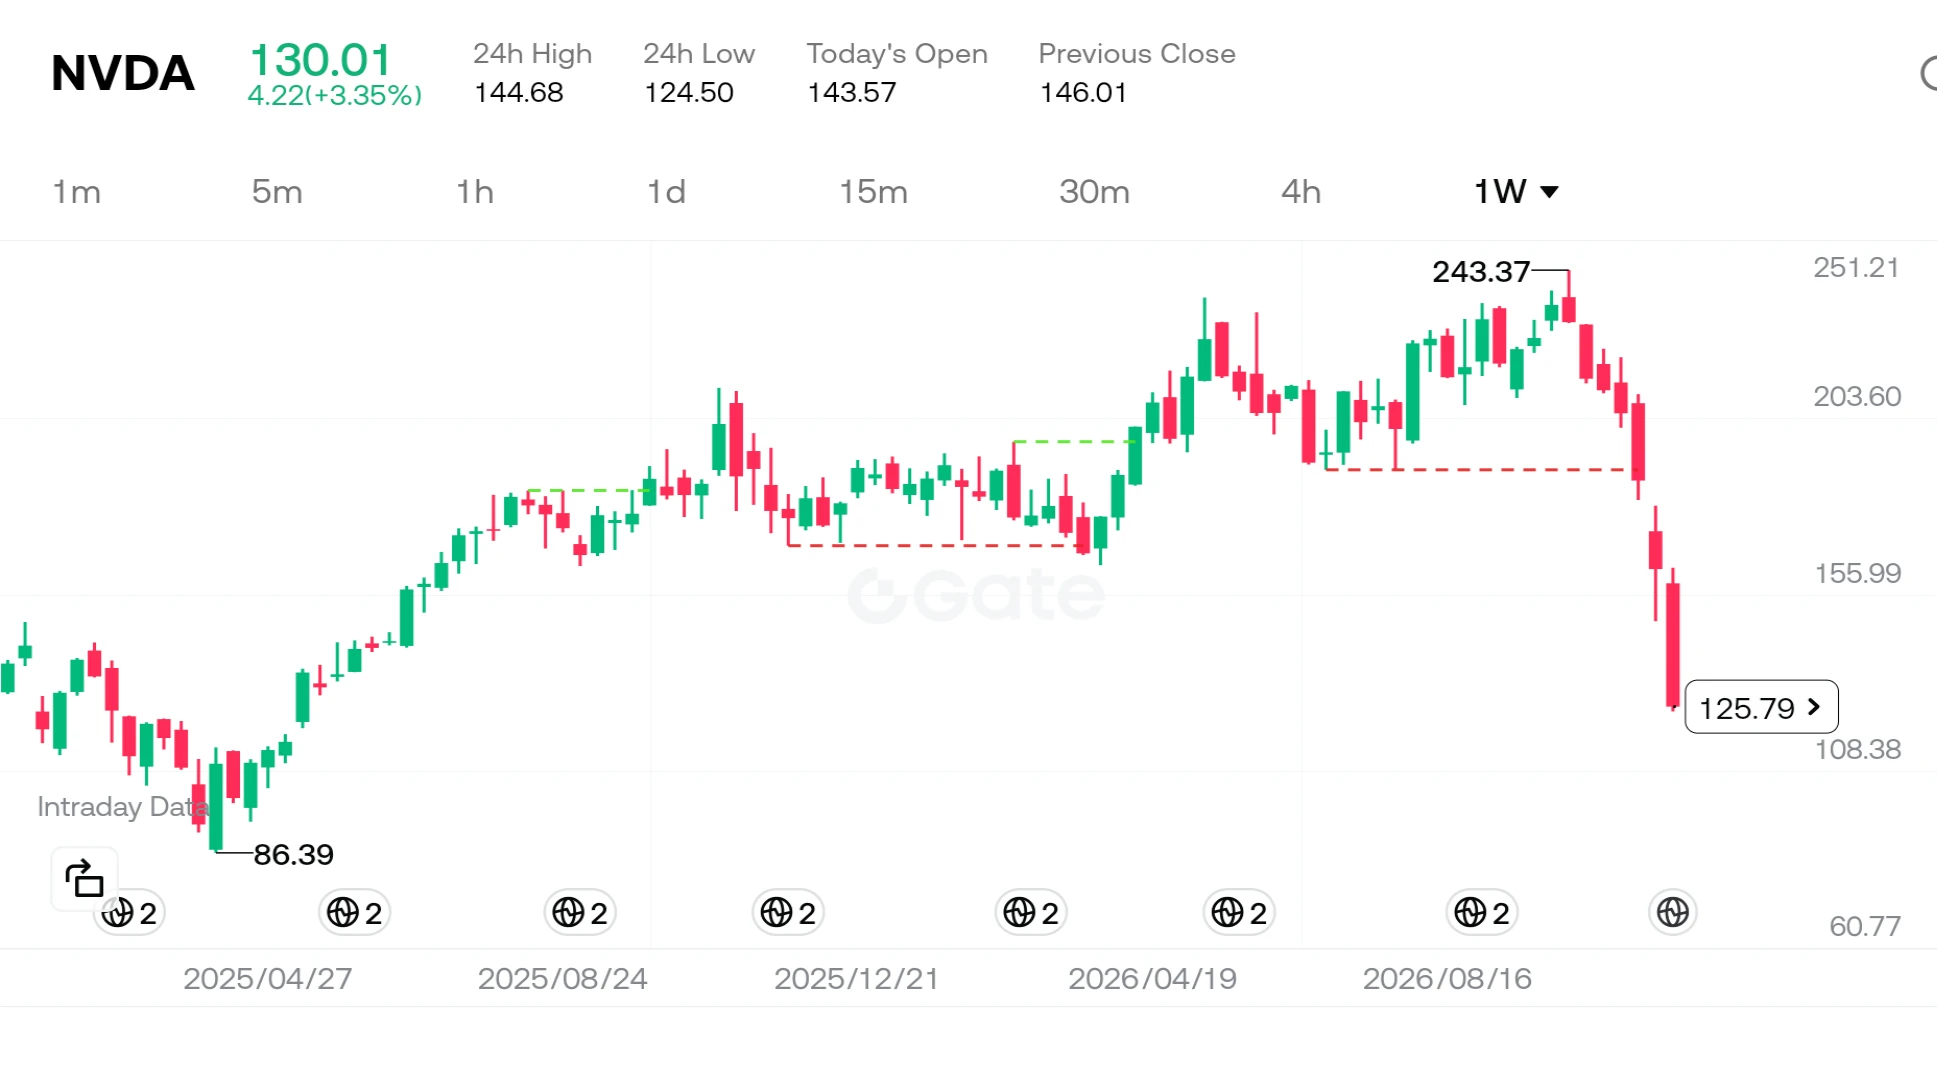
Nvidia shares failed to bring any cheer to investors, slipping to the $130 level in weekend trading. The sharp decline from the stock's peak of $243 can no longer be dismissed as a mere "market correction." The formal investigation launched by the U.S. Securities and Exchange Commission (SEC) into the company’s accounting practices has served as the primary catalyst for this downturn.

So, what does this investigation signify, and why has it shaken the stock price so profoundly?

Looking first at the company itself: as the driving force behind the artificial intelligence revolution, Nvidia has
post-image
User_any
$NVDA ‌
Nvidia has been losing ground for seven consecutive weeks—a trend not seen since 2008. The stock plummeted 14% last Friday alone, bringing its total decline over this seven-week period to approximately 46%. As clearly illustrated on the chart, the price has retreated from a peak of $243 to the $125 range. So, what is the story behind how this once-most-valuable company reached this point?
In reality, this is not merely a stock market correction; it is the result of three major, intersecting storms hitting the same vessel.
First, let’s look at the company’s internal dynamics. Uncertainty within management following a CEO transition, combined with the SEC’s decision to investigate the company’s accounting practices, has severely shaken market confidence. But that is not the whole story. The massive scale of spending on artificial intelligence has led investors to ask: "So much money is being spent—but when will we see a return?"
Meanwhile, macroeconomic headwinds have also shifted. Minutes from the Federal Reserve’s meetings indicate that nearly all officials expect interest rate hikes to continue. A high-interest-rate environment exerts significant pressure on growth stocks, which are valued based on their projected future cash flows. This situation has impacted not only Nvidia but the S&P 500 as well; the index fell 8.6%, marking its worst week since April 2025 and pushing it into correction territory.
Even the major Anthropic IPO that took place last week was not enough to halt this wave of selling. For many analysts, this situation serves as proof that the market is no longer focused on "new narratives," but rather exclusively on "cash flow and profitability." The fact that gold and silver have fallen to their lowest levels in over a year, combined with oil’s decline for the third consecutive week, highlights just how fragile risk appetite has become. Investors have effectively "retreated to their corners."
The most important lesson for individual investors here is that, regardless of how strong a company’s operational performance may be, macroeconomic headwinds and management uncertainties can fundamentally shake its valuation. Nvidia’s core business model remains robust, yet the market is currently pricing in risks rather than the company’s growth story. In times like these, the wisest approach is to avoid leverage and—instead of attempting to call the "bottom"—wait for prices to stabilize.
Do you believe this decline in Nvidia presents a long-term investment opportunity, or are we witnessing the deflation of an artificial intelligence bubble?
#Nvidia #Macro #TechStocks
#ShareWeekly #WCTCS9
Not investment advice.
repost-content-media
NVDA-13.84%
  • 2
  • 2
Time to suit up.
My profile picture really isn’t AI-generated.
post-image
$UNI 4.737, 24H +5.71%. 1h RSI at 77 is overbought, and volume is only 0.28x the average. Resistance at 4.789 remains unbroken. I’m watching this level closely: I’d only look higher if it holds above 4.789; if it pulls back, I’ll wait and see. Not investment advice
#UNI #Uniswap
post-image
UNI+3.05%
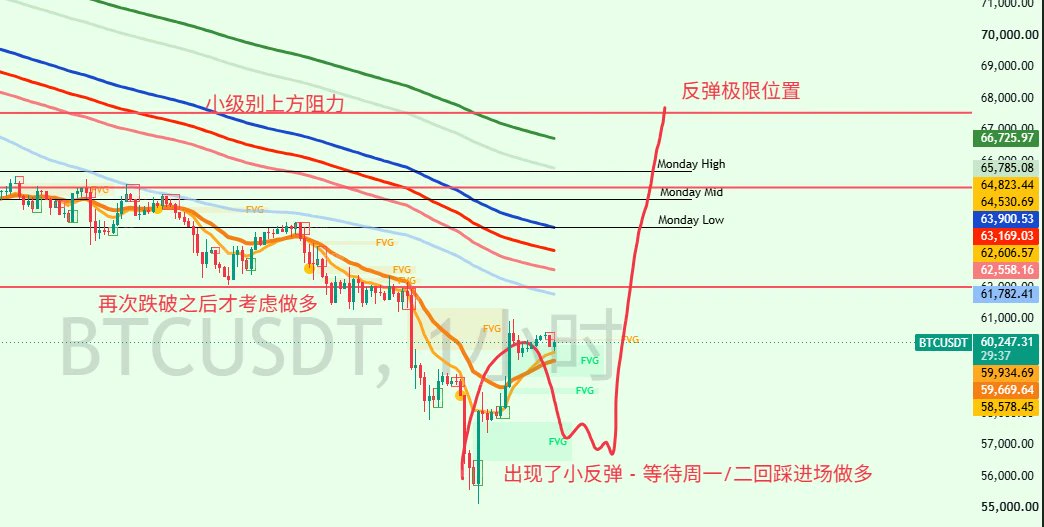
BTC Market Outlook
Wait for a Pullback to Go Long
After two weeks of waiting, we’re finally nearing a bottom, and the market has seen its first rebound of around 10%—though it was only 5,000 points, it’s still encouraging
Many believe BTC will continue falling below 48,000. I don’t rule out that possibility, but I also think the market will rebound next Monday or Tuesday. At the very least, “there’ll be a rebound to trade”
This rebound is in sync with the rebound I expect in U.S. stocks
After the VIX rose on Friday, I think U.S. stocks will continue falling until intraday Monday or before the
post-image
BTC-0.67%
  • 3
MARKET PREDICTION
live-cover
LIVE1,407
ETH-1.23%
BTC-0.65%
Good morning, Zuo Zuo kept an eye on the crypto market all weekend for you ☕
Early Saturday morning, $BTC got knocked flat in the ring: a low of 55,130, its lowest in more than two years (since September 2024)
Then it got back up on its own: up about 9%, now back above 60,000, around 60,250 at 06:30 Taipei time
The cost of that fall 👇
About 1.8 billion dollars liquidated in 24 hours, including 1.3 billion in long positions
Realized losses hit 11.3 billion dollars in one week, 8 times the profits over the same period
Spot BTC ETFs saw about 1.1 billion dollars in net outflows in one week
The
post-image
BTC-0.67%
Woman Killed After Reuniting With Boyfriend She Accused of Rape—Reality Is More Bizarre Than Short Dramas!
After the couple had sex, the woman accused the man of rape. After he was arrested, their families discussed compensation and a dowry arrangement. The woman initially asked for 300k yuan, then lowered the amount to 180k yuan, while the man's family was only willing to pay 50k yuan. Negotiations broke down.
The man was sentenced to three years in prison. While he was serving his sentence, the woman repeatedly expressed how much she missed him. After his release, she went out of her way to
Trending: $LUNC .
While the rest of the market is bleeding out and hitting 6-month lows, the Terra Classic army is waking up.
The community never left. The burn keeps running.
We are trending for a reason. 🐻🔥
post-image
LUNC-2.74%
$MITO This coin's about to moon—grab some
post-image
MITO+8.51%
Gold drawdown exceeds −37%
BTC drawdown exceeds −58%
Silver drawdown exceeds −67%
Nasdaq drawdown exceeds -18%
Shanghai Composite drawdown exceeds −17%
So why do you always enter during booms and exit during depressions?
10 classic books to help you understand economic cycles
The economy moves through cycles like the changing seasons: boom, recession, depression, and recovery. Credit, inventories, and technological innovation jointly drive these fluctuations, while asset price movements are an external reflection of the cycle.
What is an economic cycle? It is the wave-like fluctuation of the m
post-image
GLDX-0.40%
PAXG+0.37%
BTC-0.67%
XAG+0.47%
NAS100-0.07%
$VANA Short sellers are going all out, and the market has already sent a clear signal.
Short setup reference: Entry zone: 0.58440–0.58551 First target: 0.57886 Stop-loss level: 0.58994
The key change is that $VANA has broken below the 0.58840 support level, and the next 15-minute candle continued to weaken. As long as selling pressure holds, watch 0.57886 and 0.57331 in sequence to the downside, with a deeper level at 0.56777.
$MMT $PIEVERSE are also worth watching.
Risk warning: The above is market analysis only and does not constitute investment advice. Contract trading is extremely risk
post-image
VANA-4.27%
MMT-2.35%
PIEVERSE+0.58%
VVV | Long 🟢 | Bullish | 15-minute, 24-hour: +19.37% | Volume: 78.6M USDT. Long rationale: Price is above EMA200; EMA20/50/200 are in bullish alignment; RSI14 is 71.8; MACD histogram is positive; ADX14 is 39.2; volume is 0.97 times the 20-candle average; trend pullback/continuation. Entry: 24.822 Stop-loss: 23.734 Take-profit 1: 26.1819 | Take-profit 2: 26.9979 | Take-profit 3: 28.0859. Entry levels are for reference only; do not chase prices. The strategy is invalidated if the stop-loss level is hit. This is a technical analysis strategy only and does not constitute financial advice. $VVV
post-image
VVV+0.37%
  • 1
market update and trading signal with sheen crypto
live-cover
LIVE2,509
BTC-0.67%
ETH-1.26%
SOL-0.77%
Lao Hei is clearly putting his own skin in the game with this trading call $VVV ! The project is also currently offering open-source models at half price, and if they sell well, 40 will probably be coming soon too!
post-image
VVV+0.37%
#BLESS #WCTCS9 #ShareWeekly
BLESS RICE ANALYSIS: Is This a Genuine Recovery or Another Bull Trap? Key Levels, Market Momentum, and Trading Opportunities

BLESS is entering a critical phase where both bulls and bears have strong reasons to remain active. After a powerful weekly recovery followed by a sharp daily correction, the market is presenting an important question: are buyers preparing for another upward move, or is the recent rally losing strength? Based on the November 21, 2026 reference snapshot, BLESS was trading around $0.012484, with a 24-hour low near $0.010288 and a high around $0
Load More

Join 40 M users in our growing community

⚡️ Join 40 M users in the crypto craze discussion

💬 Engage with your favorite top creators

👍 See what interests you

Trending Topics

BTCBreaksBelow60K

2.1M Views30.1K Discussing

BTC fell below $60,000 on November 20 for the first time since July, alongside a tech stock selloff and broader pressure on risk assets. Will $60K become resistance, or can BTC quickly reclaim it? What price or volume signals would convince you that selling pressure is easing?

GateDirectIPOPhase3ANTAllocates92100Shares

799.8K Views4.9K Discussing

NvidiaDropsNearly14Percent

335K Views7.6K Discussing

View More