
Share your thoughts
placeholder
Article
Everyone’s staring at the 0.40 level on WLD — I’m watching the 15m RSI scream at 66.45 and asking why you’re not.

$WLD /USDT - SHORT

Trade Plan:
Entry: 0.4012 – 0.4034
SL: 0.4128
TP1: 0.3944
TP2: 0.3892
TP3: 0.3813

Why this setup?
- The 4h chart says SHORT with 55% conviction, but the daily trend is *range*, not trend — so this is a scalp, not a saga.
- Price is pinned at 0.4023 with ATR (1h) at 0.0043 — that’s a tight coil, and the 15m RSI is overheated *before* a breakdown, not after.
- Why now? TP1 at 0.3944 is only 2% away, but the real meat is TP2 at 0.3892 — that’s where the ra
WLD+3.97%
(New streamer) Btc update
live-cover
LIVE227
Just discovered a risk-free arbitrage opportunity generating tens of thousands of dollars per day from a single trade
I believe many people on robinhood have been rugged to the point of tears. Today I’m sharing an exclusive opportunity unavailable anywhere else—guaranteed profits with no losses
While the U.S. stock market was closed over the weekend, robinhood’s on-chain BONER coin surged. Because the Meme coin skyrocketed, the HIMS stock token paired with it on the robinhoodhood DEX also became massively overpriced and depegged, reaching 10x the U.S. stock’s closing price last Friday
Here’s w
MEME+2.99%
HIMS-0.32%
NVDA+0.87%
NVDAG+0.43%
NVDAON+0.48%
I just casually hit refresh, and it dropped all by itself, leaving me on the back foot. 😂
When the screen was full of green, $APT /APT bounced twice but failed to hold either rebound. The volume weakened each time; no one was buying on the way up, showing that the bears still weren’t done. I tentatively placed a short order at 0.9133, just to test the direction.
Then I switched away to take a sip of water, and when I came back, the current price had already fallen to 0.6264, with my unrealized profit reaching +2228.96%. This was purely good luck—I casually tossed out a few gold coins, and they
post-image
APT+7.11%
ZEC+4.99%
ETH+2.14%
$1000 to $100,000 Crypto Trade Challenge Today
live-cover
LIVE1,405
While holding this trade, the floating profit pulled back at times, but I did not rush to adjust the position. At the time, $WLD was merely digesting its short-term gains; the broader structure had not broken down. The real risk was not a pullback in floating profit, but failing to recognize a reversal in direction.

I entered the long position around 0.3736. There were several sharp drops along the way, but since I had left enough room for the stop-loss and the position size was within what I could afford to bear, I ultimately held on. After the price climbed back up and the floating profit
post-image
WLD+3.97%
ZEC+4.99%
BNB+5.97%
$FLOCK Signal】Long - 1H volume contraction, high-level support
$FLOCK 1H volume fell sharply from 578 million to 87 million, while the price remains range-bound near 0.063 at a high level. Order book depth imbalance is -7.83%, with selling pressure slightly prevailing, but bids have appeared repeatedly around 0.0624.
🎯 Direction: Long
⚡ Entry/Limit Order: 0.06284 - 0.06303
🛑 Stop Loss: 0.06240
🚀 Target 1: 0.06398
🚀 Target 2: 0.06445
🛡️Trade Management: - Execution strategy: After reaching Target 1, reduce the position by 50% and move the stop loss up to the breakeven level. If the pric
post-image
FLOCK+31.07%
BTC+0.51%
ETH+2.13%
SOL+2.10%
If $ETH gets above $2,570 you will see another 12 hours of straight up green candles!
post-image
ETH+2.13%
Everyone’s chasing silver’s rally, but the 4h chart just whispered a secret to me about $XAG /USDT.

$XAG /USDT - SHORT

Trade Plan:
Entry: 66.24 – 66.30
SL: 66.54
TP1: 66.07
TP2: 65.94
TP3: 65.74

Why this setup?
Why now? The 1D trend is *range*, not breakout—so mean reversion is king.
- RSI on 15m is 58 (cooling, not overbought), but the 1h ATR (0.111) shows volatility is compressing.
- Entry at 66.27 with TP1 at 66.07, TP2 at 65.94—that’s a 0.5% drop before the daily range even blinks.
- Confidence is only 55, but the invalidation at 66.76 is tight—risk is defined, reward is 3:1 to
XAG+0.02%
GPT6 is nowhere near enough; it gets used up too quickly.
post-image
$XEC E-Cash Preparing To Send Some Rockets 🚀
E-Cash is back over the yellow 1D 200MA and is Preparing for more gains in the near-term.
This chart has bottomed out and is ready for the reversal.
Absolutely love this community and the project all together.
If this post get enough likes comments and reposts Ill drop a special post!
NFA, DYOR ⚠️
#Crypto #Trading #XEC
post-image
XEC+2.10%
Many people are focused on the key levels above, while overlooking the key levels below slowly moving higher. $BULLA After this move was pushed up from around 0.028584, the floating profit on my long position once reached +1949.58%, but I never chose to exit everything at once.
Because in trading, taking profits and letting profits run are inherently contradictory. My approach is simple: first turn 70% into real cash, move the take-profit level for the remaining 20% above the entry price, give the market some room, and leave myself a way out.
The price is currently consolidating repeatedly aro
post-image
BULLA+195.66%
XRP+1.63%
BNB+5.97%
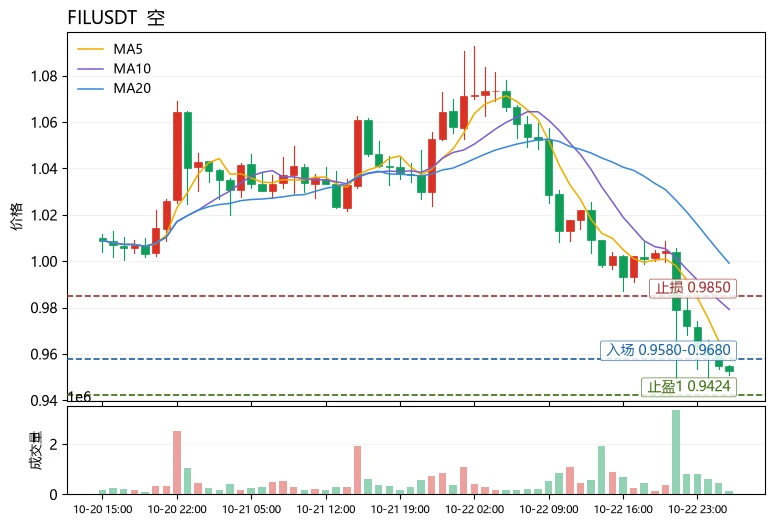
Everyone’s long SNDK while the 4h chart quietly prints lower highs—are you on the wrong side?

$SNDK /USDT - SHORT

Trade Plan:
Entry: 1759.70 – 1764.36
SL: 1791.09
TP1: 1740.24
TP2: 1725.71
TP3: 1703.91

Why this setup?
- RSI (15m) at 43.89 shows weak bounce momentum, not reversal fuel.
- 1D trend is “range,” but the 4h bias is SHORT with 77% confidence—range tops reject.
- Entry zone 1759–1764 sits just under 1762.03; TP1 at 1740 is a clean 1.2% grab before Asia wakes.
- ATR (1h) at 9.31 means volatility is tight—this is a precision scalp, not a swing.
- Why now? The clock is 00:2
post-image
SNDK+1.87%
Take Friday’s short profits in time; continue to lie in wait for the rebound! September 6 BTC and ETH outlook
On Friday, I suggested continuing to short, capturing nearly 2,000 points on BTC and 50 points on ETH. We exited relatively promptly, while the market rebounded quite a bit over the weekend, mainly because spot ETF funds saw considerable inflows again on Friday, boosting market sentiment. However, there have indeed been no particularly positive developments. It may have been triggered by the US escorting merchant ships, but Iran did not compromise and continued its strikes over the pas
ETH+2.14%
BTC+0.52%
GLDX+0.69%
PAXG-0.11%
  • 2
#Gate60MillionUsers
60 million users is a huge number, but behind every number there is a different story. Here’s a small part of mine.
I joined Gate without really knowing how much this journey would teach me.
In the beginning, I was mostly curious. I would open the market, look at the charts for a while, watch prices move up and down, and then close the app thinking, “Maybe I’ll understand this tomorrow.” 😂
My first few weeks were basically a battle between curiosity and confusion.
I still remember one of my early trades. I had spent a long time watching a chart and finally convinced mysel
Everyone’s chasing SUI longs while the 4h silently flips bearish—are you on the wrong side?

SUI/USDT - SHORT

Trade Plan:
Entry: 0.7921 – 0.7967
SL: 0.8169
TP1: 0.7776
TP2: 0.7663
TP3: 0.7495

Why this setup?
Why now? The daily is *range*, but our 4h map says SHORT with 55% conviction. RSI on the 15m (40.96) is already weak, and ATR (0.0093) shows volatility is compressing—perfect setup for a breakdown. Entry zone 0.7921–0.7967 is armed; first target is a clean 2% drop to 0.7776. The invalidation at 0.7701 is far, giving us room to breathe. This isn’t a scalp—it’s a positional fade.

Deba
SUI+5.20%
Everyone’s chasing SKYAI’s bounce—but the 4H chart just whispered a 95% secret.

$SKYAI /USDT - SHORT

Trade Plan:
Entry: 0.06135 – 0.06199
SL: 0.06472
TP1: 0.05938
TP2: 0.05786
TP3: 0.05557

Why this setup?
Why now? The daily trend is still bearish, yet the 15m RSI (63.55) shows a weak bounce—a classic bull trap. Price sits at 0.06167, hugging the 1H pivot. ATR (0.00127) is tight, meaning the breakout is coiled. Targets down: TP1 0.05938, TP2 0.05786. The invalidation at 0.05841 is far—room to breathe.

Debate:
Is this the final flush before SKYAI dumps to TP2, or are we early on a fakeou
SKYAI+7.08%
The hand that set the stop-loss a few days ago trembled slightly; this morning, I realized that overprotective gesture had been unnecessary. The final $DOT rebound before bed reached around 1.193. It looked strong, but the more it pushed, the more hollow it felt—the volume failed to keep up, and it clearly could not hold. The short position was already open, so I placed the stop-loss outside the key level and went to sleep, thinking I would accept it if I got stopped out. When I woke up, the price had not tested higher; instead, it slid to 0.922, delivering a paper return of +1611.81%. Staying
post-image
DOT+2.53%
ETH+2.14%
SNDK+1.87%
Everyone’s waiting for XRP to explode—what if the real move is already fading?

$XRP /USDT - SHORT

Trade Plan:
Entry: 1.4094 – 1.4140
SL: 1.4340
TP1: 1.3950
TP2: 1.3838
TP3: 1.3671

Why this setup?
- 4h bias is SHORT at 55% confidence, but this isn’t a knockout punch—it’s a grind.
- Price sits at 1.4117 with a tight 1.4140 ceiling; RSI 15m at 42.2 shows zero buying urgency.
- TP1 at 1.3950 is only 1.2% away—that’s the low-hanging fruit before the daily range traps you.
- Why now? The 1D is rangebound, so momentum dies fast. You’re not betting on a crash, you’re selling the stall.

D
XRP+1.63%
Load More

Join 40 M users in our growing community

⚡️ Join 40 M users in the crypto craze discussion

💬 Engage with your favorite top creators

👍 See what interests you

View More