Square
Following
Hot
News
Notifications
Profile

CryptoXLARGE

vip
No content yet
Peak Tier VIP 56.4 Year(s)
6
Following
48
Followers
314
Liked
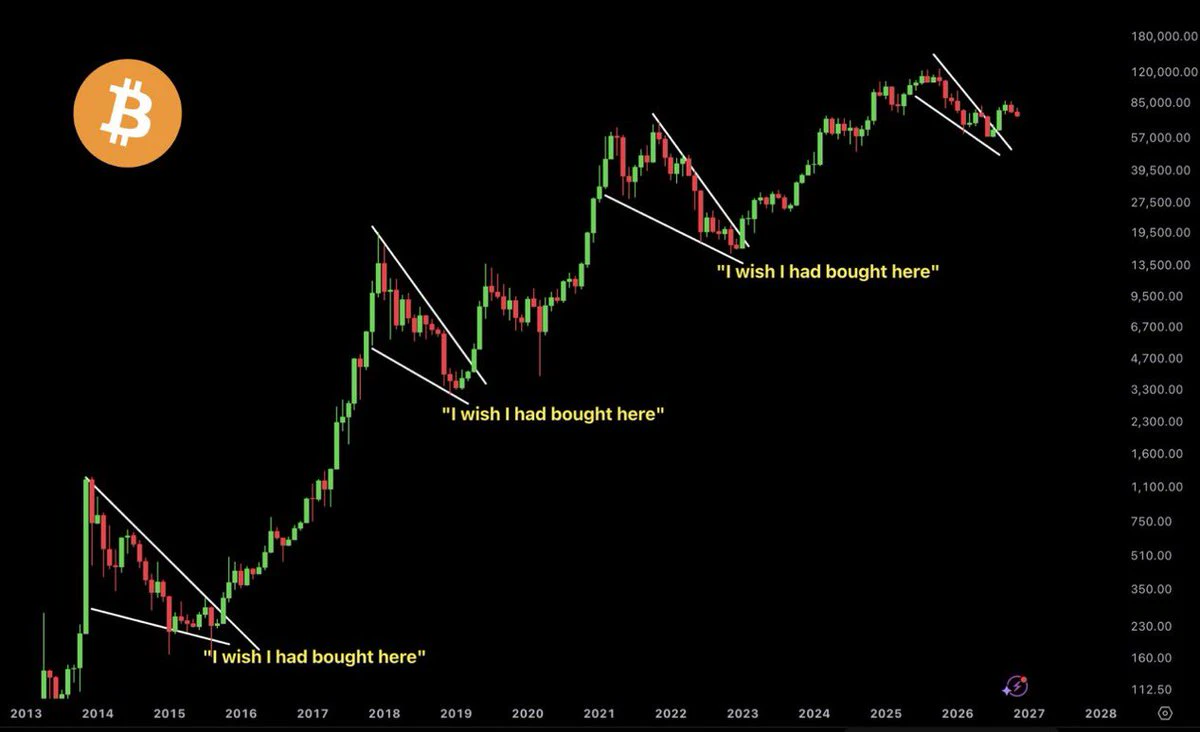
The biggest opportunities in $BTC history rarely felt like opportunities at the time.
In 2015, people were waiting for lower prices.
In 2018, they thought #Bitcoin was finished.
In 2022, fear dominated the market.
Yet every major correction eventually became part of the next bull market.
Today, we’re facing another period of uncertainty.
The question is not whether Bitcoin will experience volatility.
It’s whether you’re looking at the current correction with fear or a long-term perspective.
The best entry points are often the ones that feel the hardest to take.
post-image
BTC-0.67%
Normal Day in Crypto Market
The Day After Buying Altcoins
post-image
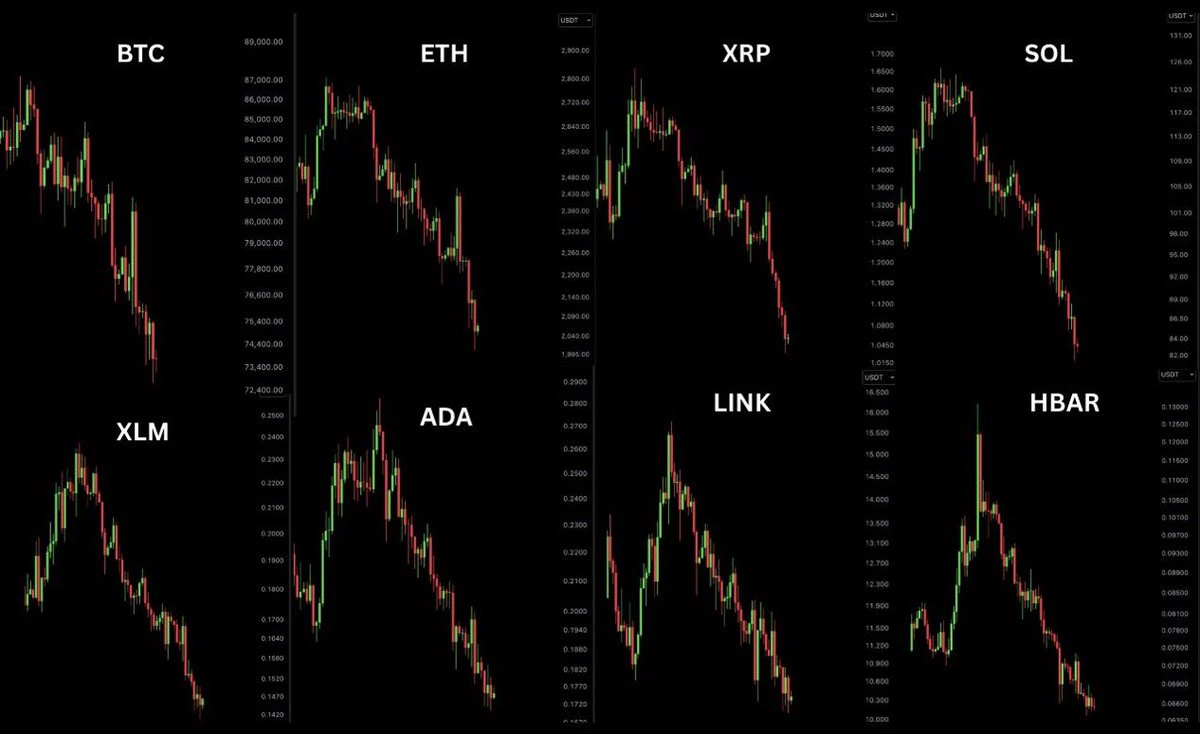
Crypto market in Q4:
$BTC : -14.5%
$ETH : -26%
$DOGE : -30.5%
$LINK: -30.6%
$XRP : -31.7%
$SOL : -32.2%
$ONDO: -32.9%
$SUI: -33.5%
$PUMP: -45%
$TRUMP: -52%
BTC-0.67%
ETH-1.26%
DOGE-0.22%
XRP-1.15%
SOL-0.77%
#Bitcoin is going to $200,000.
Data says November midterm election panic is the best opportunity to buy $BTC before the next parabolic move.
In 2018, it did not matter if you bought Bitcoin at $6,000 or $3,200. It hit $69,000 in the next three years.
In 2022, it did not make much difference if you bought at $21,000 or $16,000. It hit $126,000 in the next three years.
The same idea applies in 2026. Buying BTC at $75,000 or $65,000 will not make a difference when it hits $200,000.
BTC-0.67%
The Crypto Market explained in a few seconds.
Gm 🙋🏻‍♂️
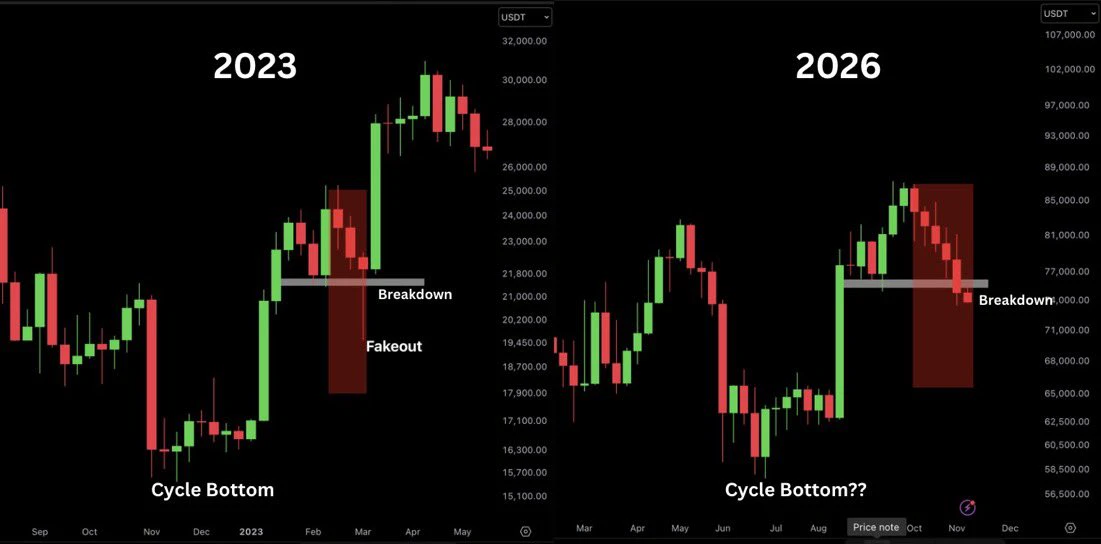
Bitcoin’s current structure looks remarkably similar to the 2023 setup.
Back then, $BTC went through four phases:
A strong rally from the market bottom.
Months of sideways consolidation.
A liquidity sweep below major support.
A strong recovery that led to new highs.
We could be approaching the same turning point again.
What looks like weakness today could become the foundation for the next major move.
History doesn’t repeat perfectly, but the similarities are hard to ignore.
post-image
BTC-0.67%
  • 1
Every morning when I check my Crypto wallet
post-image
#Bitcoin just lost a key level on the weekly chart.
For the first time in two months, $BTC closed below its 50-week moving average.
Now, the next weekly candle could determine the direction of the market.
Here’s what I’m watching:
Bullish scenario: A quick reclaim of the 50-week MA would signal a potential bear trap, suggesting the breakdown was designed to shake out weak hands.
Bearish scenario: Another weekly close below this level would increase downside risk, with the low $60K region becoming a key area to watch.
This is a critical moment for Bitcoin.
Fakeout or the start of a deeper corre
post-image
BTC-0.67%
The Most Profitable Trader in Crypto History.
Daily Profit: $6.300.000.000
Plan B if Bitcoin doesn’t work out.
BTC+1.22%
You can only spend $50 ?
post-image
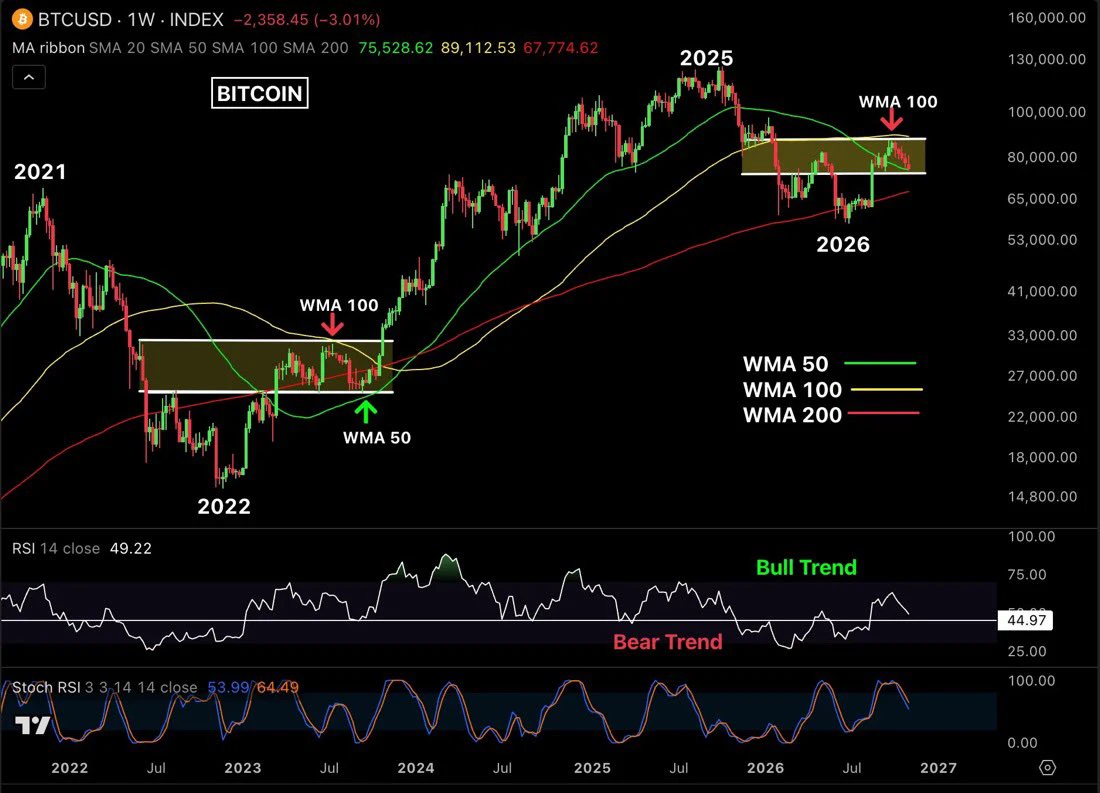
#Bitcoin is showing a similar setup to 2023.
Back then, $BTC consolidated between the Weekly MA 50 and MA 100 before breaking out into a major rally.
Now, in 2026, it’s trading between the same moving averages after getting rejected near $87,400.
Key levels to watch:
Support: $75,500 and $67,800
Resistance: $82,000 and $87,400
RSI: Around 50
Stochastic RSI: Still weak
If BTC holds support and reclaims the Weekly MA 100, another major rally could follow.
Will history repeat itself?
post-image
BTC-0.67%
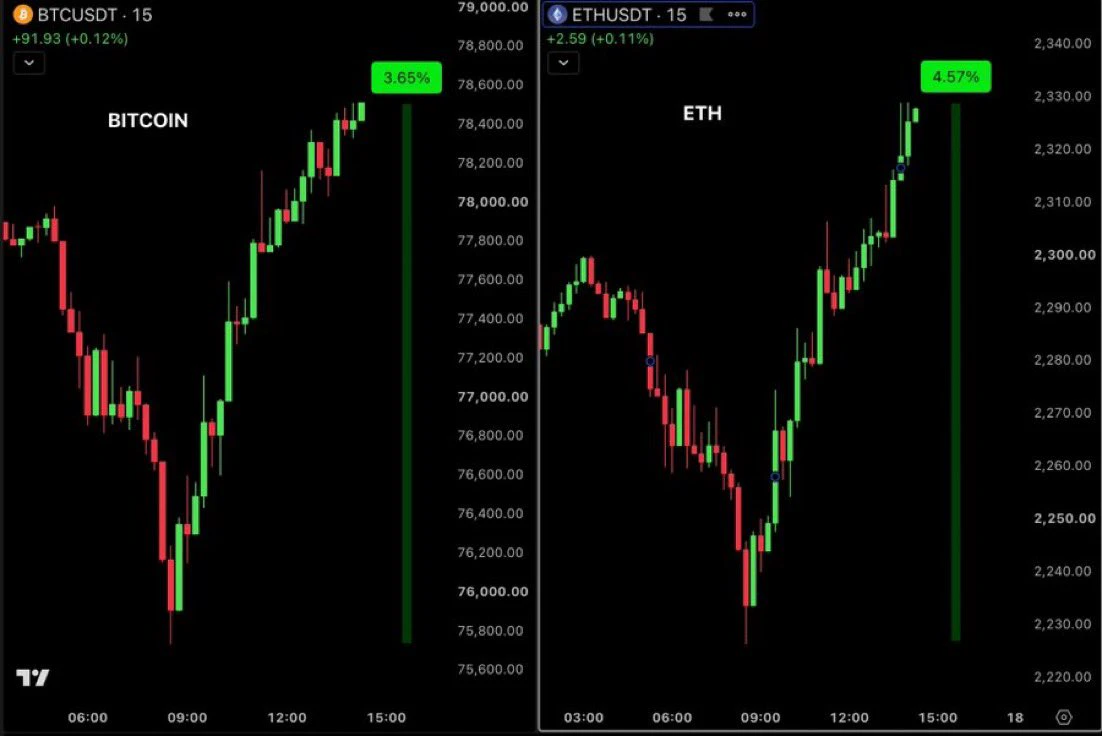
Bitcoin and Ethereum staged a strong V-shaped recovery following the US midterm election results.
$BTC is up 3.65% from its lows, reclaiming $78,000.
$ETH has gained 4.57%, trading near $2,320.
Markets initially reacted to election uncertainty, but buyers quickly stepped in as Democrats secured a clear lead in both chambers.
The key question now: Is this the start of a broader crypto recovery ?
post-image
BTC-0.67%
ETH-1.26%
  • 1
Bitcoin and Ethereum are bouncing, but the recovery is not confirmed yet.
$BTC is back above $78K Reclaiming the $82K Daily MA 50 is key, with $85K–$87.5K next.
$ETH bounced from its Daily MA 200 and is holding above $2,300. Resistance sits at $2,550.
Oil falling below $100 is easing pressure on risk assets.
Key events this week:
• ISM PMI – Monday
• US Midterm Elections – Tuesday
• US Jobs Report – Friday
Relief rally or trend reversal? 👀
BTC-0.67%
ETH-1.26%
Historically, major crypto exchange hacks have often been followed by #Bitcoin reaching new all-time highs.
Fear creates opportunities. The market has seen this pattern before.
The question is: will history repeat itself ?
Position accordingly.
BTC-0.67%
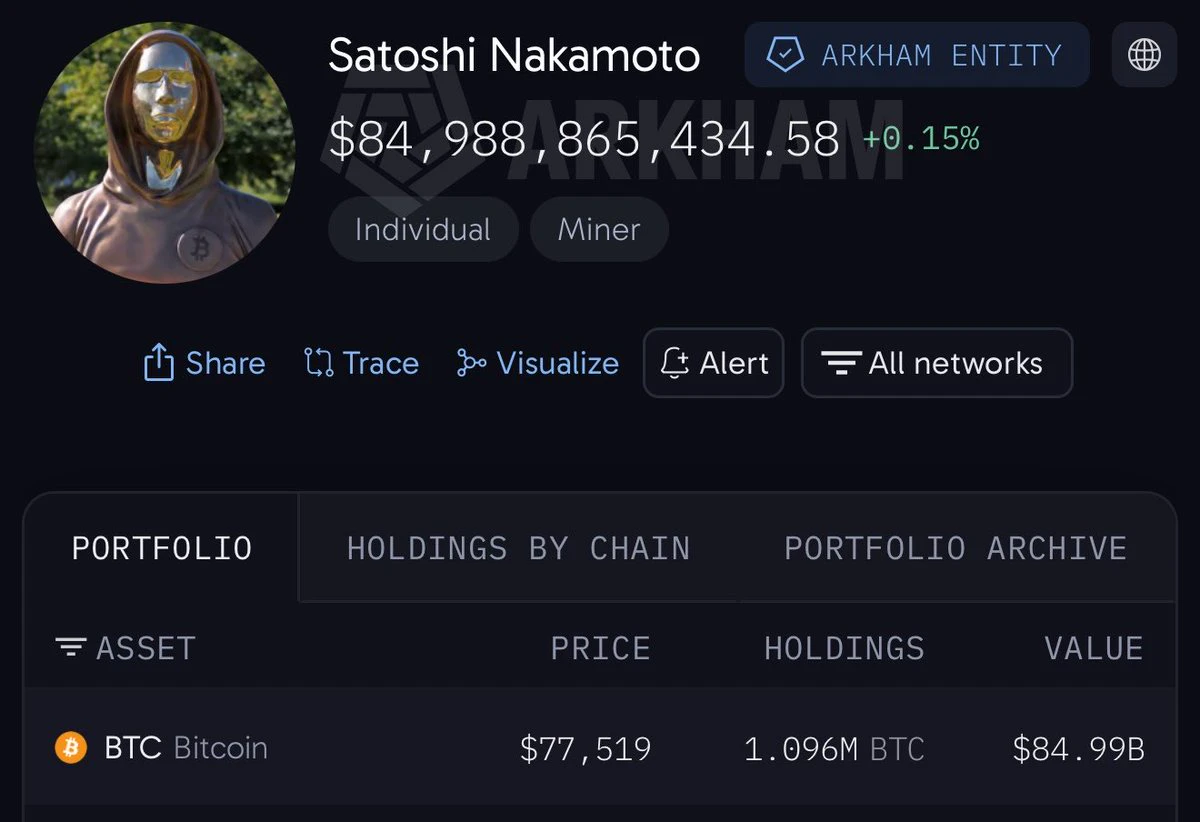
So many crypto hacks happening lately, yet no one has ever tried to hack Satoshi Nakamoto’s wallet, which holds over $85 BILLION worth of Bitcoin.
What’s stopping them ?
post-image
BTC-0.67%
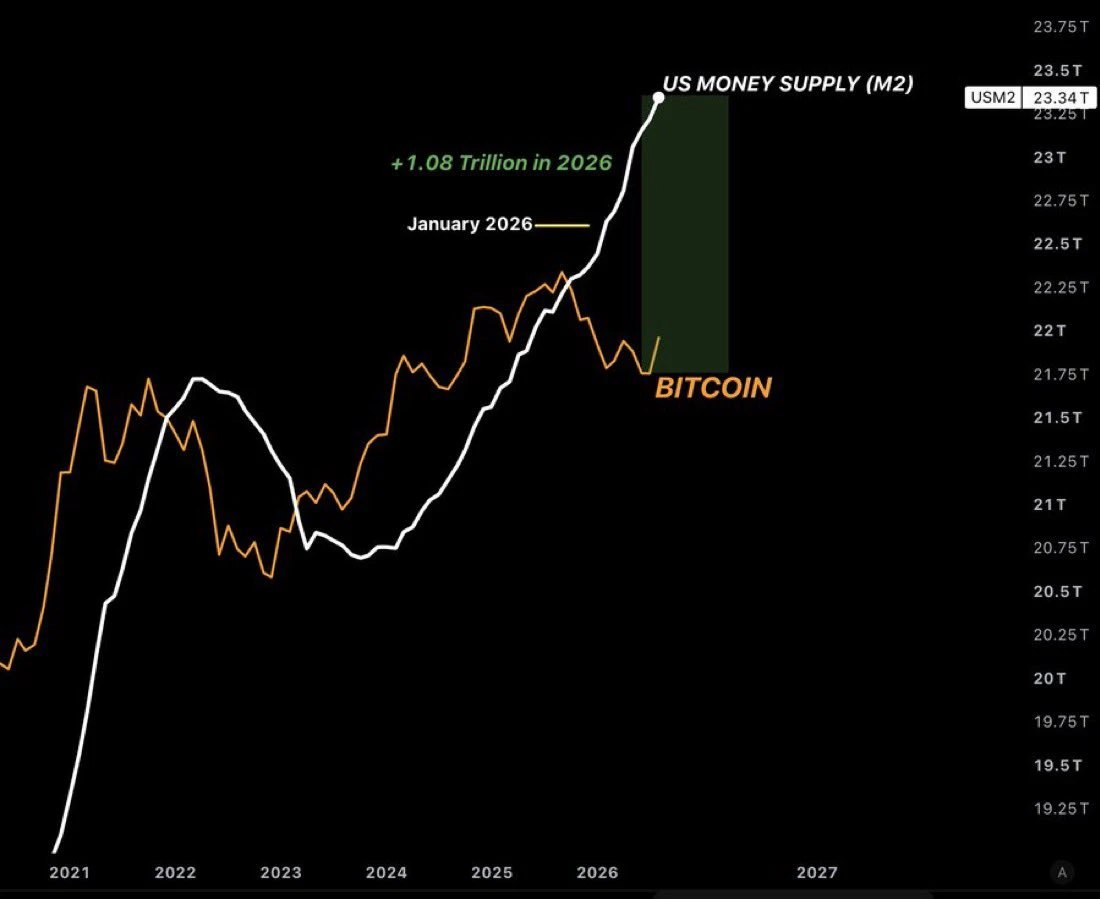
US M2 liquidity just hit a new all-time high.
The money supply is expanding, and Bitcoin has yet to fully reflect this trend.
Historically, rising liquidity has been a powerful tailwind for $BTC
If this trend continues, Bitcoin could be setting up for its next major move.
Liquidity is rising. Will Bitcoin follow ?
post-image
BTC-0.67%
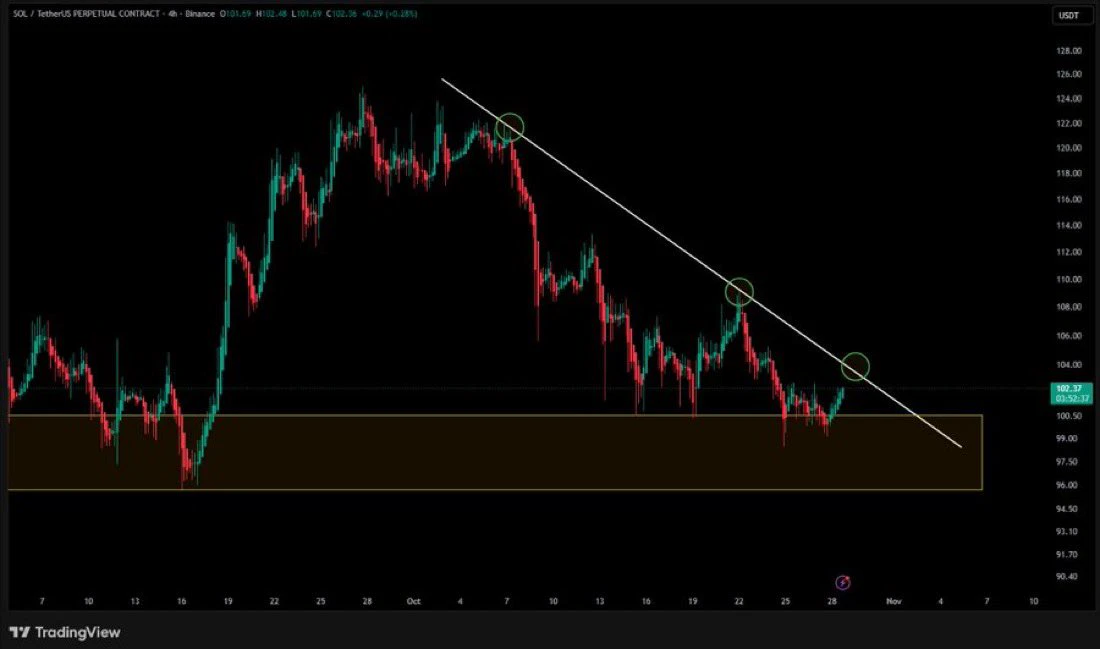
$SOL is testing a key resistance on the 4H chart.
Buyers continue to defend the $96–$100 support zone.
A breakout above $104–$105 could push SOL toward $108–$112.
If rejected, $100 and $96 remain key supports.
The next move depends on this breakout.
post-image
SOL-0.77%
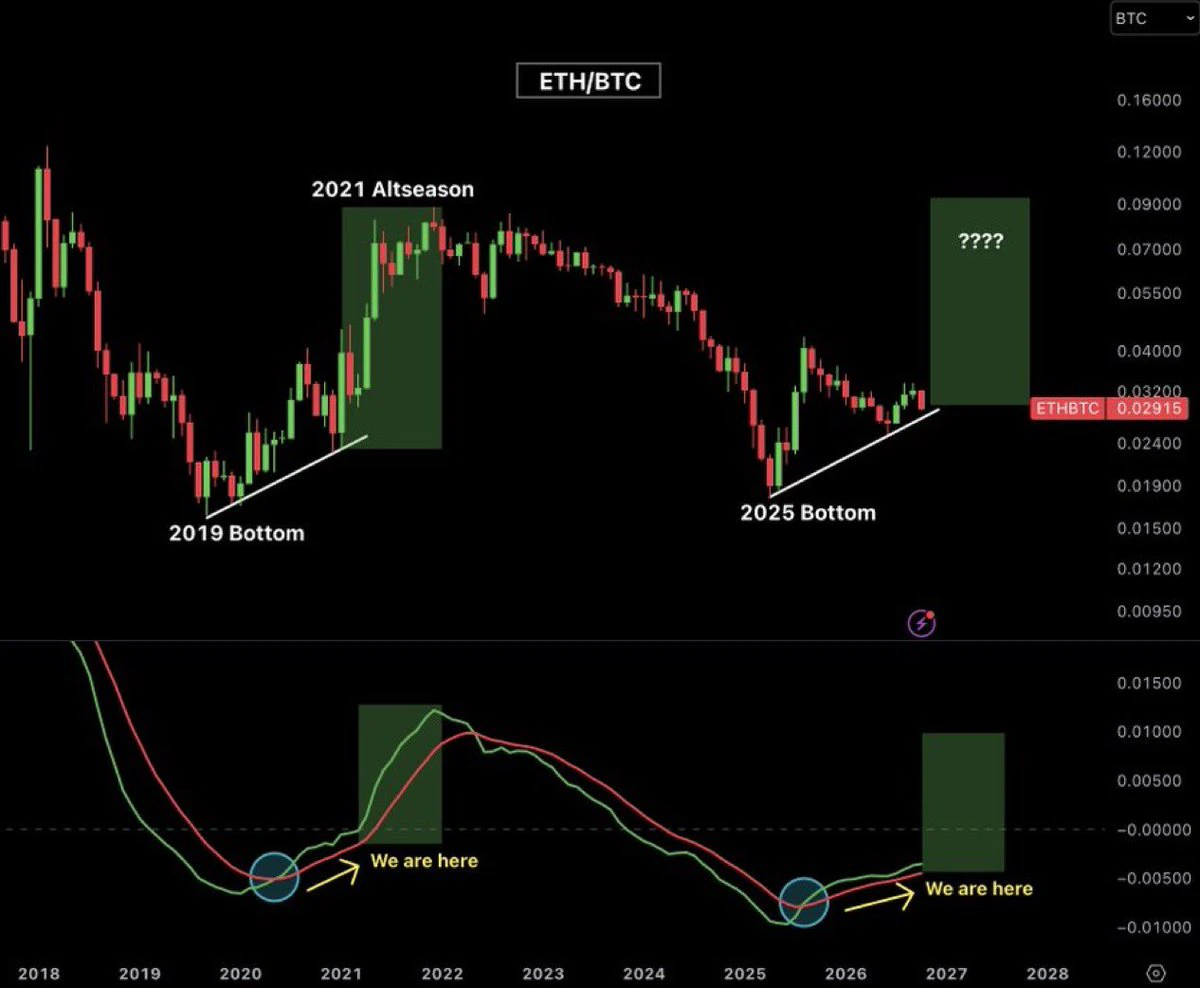
Altcoins could be approaching a major turning point.
$ETH / $BTC is showing a structure similar to the one that preceded the 2021 altseason.
The 2019 bottom, rising trendline, and momentum shift are worth watching.
If this pattern repeats, altcoins could be gearing up for their next major expansion.
The question is: will history repeat itself ?
post-image
ETH-1.26%
BTC-0.67%
Load More