Share your thoughts
placeholder
Article
Smart money is quietly setting up a massive BNB move right now.

$BNB /USDT - LONG

Trade Plan:
Entry: 711.16 – 713.94
SL: 695.26
TP1: 725.52
TP2: 734.16
TP3: 747.13

Why this setup?
Why now? The daily trend is range-bound, but the 1h ATR of 5.541492 signals expanding volatility that could break the range. With the 15m RSI at 38.73, BNB is approaching oversold territory near the entry zone of 712.55, offering a low-risk LONG setup. The invalidation level sits at 726.32, meaning a break above that invalidates the entire range play. If the entry holds, TP1 at 725.52 and TP2 at 734.16 become r
BNB-3.62%
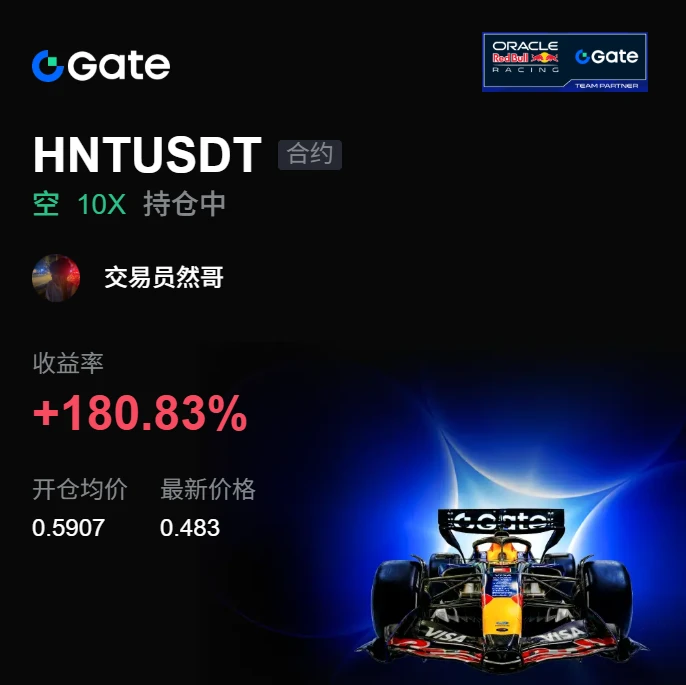
No big-picture vision, can’t hold, this wave’s profit is as thin as paper, but I love it. Opened the chart this morning, and the short trade had already done its job on its own 😅

Opened the chart this morning, $HNT ’s rebound was weak, with insufficient support and clear overhead pressure, so I directly signaled to go long. Someone even asked then whether they could add to the position. I only said: the selling hasn’t gone away, don’t rush.

From 0.5907 to 0.483, with a return of +180.83%, the answer is clear. Nailed the rhythm, feels great, brothers. The slice of meat isn’t big, but it ta
post-image
HNT-12.80%
SNDK-2.92%
XRP-4.75%
Nobody is talking about the quiet move building in UNI right now.

$UNI /USDT - LONG

Trade Plan:
Entry: 5.998 – 6.058
SL: 5.655
TP1: 6.307
TP2: 6.494
TP3: 6.773

Why this setup?
Why now? The daily trend is bullish, the 1h price sits at 6.028, the 15m RSI is 36.02 showing room to run, and the 1h ATR of 0.119436 confirms enough momentum to push toward the first target at 6.307. The entry zone between 5.998 and 6.058 aligns with that 1h price, giving a tight risk setup before the second target at 6.494. The line in the sand is 6.240, because breaking it invalidates the entire long thesis.

D
UNI-7.98%
BULLISH: Coinbase CEO Brian Armstrong believes Bitcoin may have already found its bottom and sees the leading cryptocurrency moving higher over the next two years.#GateMeme $AAPL
AAPL+3.27%
  • 2
  • 1
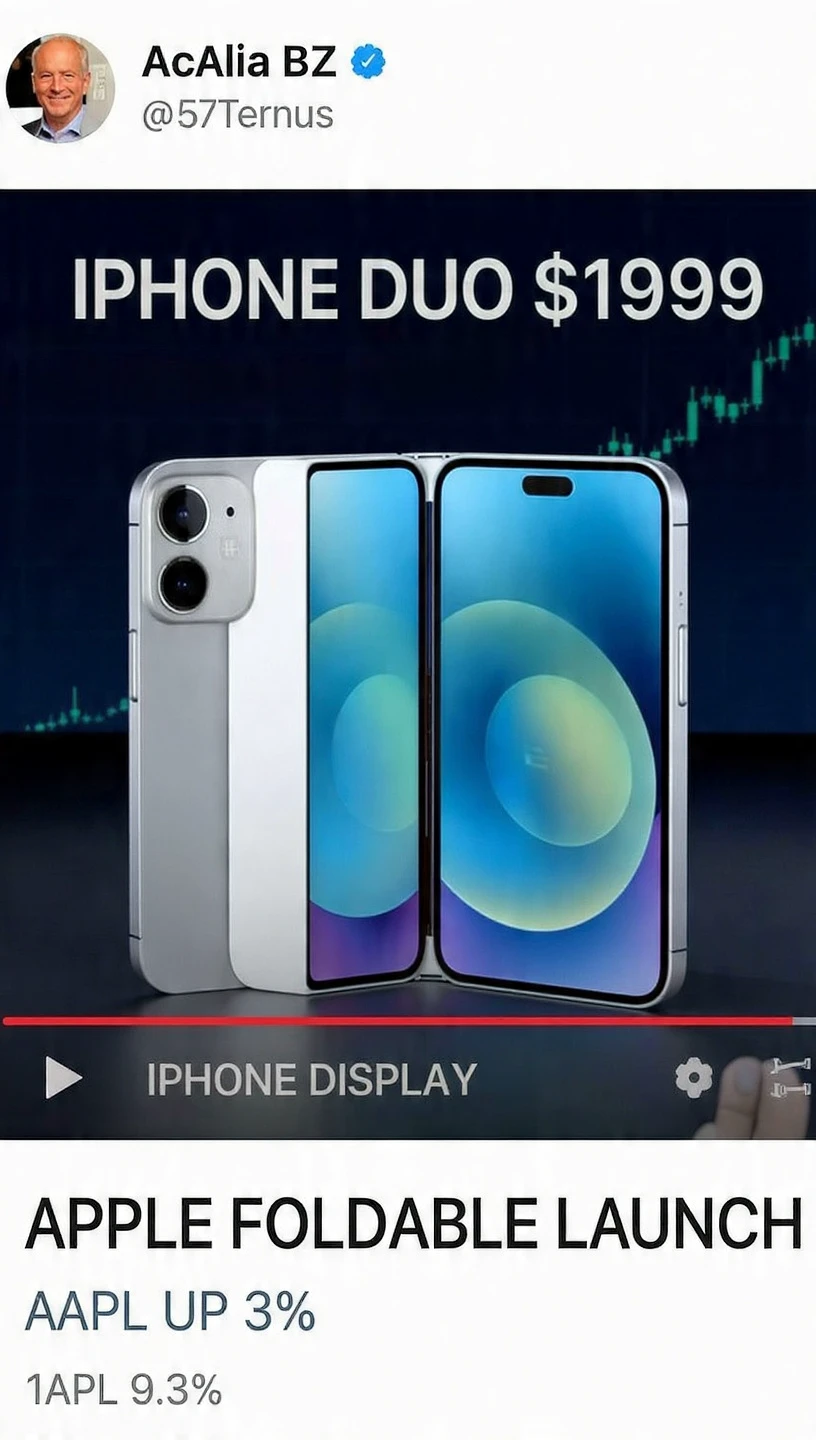
Apple Foldable iPhone Duo Launches at $1,999, AAPL Shares Up 3% as Wall Street Weighs Pricing Strategy
Apple officially unveiled its first foldable smartphone, the iPhone Duo, at its "Surprise and Shine" event on September 10, 2026, marking the company's most significant hardware redesign since the original iPhone. The device, which starts at $1,999 for the 256GB model and scales up to $2,999 for the 1TB configuration, features a book-style foldable design with a 5.5-inch outer cover display and a 7.8-inch inner display at a 4:3 aspect ratio—roughly the size of an iPad mini when opened. Powere
post-image
AAPL+3.27%
  • 6
  • 2
【$Bull Comes Signal】Long + 1H volume breakout above the upper band
$Bull Comes 1H volume surged from 107 million to 195 million, with three bullish candles closing consecutively; 0.10233 broke above the 1H Bollinger upper band at 0.0977.
The 4H MACD histogram contracted to -0.0002, while the 1H bullish histogram expanded to 0.0033, with short-term bulls controlling the momentum.
Order book depth imbalance stands at -5.04%, with a buy/sell ratio of 0.90 and sell orders accumulating above 0.103.
The funding rate is grounded at 0.0050%, OI is stable, and spot buying is driving this move.
The curr
post-image
牛来+32.50%
BTC-1.63%
ETH-0.83%
SOL-3.63%
Why is everyone suddenly quiet about ENA when the 1h setup looks dangerously perfect?

$ENA /USDT - LONG

Trade Plan:
Entry: 0.14529 – 0.14713
SL: 0.13474
TP1: 0.15481
TP2: 0.16055
TP3: 0.16915

Why this setup?
Why now? The daily trend is bullish and the 1h RSI sits at 21.48, signaling deep oversold conditions that often precede sharp reversals. The 1h ATR of 0.003677 confirms volatility is compressed, which usually explodes in one direction after a squeeze. The entry zone between 0.14529 and 0.14713 aligns with the 1h price of 0.14621, offering a precise risk-defined long. TP1 at 0.15481 a
ENA-6.32%
[New Streamer] Market Prediction
live-cover
LIVE27
Surged to 0.00116, then fell back to 0.000809: Those chasing SC highs are trapped halfway up the mountain
Well, $SC is now at 0.000809, down 20.608% in 24 hours—after surging to 0.00116 on 09-09, it has now fallen back to 0.000809, leaving all those who chased the top trapped halfway up the mountain. I’m bearish; I’ll treat any rebound as distribution.

Bearish logic: First, the daily RSI at 72.6 is overbought, and the price has been slammed from 0.000963 back to 0.000809 as profit-taking kicks in; second, multi-timeframe signals are bearish, with the daily ADX at 66.2 and the 1-hour moving
SC-18.56%
LAPTOPs plunge has sparked controversy! Bidens son denied profiting from it and said he would “recla
live-cover
LIVE2,054
Earn Daily Trading Rewards, Plus 20 USDT for Returning Users https://www.gate.com/campaigns/6178?ch=7147&ref=VLFCVA8MAQ&ref_type=132
post-image
Smart money is quietly accumulating silver at these exact levels.

$XAG /USDT - LONG

Trade Plan:
Entry: 64.13 – 64.49
SL: 62.07
TP1: 65.99
TP2: 67.11
TP3: 68.79

Why this setup?
Why now? The daily trend is range-bound, but the 1h ATR of 0.717788 signals a breakout is imminent. The 15m RSI at 28.36 shows oversold conditions, suggesting a reversal is due. The entry zone between 64.13 and 64.49 aligns with the 1h price of 64.31, offering a precise long setup. Targets are 65.99 and 67.11, but the trade invalidates if 65.95 breaks.

Debate:
Are we hitting TP2 at 67.11 or getting trapped by the
XAG-5.22%
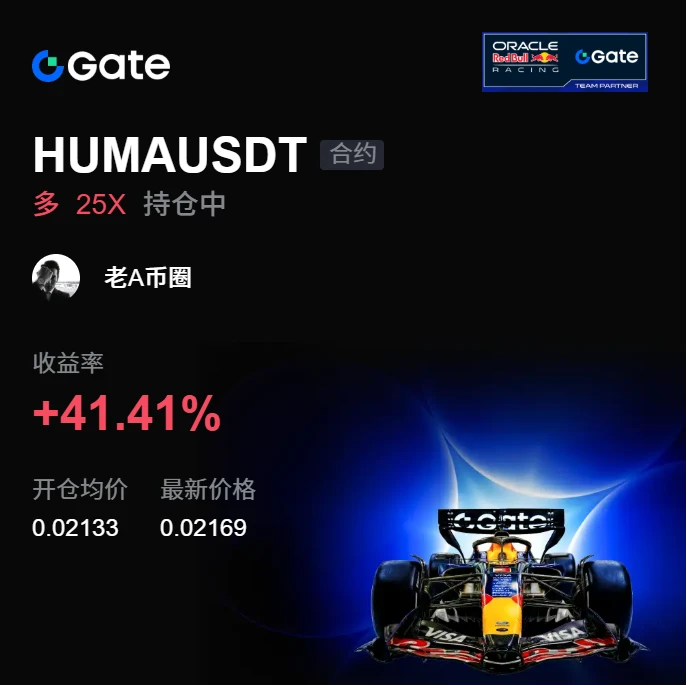
This isn’t a rebound—it’s a feeding tube inserted into an account that was about to flatline.
When the intraday plunge hit, $HUMA had dropped to 0.02133. I watched the order book for ages; funds were quietly entering, with the volume still hidden and not yet deployed, so I signaled longs to lie in wait here. Now it has recovered to 0.0217, with unrealized gains of +41.41%. It was truly sluggish before, but the result is truly sweet.
Take profit at +41.41% first and lock in the gains. Move the stop loss on the remaining 59% up to the breakeven price, giving the market some room and myself a way
post-image
HUMA-8.08%
SOL-3.53%
SNDK-2.92%
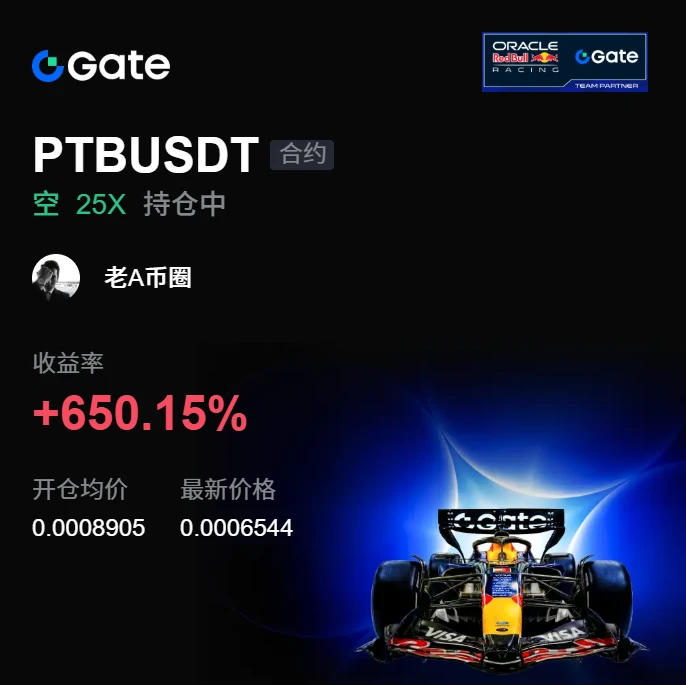
Originally, I wanted to close it out and call it a day, but it turned around on its own and handed the profits back.

A few days ago, it was still grinding at the highs when I took my last look before bed. Selling pressure hadn’t eased, and every bounce was pushed back down. I opened a short at 0.0008905, not expecting it to give me much.

When I checked again today, it had already dipped to 0.000654, with floating profit reaching +651.25%. I wasn’t watching the chart or thinking about it—it was moving on its own, like it was working overtime for me.

I’ve taken 80% off the table and moved
post-image
BNB-3.62%
XRP-4.75%
Nobody is talking about the quiet move forming in $MU /USDT right now.

$MU /USDT - LONG

Trade Plan:
Entry: 980.05 – 985.31
SL: 949.82
TP1: 1007.32
TP2: 1023.75
TP3: 1048.40

Why this setup?
Why now? The daily trend is range, which means the market is coiling for a directional break, and the 1h ATR of 10.53 shows enough volatility to fuel a serious move once it decides. The 15m RSI at 27.06 signals deep oversold conditions, suggesting sellers are exhausted and buyers are stepping in near the entry zone of 982.68. With TP1 at 1007.32 and TP2 at 1023.75, the setup offers a clear ladder of up
MU-4.13%
#美国8月PPI录得5.4%高于预期
The August PPI print is out and it brought no relief to anyone hoping this inflation story was over. Headline producer prices rose 0.4% on the month, exactly in line with consensus, but the year over year number came in at 5.4%, a tenth above the 5.3% economists were looking for and clearly above July's roughly 4.7% to 4.8% pace. That is the strongest jump in wholesale inflation in three months. Strip out food and energy and core PPI rose 0.2% on the month and about 4.6% on the year, up from something like 4.2% in July. That is roughly two and a half to three times the Fed'
Smart money is quietly building long positions on $WLD /USDT while retail panics.

$WLD /USDT - LONG

Trade Plan:
Entry: 0.4022 – 0.4074
SL: 0.3729
TP1: 0.4287
TP2: 0.4447
TP3: 0.4686

Why this setup?
Why now? The daily trend is range-bound, but the 1h ATR of 0.010229 signals a volatility expansion that could break the range. The 15m RSI sits at 23.44, showing the asset is deeply oversold at the 0.4048 entry reference. This means the current dip is offering a high-probability entry within the 0.4022 to 0.4074 zone before the next leg up. The first target is 0.4287, followed by a move toward
WLD-7.16%
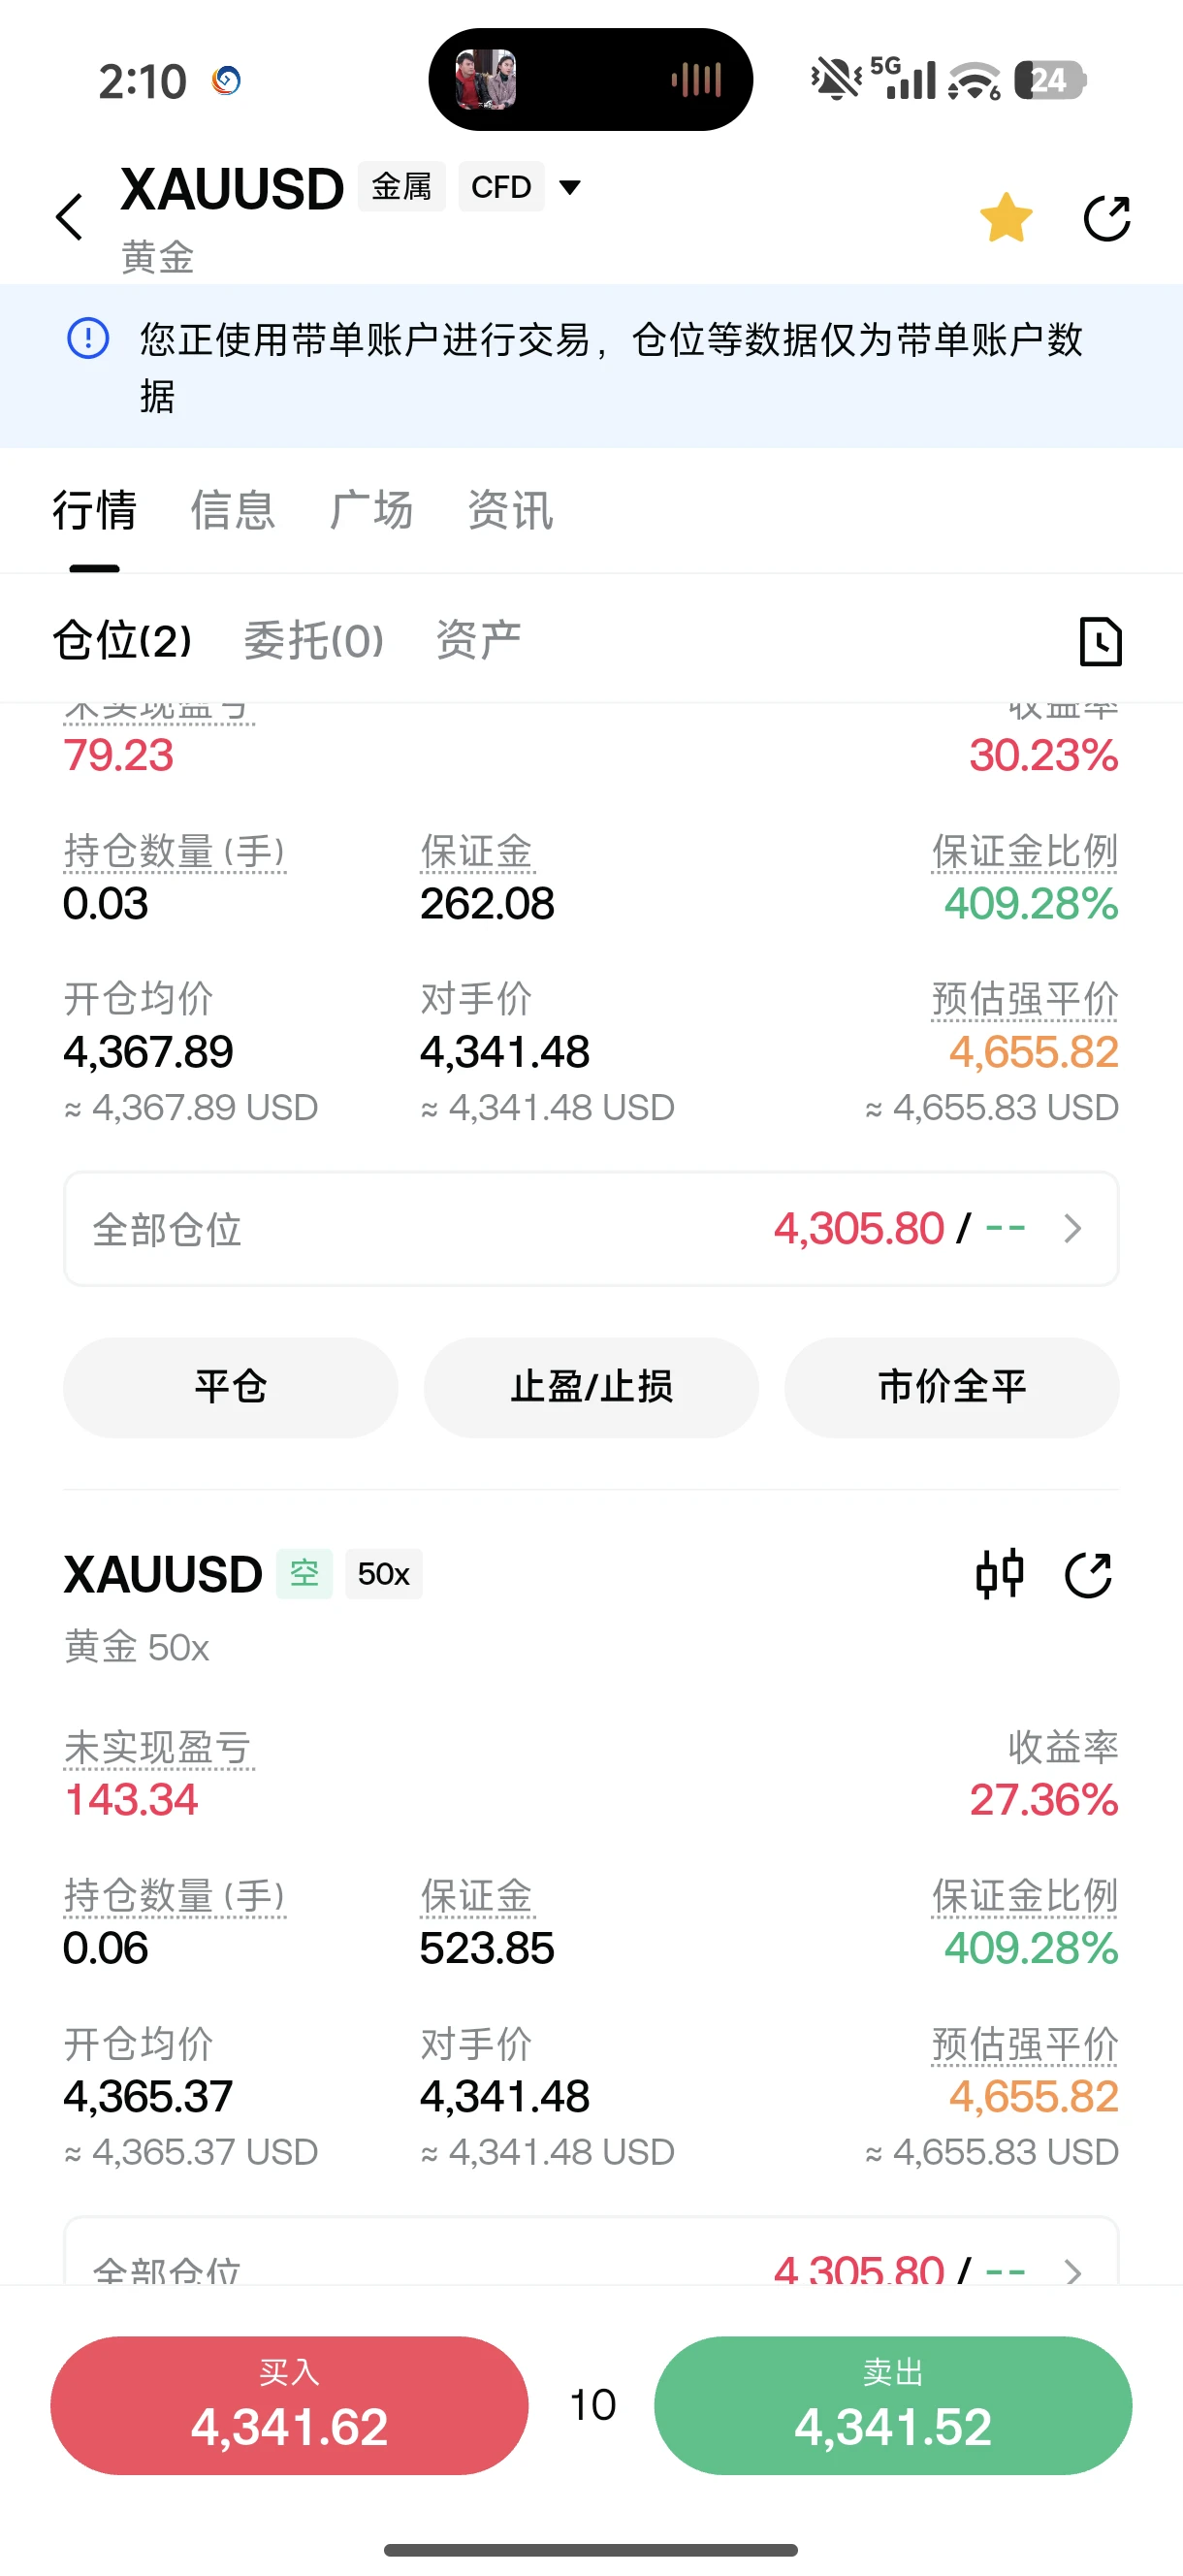
Make the right call once a day—one trade is enough! #黄金
post-image
GLDX-1.86%
PAXG-1.48%
XAU-1.53%
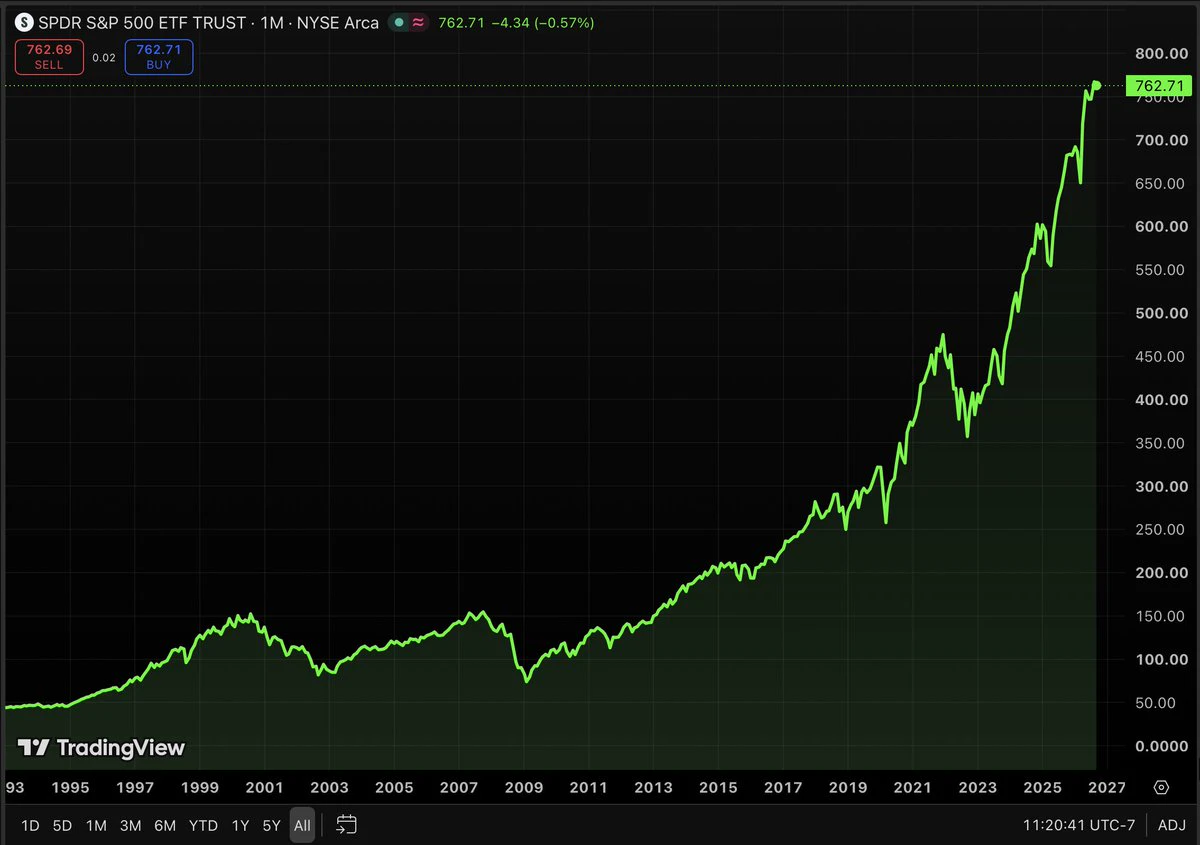
Retail investor: I'm 60 with $250k saved. I know I'm late. What's even the point now.
Me: You planning to die at 65?
Retail investor: ...no.
Me: Then you've got 25+ years of compounding left & $250k to start it with. That's not late.
Retail investor: But I can't afford to lose any of it.
Me: Look at that chart of $SPY. The SP500 has a 50+ year track record of averaging 10% ish per year on average. Yes... Some year will be up more and down more. But in the long run... it's hard to beat.
Retail investor: So just index & hold?
Me: That's step one. Step two is that $250k can secure puts on great c
post-image
Choose you Team !
Team 🅰️
ethereum:0x6982508145454ce325ddbe47a25d4ec3d2311933
$DOGE
terra-luna:native
Team 🅱️
$WKC
ethereum:0x95ad61b0a150d79219dcf64e1e6cc01f0b64c4ce
#FLOKI
🔄for Team 🅰️
❤️for Team 🅱️
post-image
ETH-0.83%
DOGE-5.60%
LUNA-6.43%
WKC-6.26%
FLOKI-5.67%
Load More

Join 40 M users in our growing community

⚡️ Join 40 M users in the crypto craze discussion

💬 Engage with your favorite top creators

👍 See what interests you