Share your thoughts
placeholder
Article
Everyone is staring at Bitcoin, but $ETH /USDT is quietly setting up a trap at 2481.

$ETH /USDT - SHORT

Trade Plan:
Entry: 2478.72 – 2483.94
SL: 2506.39
TP1: 2462.53
TP2: 2450.00
TP3: 2431.21

Why this setup?
- 4H bias is SHORT with 55% confidence — not a slam dunk, but the range-bound 1D trend says don’t chase longs.
- Price is sitting right at the 2481 reference — a failed retest here is textbook for a fade.
- RSI on 15m is 54 — no overbought panic, but no momentum spike either — that’s a stall signal, not a breakout.
- Why now? The entry window (2478–2483) is active, and TP1 at 2
ETH+1.40%
Repeated rebounds have been thwarted, and the short-term outlook for $ZAMA has completely weakened.
After multiple failed attempts to hold above the upper price levels, incremental capital has stopped entering, and the market has entered a stock-based game. High-level holders are gradually taking profits and exiting, selling pressure on the order book continues to be released, and indicators reflect weakening bullish momentum, leaving room for a pullback.
Prices continue to probe lower, remaining in a weak range in the short term with intense volatility, and a rebound recovery may occur at an
post-image
ZAMA-2.59%
DOGE+6.44%
🇺🇸 US dollar has lost 97% of its purchasing power since the Federal Reserve was created.
A $3 item in 1913 would cost $100 today.
post-image
Why is everyone still long HOME/USDT when the 1-day trend just flipped bearish?

HOME/USDT - SHORT

Trade Plan:
Entry: 0.00611 – 0.00613
SL: 0.00622
TP1: 0.00604
TP2: 0.00599
TP3: 0.00592

Why this setup?
- 95% confidence on the SHORT setup—this isn’t a coin flip.
- 4h momentum is fading; RSI on 15m (56.89) is stalling, not confirming upside.
- Price sits at 0.00612, with immediate downside targets at 0.00604 (TP1) and 0.00599 (TP2).
- ATR (1h) is tight (0.000042)—low volatility means the next expansion likely favors the path of least resistance: down.
- Invalidation is clear at 0.0
HOME+0.99%
This time, what I think was most crucial in holding onto the $NEAR long was splitting the take-profit into several stages instead of waiting for one key level.
The entry price was around 1.8725. When it rose to the first target, I closed 30% first, instantly lowering the cost basis of the position. I set a protective stop for the remaining 70% and patiently waited for higher levels. Honestly, no one can guarantee selling at the key level. Locking in part of the profit and letting the remaining position continue to run actually makes it easier to hold the trade steadily.
There was one quick pul
post-image
NEAR-2.05%
ETH+1.40%
SOL+1.43%
Don’t just show your profits! What’s really interesting is why you dared to bet on this side.
Recently, after taking part in Gate’s event contract P&L-sharing challenge, I found that the most interesting part of this format isn’t simply showing how much you made, but laying out your full market judgment.
The biggest appeal of event contracts is that every choice is based on a clear question: up or down? Breakout or pullback? Will a certain event ultimately happen?
My approach has always been fairly simple: look at the macro picture first, then price, and finally market sentiment. For example,
BTC+0.34%
Everyone’s staring at the 2.19 support while the 4H quietly prints a 95% long setup—are you late or early?

NEAR/USDT - LONG

Trade Plan:
Entry: 2.1819 – 2.2029
SL: 2.0917
TP1: 2.2679
TP2: 2.3182
TP3: 2.3937

Why this setup?
- The 1D trend is bullish, and price is coiling right at the 2.1924 reference—this is the “calm before expansion” zone.
- RSI on 15m sits at 49.61—neutral, meaning no overbought friction to block a push toward TP1 (2.2679) or TP2 (2.3182).
- ATR (0.0419) shows volatility is compressed—when it breaks, the move is fast. Entry window: 2.1819–2.2029. Invalidation only b
I’m LONG dogecoin:native
The market is barely pricing DogeOS
It brings an EVM compatible app layer to Dogecoin with DOGE as gas, opening the door for an entire onchain economy to form around it (yes memecoins on doge)
At the same time: DOGE1 targets launch this month, DOGE payments are live across 6,000+ merchants, DOGE Pay is coming, House of Doge is now public and ETF access is live
DOGE already had the liquidity and distribution and without utility it peaked near $90 BN
It's gonna get really silly from here and chart giving generational entries
post-image
DOGE+6.41%
Everyone’s staring at SLX, but the 4h chart is quietly screaming a warning that nobody wants to hear.

$SLX /USDT - SHORT

Trade Plan:
Entry: 0.0703 – 0.0706
SL: 0.0719
TP1: 0.0694
TP2: 0.0687
TP3: 0.0676

Why this setup?
- Range-bound 1D trend means breakouts are fake—mean reversion rules.
- RSI 15m at 59 shows a weak bounce, not a reversal; momentum is stalling below 0.0705.
- ATR 1h of 0.0006 gives tight stops—perfect for a controlled short.
- Why now? The entry zone (0.0703–0.0706) is the exact rejection area; with TP1 at 0.0694, the risk/reward is 2:1 before the daily range even
SLX-0.48%
Everyone’s chasing SKYAI’s bounce—but the 4H chart just whispered a 95% secret.

$SKYAI /USDT - SHORT

Trade Plan:
Entry: 0.06135 – 0.06199
SL: 0.06472
TP1: 0.05938
TP2: 0.05786
TP3: 0.05557

Why this setup?
Why now? The daily trend is still bearish, yet the 15m RSI (63.55) shows a weak bounce—a classic bull trap. Price sits at 0.06167, hugging the 1H pivot. ATR (0.00127) is tight, meaning the breakout is coiled. Targets down: TP1 0.05938, TP2 0.05786. The invalidation at 0.05841 is far—room to breathe.

Debate:
Is this the final flush before SKYAI dumps to TP2, or are we early on a fakeou
SKYAI+6.53%
I didn’t enter immediately during the first wave of decline because after this kind of rapid sell-off, there is often an exaggerated rebound, and chasing shorts can easily result in getting stopped out badly. So at the time, I only marked a key zone at the highs and didn’t rush to act. The price did rebound afterward as expected, but near the key zone, it failed to show the rebound strength it should have had, with each lower-timeframe candlestick weaker than the last. Only then did I enter short in the direction of the decline. Since the entry was relatively close to the key zone, setting the
post-image
ETH+1.40%
BNB+6.62%
market overview
live-cover
LIVE1,092
📊 $CRV looking interesting.
The level to watch is $0.40–$0.45 on the weekly.
• Flip + hold ✓ → 1W 200EMA next
And if $CRV flips the 1W 200EMA into support, then $1.0–$1.4 comes into play for the med term. 📈✍️
#CRV #CRVUSDT #Curve #Alts #Crypto
post-image
CRV+10.88%
Everyone’s watching gold—but XAG/USDT just printed a 4h setup most traders will ignore until it’s gone.

$XAG /USDT - SHORT

Trade Plan:
Entry: 66.19 – 66.25
SL: 66.49
TP1: 66.02
TP2: 65.88
TP3: 65.68

Why this setup?
- RSI on 15m is crushed at 34.69—momentum is already bleeding, not waiting for price.
- 1D trend is *range*, but the 4h bias flips SHORT at 66.22 with 55% conviction—this is a mean-reversion trap, not a breakout.
- ATR (1h) at 0.1135 means tight stops; TP1 at 66.02 is only 0.3% away—quick scalp before the daily close.
- Why now? The entry zone (66.19–66.25) is the same l
XAG+0.05%
Everyone’s waiting for XRP to explode—what if the real move is already fading?

$XRP /USDT - SHORT

Trade Plan:
Entry: 1.4094 – 1.4140
SL: 1.4340
TP1: 1.3950
TP2: 1.3838
TP3: 1.3671

Why this setup?
- 4h bias is SHORT at 55% confidence, but this isn’t a knockout punch—it’s a grind.
- Price sits at 1.4117 with a tight 1.4140 ceiling; RSI 15m at 42.2 shows zero buying urgency.
- TP1 at 1.3950 is only 1.2% away—that’s the low-hanging fruit before the daily range traps you.
- Why now? The 1D is rangebound, so momentum dies fast. You’re not betting on a crash, you’re selling the stall.

D
XRP+1.25%
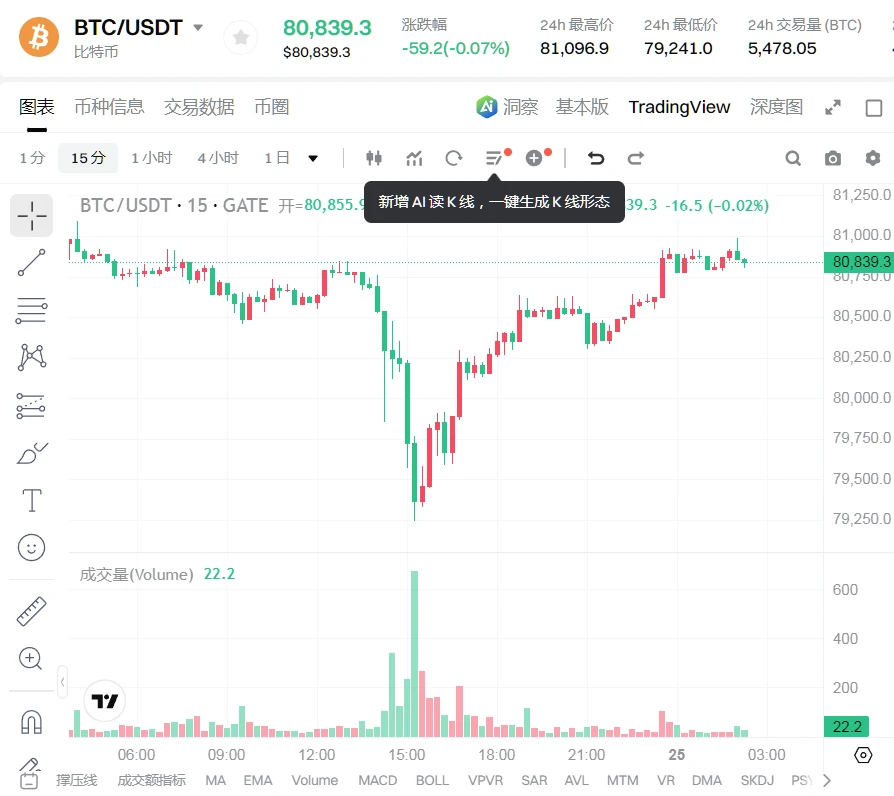
Everyone’s watching 80K, but I’m watching the 4h chart bleed—$BTC /USDT is about to fake you out.

$BTC /USDT - SHORT

Trade Plan:
Entry: 79698.9 – 79816.3
SL: 80321.3
TP1: 79334.9
TP2: 79053.0
TP3: 78630.3

Why this setup?
Why now? The 1D is rangebound, yet the 4h structure is cracking. RSI on the 15m is at 43 and falling—no bounce fuel. ATR is tight (234), meaning the breakout is coming, not optional. Entry at 79,757 with TP2 at 79,053 is a 0.9% scalp, but the real edge is the invalidation at 79,079. If that breaks, the short thesis is dead. This is a low-confidence trap (55%), so size do
BTC+0.34%
$SKYAI /USDT is setting up for a move that could invalidate 95% of traders' hopes.

$SKYAI /USDT - SHORT

Trade Plan:
Entry: 0.06031 – 0.06093
SL: 0.06363
TP1: 0.05836
TP2: 0.05686
TP3: 0.05460

Why this setup?
Why now? The 4h bias is SHORT at 95% confidence, and the daily trend is bearish—this isn’t a guess. Price refs at 0.06062, with immediate downside targets staring at TP1 (0.05836) and TP2 (0.05686). The 15m RSI (54.35) shows only a weak bounce, not a reversal. ATR (0.001254) is tight, meaning the breakout is coiling—not stalling. If we lose 0.06031, the path to invalidation (0.05821)
SKYAI+6.53%
I just switched the app to the background, and it shot right back up—are you playing hide-and-seek with me?

When I checked the chart after lunch, it was still grinding along the bottom, but the K-line had already printed several long lower wicks in a row. When I opened it again in the afternoon, I happened to catch the high-volume breakout. This kind of upward move clearly isn't something retail traders can lift, so I went with the trend and opened a long at 13.489, starting with a small position to test the waters.

Now at 17.821, $SNXX the rally has been very clean, and the return on my p
post-image
SNXX+3.39%
SNDK+1.83%
LAB+1.71%
Load More

Join 40 M users in our growing community

⚡️ Join 40 M users in the crypto craze discussion

💬 Engage with your favorite top creators

👍 See what interests you

View More