Share crypto content and earn up to 60% commissions through content mining.
placeholder
gatefun
gm legends☀️
you deserve some feetpix today 🦶🏻
FRIYAY 🫶
post-image
  • Reward
  • Comment
  • Repost
  • Share
95% win-rate short set up, is $LAB /USDT about to reverse?

LAB_USDT - SHORT

Trading Plan:
Entry: 0.07574 – 0.07668
SL: 0.08073
TP1: 0.07282
TP2: 0.07056
TP3: 0.06717

Why watch this structure?
- Bearish trend on the 4-hour timeframe, with 1D confirming bearishness; the direction is aligned.
- RSI on 15m is at 53.84, with a weak rebound, right in the entry zone.
- Current price is 0.07621, TP1 is at 0.07282, offering 4.5% room; SL is set at 0.08073, making the risk-reward ratio reasonable.
- Why now? Because 1D is pressing down, 4h has just broken down, and a rebound is free money.
LAB11.56%
View Original
post-image
post-image
  • Reward
  • Comment
  • Repost
  • Share
#TopFiveLeaguesPreMatchPredictor ⚽🔥 — AUG 28 | TODAY'S REAL MATCHUP MAP
Forget the usual “big team = guaranteed win” formula.
Today's Top Five Leagues slate gives us $CRM something more interesting:
FAVOURITE vs VALUE
FORM vs HOME ADVANTAGE
ATTACKING QUALITY vs GAME CONTROL
And with the 2026/27 season still in its early stages, the biggest mistake right now is treating a tiny sample size like a full-season trend.
So today's predictions are built around match scripts, not club names.
---
🏴 PREMIER LEAGUE
🔥 Crystal Palace vs Manchester City
This is today's headline Premier League matchup.
Cit
CRM22.26%
post-image
post-image
  • Reward
  • 3
  • Repost
  • Share
ShainingMoon:
To The Moon 🌕
View More
#ENASurgesOver15%InADay
ENA – The 15%+ Surge Day, Full Technical and Trading Breakdown
Current price at the time of writing is around $0.1668–$0.1695 on Gate spot (latest tick $0.1695, ~09:00 UTC, 28 August). ENA did surge more than 15% in a day: the daily candle that closed on 27 August (UTC) opened at $0.14743 and closed at $0.17010, a gain of about +15.4%. It then spiked further this morning to an intraday high of $0.18987–$0.18994 around 01:00–02:00 UTC, which was roughly +21.2% versus the price 24 hours earlier, before being rejected hard and falling back to the current $0.1668–$0.1695 z
post-image
post-image
post-image
post-image
  • Reward
  • 2
  • Repost
  • Share
CryptoCircleRhinoBrother:
Get on board now! 🚗
View More
Multicoin moves millions in $hype whats next for hype?
gate liveLIVE
1,346
live-coin
  • Reward
  • 3
  • Repost
  • Share
Leo_Kai:
Ape In 🚀
View More
JUST IN: Anthropic unveils Model Hardware Standard (MHS) to connect real-world devices via a unified interface, slashing hardware integration time from weeks to hours. $AI
post-image
  • Reward
  • Comment
  • Repost
  • Share
$The bull is here. Not selling now—I sold way too early.
牛来-1.38%
View Original
post-image
  • Reward
  • Comment
  • Repost
  • Share
#Gate首发上线日股交易 I’m putting my own skin in the game and holding this hidden-gem stock for now!! I’ll capitalize on the next big move first!! But the slippage is really severe!
View Original
post-image
7203
Stock
Return %
-2.6%
Cost Price
3,199.44
Last Price
3,116
  • Reward
  • Comment
  • Repost
  • Share
Tonight, war is declared
A “brain-burning combination” has emerged in global markets:
- U.S. stocks rose across the board, with the Nasdaq gaining more than 1%;
- Gold fell below $4,600, while oil prices resumed their rise;
- The 10-year U.S. Treasury yield briefly reached 4.67%, while the 30-year U.S. Treasury yield briefly reached 5.19%—both not far from the two key figures of “4.7% and 5.2.”
First, before this, Kansas City Fed President Schmid said that “interest rates are currently not restraining the U.S. economy,” triggering traders’ concerns that Wash may deliver a hawkish speech at tom
NAS100-0.10%
GLDX0.76%
PAXG0.54%
XAUUSD-0.01%
NVDA8.55%
View Original
post-image
冠冕之王
0/50
Futures
30D ROITrader PnL
+8.46%
+5,218.12
Win Rate
--
AUM
0
Copiers PnL
--
TRUMPUSDT
Long
Cross 75X
Return %
+3842.76%
Entry Price(USDT)
1.748
Mark Price(USDT)
2.702
  • Reward
  • Comment
  • Repost
  • Share
This trend, I don't even need to think—the account is partying on its own.
When the intraday plunge happened, I watched that rebound for ages. The higher it bounced, the weaker it looked, volume couldn't keep up at all, and the overhead resistance was crystal clear. To bears, this kind of low-volume rebound is a free point, so I made my bearish call directly around 0.02063 without hesitation.
The market played fair enough—it didn't dawdle for long before heading steadily lower, sliding to 0.00966 now, with +1047% secured. I got the timing right, and it feels great.
I first closed 70% of the po
XRP-0.34%
BTC-0.19%
View Original
post-image
  • Reward
  • Comment
  • Repost
  • Share
A critique of the brain-dead remarks attacked by Jing Tian fans👇
1⃣ Sun-ge kept calling Jing Tian “Mom” just to later request a refund as a minor
2⃣ They were all normal dating expenses; in reality, not a cent was given to her, and even what was given must be returned
3⃣ Don’t spend money from people who have experienced poverty; old money is far more respectable than new money
4⃣ A top-luxury female celebrity shouldn’t date down; a merchant’s shrewd, mercenary nature is on full display
5⃣ Jing Tian was surely after love, not money—she just wanted Sun-ge to show his attitude
I genuinely feel
View Original
post-image
  • Reward
  • Comment
  • Repost
  • Share
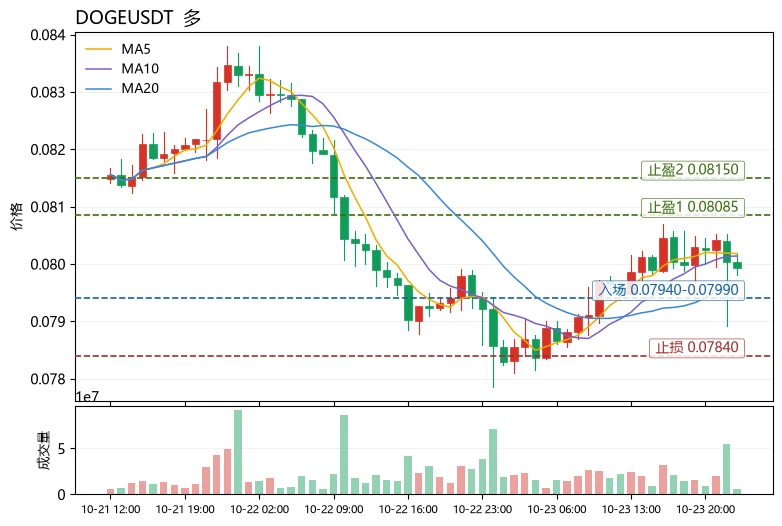
Layout for Bitcoin, Ethereum, and Dogecoin
gate liveLIVE
2,124
  • Reward
  • 6
  • Repost
  • Share
CBOWCRYPTEX:
2026 GOGOGO 👊
View More
#NVIDIAEarnings $NVDA ‌ Bullish vs Bearish: Which Side Has the Stronger Case Now?
NVIDIA's latest earnings have created a fascinating situation for the stock market. The company delivered $96.2 billion in quarterly revenue, an extraordinary 106% year-on-year increase, while adjusted EPS reached $2.22. Even more importantly, NVIDIA guided toward approximately $108 billion in revenue for the following quarter.
At first glance, these numbers look overwhelmingly bullish.
But after such a powerful earnings report, I think traders need to look at both sides of the market.
The real opportunity is n
NVDA-0.03%
post-image
  • Reward
  • Comment
  • Repost
  • Share
The hand that set the stop-loss a few days ago trembled slightly; this morning I realized that was unnecessary filial piety😂. A few days ago before bed, $BTC was still at that level. I checked repeatedly, and the key level held while the critical position kept rising. This pattern is the most likely to produce a decent move. While everyone else was running, I instead felt that the opportunity had arrived.

Got in at 71294.4, opened the chart this morning, and saw 79426.7, +1982.1%. Nailed it, brothers. Getting the rhythm right matters more than anything else; this big chunk of profit feels g
BTC-0.19%
BNB0.03%
SOL2.19%
View Original
post-image
  • Reward
  • Comment
  • Repost
  • Share
📉 $SUN – Bearish momentum in early transition phase
🔴 SUN SHORT
🎯 Entry: 0.016748 – 0.016760
🛑 Stop Loss: 0.017089
🎯 TP: 0.016620 - 0.016252 - 0.016017
🧠 Plan & Logic
The 15‑minute and 5‑minute charts both show a clear downtrend, confirming strong short‑term bearish pressure. Price action is reacting near an important level, so risk management matters here. The setup depends on confirmation around the entry zone and follow-through after the move.
Trade SUN here 👇 📉 🔻
SUN-2.07%
post-image
  • Reward
  • Comment
  • Repost
  • Share
How many people chased the pump to the top, only to get ground into the dirt by the market?
The script was written in advance—took the profits cleanly and decisively!
$BTC $ETH
BTC-0.19%
ETH-0.29%
View Original
post-image
post-image
  • Reward
  • Comment
  • Repost
  • Share
“made up”
“fairy tale”
“delusion”
whatever you wanna call it, who the F is he that he gets to say what cycles when, how cycles behave, what cycle belongs to what
dude is so narcissistic he claims he has authority over the forces of nature and the universe
bro — get over yourself
“GREAT” 🙄😬
post-image
  • Reward
  • Comment
  • Repost
  • Share
#Gate7DayNetInflowsTop3
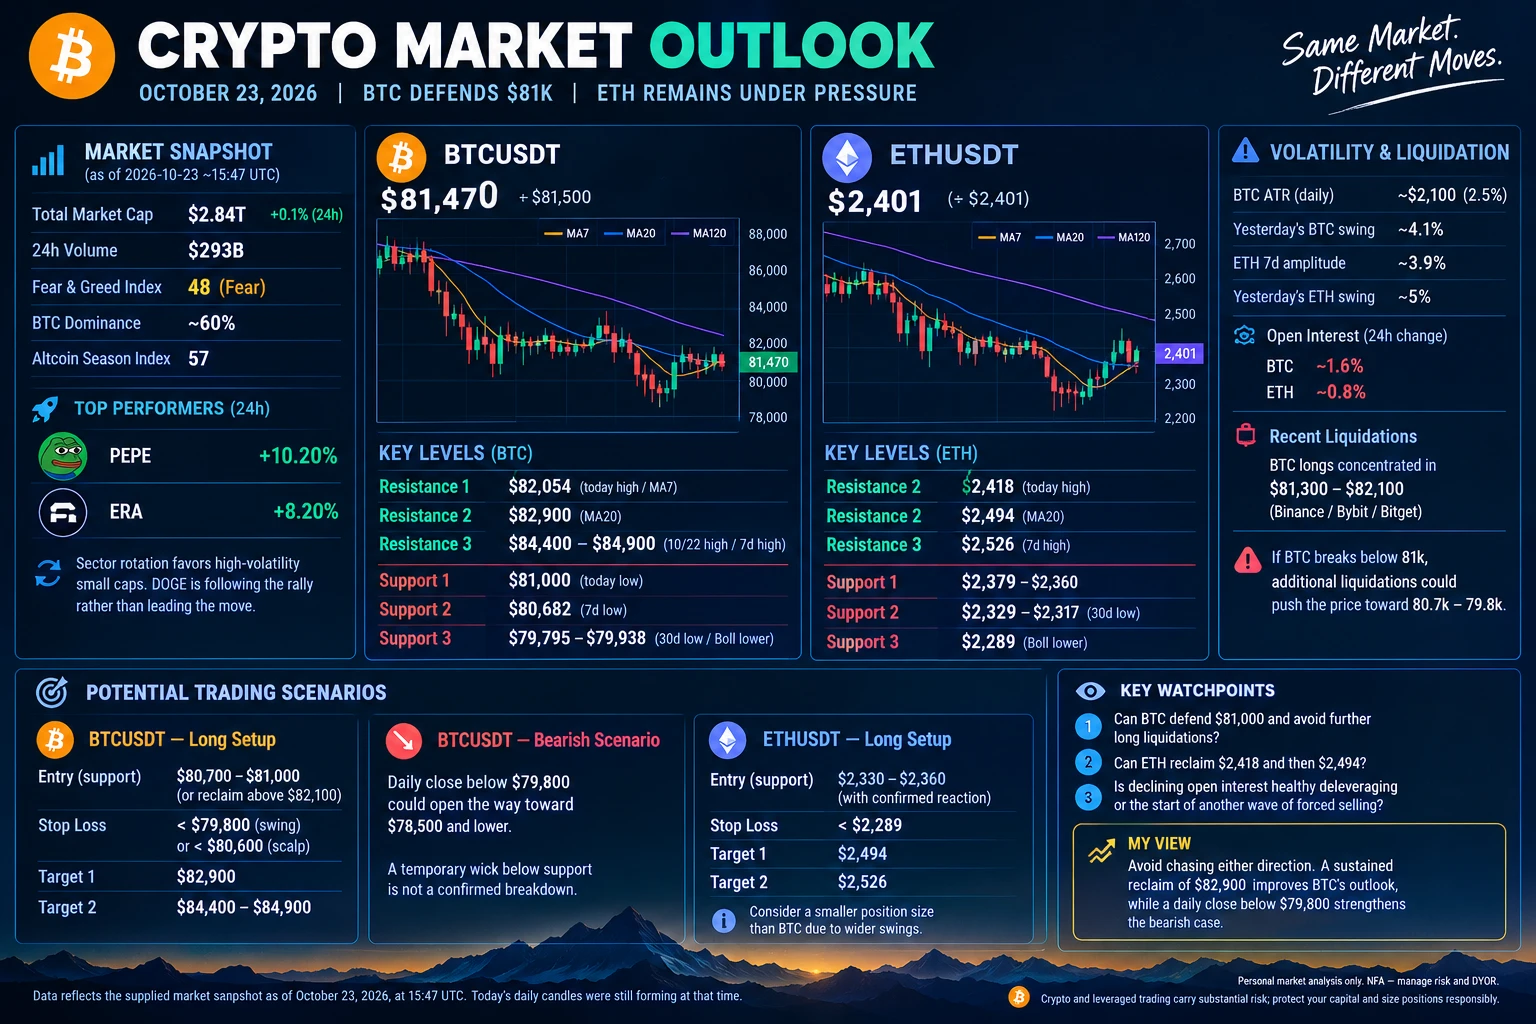
🚨 $201M+ Capital Inflow and a Major BTC/ETH Decision Zone: Is Crypto Preparing for Its Next Big Move?
The crypto market is entering a critical phase, and the numbers coming from exchange activity are becoming impossible to ignore.
Gate recorded more than $201 million in net inflows over the past seven days, placing it among the top three centralized exchanges in the cited flow rankings. At the same time, Gate has remained highly active across major BTC and ETH spot and derivatives trading metrics.
But the most important question is not simply how much money is enteri
BTC-0.16%
ETH-0.25%
post-image
Roselyn
#Gate7DayNetInflowsTop3
🚨 $201M+ Capital Inflow and a Major BTC/ETH Decision Zone: Is Crypto Preparing for Its Next Big Move?
The crypto market is entering a critical phase, and the numbers coming from exchange activity are becoming impossible to ignore.
Gate recorded more than $201 million in net inflows over the past seven days, placing it among the top three centralized exchanges in the cited flow rankings. At the same time, Gate has remained highly active across major BTC and ETH spot and derivatives trading metrics.
But the most important question is not simply how much money is entering an exchange.
The real question is: what are traders preparing to do with that liquidity?
Right now, Bitcoin is trading near $79,929, placing it directly below the massive $80,000 psychological barrier. Ethereum, meanwhile, is sitting near $2,494, almost exactly at the doorstep of the crucial $2,500 level.
That creates an extremely interesting market setup.
When capital flows increase while the two largest cryptocurrencies approach major technical and psychological levels, trading activity can accelerate very quickly. Some traders may be accumulating spot positions. Others may be opening leveraged trades, protecting portfolios with hedges, or preparing for a volatility breakout.
This is why rising exchange inflows should not automatically be treated as bullish.
Higher liquidity creates opportunity in both directions.
For Bitcoin, the entire short-term structure currently revolves around $80,000.
A convincing move above that level, followed by strong volume and sustained buying pressure, could signal that the recent recovery has more room to develop. Breaking a major psychological level is one thing; holding above it is what truly changes market structure.
However, repeated rejection below $80,000 could create a completely different outcome.
In that scenario, traders may begin taking profits after the recent rally. The first important area to watch would be $78,000–$79,000, while a deeper correction could bring attention back toward the $75,000–$76,000 zone.
So for BTC, the market is approaching a simple but important test:
Can buyers break $80,000 and actually maintain control?
Ethereum is facing a similar moment.
ETH around $2,494 means the market is now focused on the $2,500 barrier. A successful move above that level, followed by acceptance and continued momentum, could strengthen the bullish structure.
But if ETH fails to establish itself above $2,500, the market could revisit the $2,400–$2,450 support region.
What makes the current situation more interesting is the combination of price and participation.
Major exchanges have recently experienced elevated BTC and ETH spot trading activity, while Gate's BTC spot volume alone exceeded $1 billion in the cited data. This suggests that the market is not operating with weak participation.
Liquidity is increasing.
Trading interest is increasing.
And both BTC and ETH are testing levels that could influence the next major directional move.
📌 The key levels now are clear:
🔸 BTC $80,000: Major breakout and confirmation zone
🔸 BTC $78,000–$79,000: First important support
🔸 BTC $75,000–$76,000: Deeper correction zone
🔸 ETH $2,500: Critical psychological resistance
🔸 ETH $2,400–$2,450: Important short-term support
My view is that the $201M+ seven-day inflow figure is more significant as a participation signal than as a direct price prediction.
Capital entering an exchange does not guarantee that BTC or ETH will rise. What it does suggest is that more market participants may be preparing to trade, rotate capital, hedge risk and react to expanding volatility.
And that matters enormously when Bitcoin is sitting just below $80,000 and Ethereum is challenging $2,500.
If BTC successfully establishes itself above $80,000 while ETH turns $2,500 into support, the combination of stronger liquidity, elevated volume and rising participation could create a constructive environment for another move higher.
But if both levels reject price and momentum begins to weaken, the market may simply be entering a consolidation phase after a powerful recovery.
So I am watching one thing above everything else:
Not just where the capital is flowing — but how price reacts when that capital meets the market's biggest resistance levels.
$201M+ in seven-day inflows and top-tier trading activity suggest that liquidity is building.
Now BTC and ETH have to deliver the confirmation.
The money is
The traders are becoming more active.
And the next major test is already here.
Will $80,000 become Bitcoin's next support?
Will Ethereum finally establish itself above $2,500?
The next breakout — or rejection — may answer both question.
@Gate_Square
  • Reward
  • 1
  • Repost
  • Share
Yusfirah:
To The Moon 🌕
Sandisk is a great company
i bought many atorage devices from them
stock should do great as well
best wishes for anyone investing
$SNDK
SNDK-0.90%
post-image
post-image
CryptoRock
#GateStockInsightsChallenge +#SNDK
SNDK Market Analysis — Can SanDisk Push Toward $1,800+?
SanDisk (SNDK) remains one of the most aggressive AI-storage and NAND momentum plays in the market. At the price level you provided, $1,566, the stock is already trading at a premium, but the underlying story is still strong. The key question for traders is no longer whether SanDisk has growth potential — it is whether the company can continue converting AI-driven storage demand into higher revenue, margins and cash flow without the market demanding an even higher valuation.
The latest fundamental picture is impressive. SanDisk reported fiscal Q4 revenue of approximately $8.97 billion, up roughly 372% year over year, while non-GAAP EPS came in around $39.25. Management also guided fiscal Q1 2027 revenue to $10.3B–$10.8B and non-GAAP EPS to $44–$46. Datacenter exposure has also increased significantly, while multiyear customer agreements are providing much greater revenue visibility.
This is important because the SNDK story is increasingly connected to the AI infrastructure cycle rather than simply traditional consumer flash memory. AI training and inference require enormous amounts of data storage, and enterprise SSD demand is becoming a major growth engine. SanDisk has indicated that customer demand is growing faster than available supply, which could keep NAND products relatively tight for an extended period.
The bullish side is therefore straightforward: strong earnings, higher enterprise-storage demand, improving product mix, long-term customer commitments and a favorable AI infrastructure environment. Recent reports also highlighted substantial contracted revenue and expectations that NAND supply could remain constrained as demand continues to expand.
However, traders should not ignore the other side of the equation. SNDK has already experienced extraordinary volatility. The stock previously moved from extremely low levels to above $2,000 before suffering a major correction. That means even excellent earnings can produce sharp pullbacks when expectations become too high. After the latest earnings report, the stock initially sold off despite the strong numbers, showing that investors are watching future guidance and valuation just as closely as historical results.
Current Market Sentiment
My reading of the current sentiment is bullish but highly volatile.
The broader semiconductor environment has received another positive boost from Nvidia's latest outlook, with AI-related stocks including SanDisk receiving renewed attention. Reuters reported that Nvidia's forecast reinforced confidence in continued AI demand, while market coverage showed SanDisk gaining alongside other memory and semiconductor names.
At the same time, SNDK is not a low-risk momentum trade. Valuation is elevated, expectations are high and NAND remains a cyclical industry. A trader buying aggressively after a large rally should therefore have a predefined exit plan rather than relying only on the long-term story.
Key Technical Levels
With $1,566 as the working price level:
Immediate Support 1: $1,500–$1,520
This is the first area I would watch for buyers. If price holds above this zone after a pullback, bullish momentum can remain intact.
Support 2: $1,430–$1,460
This becomes a more important accumulation zone. A controlled correction into this area followed by a strong recovery could provide a better risk/reward setup than chasing price near the highs.
Support 3: $1,330–$1,360
A deeper correction toward this region would not automatically destroy the bullish structure, but momentum traders would need to become more defensive.
Resistance 1: $1,600–$1,630
This is the first psychological breakout zone. A strong daily close above $1,630 with increasing volume would improve the probability of another upward leg.
Resistance 2: $1,700–$1,750
This is the next major target area. If SNDK breaks $1,630 convincingly, momentum traders may start targeting this region.
Resistance 3: $1,850–$1,900
This is my aggressive upside zone. Reaching it would require continued semiconductor strength, strong AI-storage sentiment and buyers remaining willing to pay a premium valuation.
Trading Strategy
For traders already holding SNDK around current levels, I would avoid panic selling simply because the stock is volatile. Instead, protect profits progressively. A practical approach is to hold while price remains above the $1,500 area and consider reducing exposure if the stock loses that level decisively.
For a fresh entry, I would not chase a vertical move. The better setup would be either a controlled pullback toward $1,500–$1,520 followed by a bullish reversal, or a confirmed breakout above $1,630 with strong volume.
A momentum breakout strategy could use $1,630–$1,650 as the confirmation area, with initial targets around $1,700, $1,800 and $1,900.
For risk management, an aggressive trading stop could sit around $1,490, while a wider swing-trading invalidation area could be around $1,420–$1,430. These are trading levels, not guarantees, and position size should be adjusted according to volatility.
My Forecast
Base case: $1,700–$1,800.
Bull case: $1,850–$2,000 if AI semiconductor momentum remains strong and SNDK successfully breaks the $1,630–$1,650 resistance zone.
Extreme bullish case: $2,100+ becomes possible if NAND pricing remains exceptionally strong, enterprise SSD demand accelerates and investors continue expanding the valuation multiple.
Bear case: A break below $1,500 could send the stock toward $1,430 and potentially $1,330–$1,360. Below those levels, the market would need to reassess whether the recent momentum has genuinely weakened.
What Are Traders Thinking?
The main bullish argument among traders is that SanDisk is positioned directly inside the AI-storage expansion. The company is seeing stronger datacenter exposure, higher demand and significant customer commitments. That gives bulls confidence that the current NAND cycle may have more room to run.
The bears, however, are focused on valuation and expectations. Analyst targets are not uniform: some firms have raised targets substantially, while others have remained more cautious because of valuation and the possibility that NAND pricing growth moderates. RBC, for example, raised its target to $1,300 while retaining a Sector Perform rating, illustrating how divided the Street can be even after very strong results.
That disagreement itself creates volatility.
Final View
At $1,566, SNDK is still a high-momentum bullish setup, but it is no longer a stock where risk can be ignored. The fundamental story remains powerful: AI infrastructure, enterprise SSD growth, tight NAND supply, stronger margins and long-term customer commitments are all supportive.
My preferred roadmap is simple: $1,500–$1,520 is the first support zone, $1,630 is the key breakout trigger, $1,700–$1,800 is the first major upside objective, and $1,850–$1,900 is the aggressive target zone.
If SNDK breaks and holds above $1,630, the next move could become surprisingly fast because momentum traders may return aggressively. If it loses $1,500, patience becomes more important and the $1,430–$1,460 region becomes the next area to monitor.
Overall, I remain bullish above $1,500, cautiously bullish between $1,430–$1,500, and significantly more defensive below $1,430.
The biggest lesson for SNDK traders right now: do not confuse a strong company with a low-risk stock. SanDisk may have a powerful AI-storage story, but after such an enormous run, disciplined entries, predefined stops and profit-taking matter just as much as the bullish thesis.
repost-content-media
  • Reward
  • Comment
  • Repost
  • Share
Follow the sharks and profit—subscribe at a discount.
View Original
post-image
  • Reward
  • Comment
  • Repost
  • Share
Load More

Join 40 M users in our growing community

⚡️ Join 40 M users in the crypto craze discussion
💬 Engage with your favorite top creators
👍 See what interests you
  • Pinned