Share your thoughts
placeholder
Article
🚨 $BREW SKYROCKETS +81% Nearly 6X From the Bottom ⚠️🚀
📊 $BREW /USDT
📈 Direction: LONG
⚡ Leverage: 3x
🎯 Entry Zone: 0.01300 – 0.01450
🎯 Take Profit Targets:
TP1: 0.01600 +30%
TP2: 0.01900 +62%
TP3: 0.02200 +102%
🛑 Stop Loss: 0.01150
$BREW ‌#GateTop4MainstreamCEX
post-image
BREW+75.86%
  • 10
  • 1
$1000 to $100,000 Crypto Trade Challenge Today
live-cover
LIVE474
Everyone is missing the one signal that makes SYMBOL a setup for a 10% drop.

$BZ /USDT - SHORT

Trade Plan:
Entry: 111.14 – 111.62
SL: 114.37
TP1: 109.14
TP2: 107.65
TP3: 105.41

Why this setup?
Why now? The 4h trend is range-bound, but the 1h ATR of 0.956936 confirms enough momentum to push through the range. The 15m RSI at 72.76 shows the asset is overbought, meaning a reversal is overdue. The entry zone between 111.14 and 111.62 sits right at the 1h price of 111.31, offering a precise trigger for a short. TP1 at 109.14 and TP2 at 107.65 define a realistic two-tier profit target, while t
BZ+5.36%
This isn’t a rebound—it’s just inserting a tube into an account that’s about to blow up.
I opened the charts this morning and found the rebound lacking strength; every push upward was just short of breaking through. I kept checking the key levels above, and shorting when they failed to break through was the obvious move.
$TAG ’s price action didn’t disappoint me, falling from 0.0010303 to the current 0.0005927, while delivering a satisfying +836.86%. I’ve taken 80% off the table and am keeping the remaining 20% at breakeven—don’t let the profits turn into losses.
I’d rather miss a few bites of
post-image
TAG-11.70%
XRP-3.80%
BTC-1.74%
Damn, I really cooked
post-image
  • 1
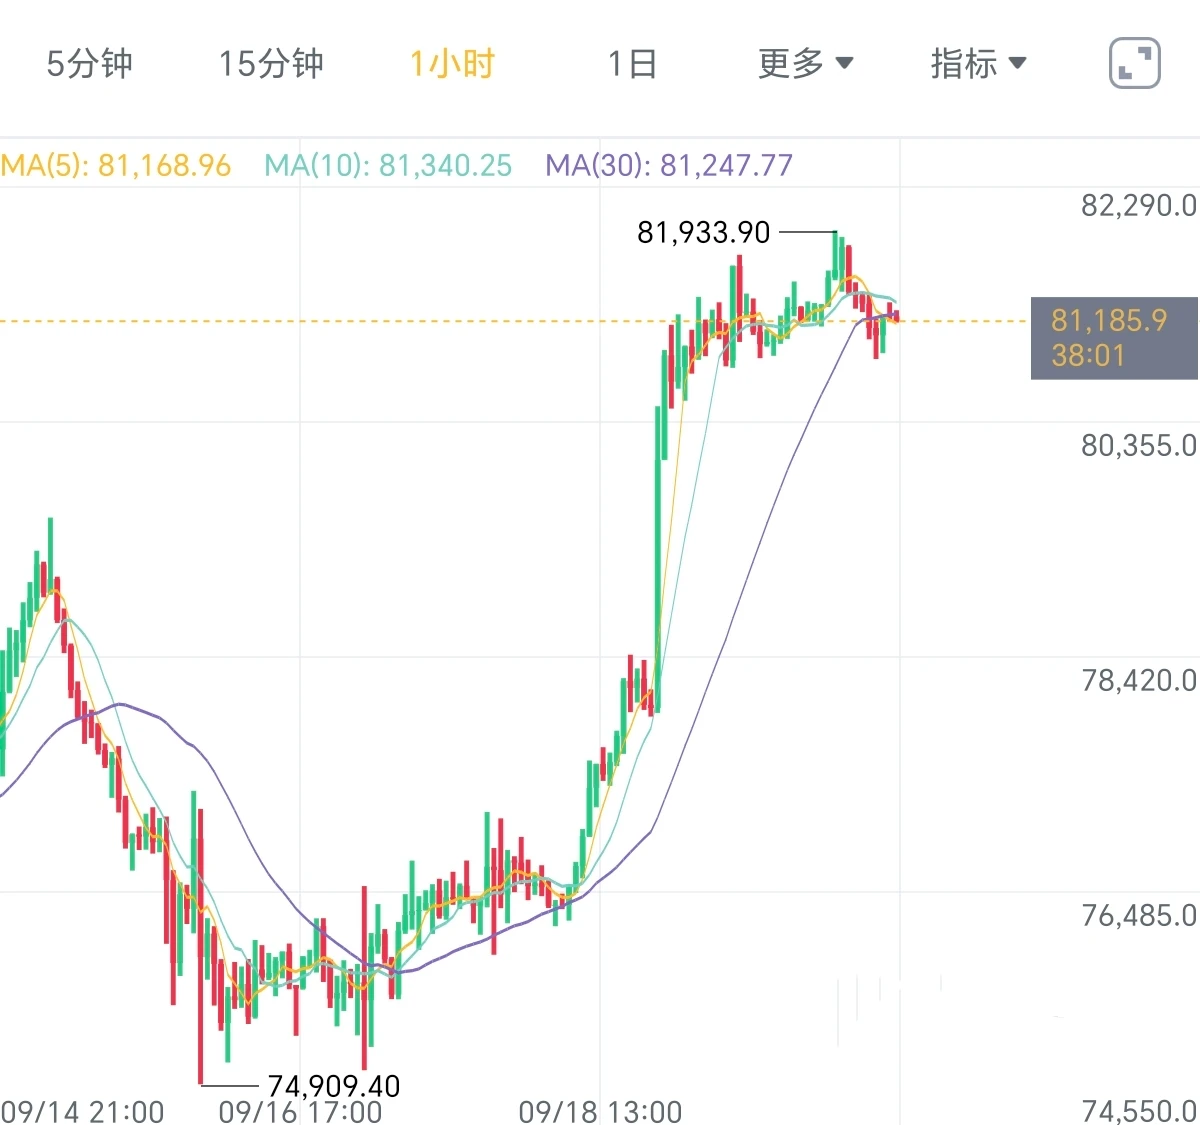
JUST IN: Spot $BTC ETFs sold $166M over two days.
Hesitation at $80k or full trend reversal?
post-image
BTC-1.74%
  • 3
Insiders are watching $HYPE /USDT like a hawk right now.

$HYPE /USDT - LONG

Trade Plan:
Entry: 80.069 – 80.673
SL: 76.600
TP1: 83.199
TP2: 85.085
TP3: 87.914

Why this setup?
Why now? The daily trend is bullish, giving the 1h price of 80.371 a clear upward backdrop. The 15m RSI sits at 37.31, showing the asset is not overbought and has room to run before exhaustion. The 1h ATR of 1.208753 tells us volatility is active enough to push toward the first target of 83.199 and the second target of 85.085. The entry zone between 80.069 and 80.673 offers a defined risk window, and the invalidation
HYPE-4.91%
I wasn’t watching the charts or using my brain—it was jumping around on its own, like it was working overtime for me. While everything else was running, $GRVT ’s rebounds kept getting weaker, with every push higher falling just short. I didn’t panic along with it; instead, I kept holding the short. The logic is simple: if no one catches it on the way up, the rise is meaningless.

I just took a quick look, and the price is already at 0.172. The profit from shorting at 0.2933 has reached +814.31%. I’ve taken profit on 80% of the short, and moved the stop-loss on the remaining 20% to breakeven.
post-image
GRVT+7.58%
LAB-7.90%
BTC-1.74%
Nobody is talking about the 15m RSI reading that changes everything for $XAU /USDT.

$XAU /USDT - LONG

Trade Plan:
Entry: 4319.78 – 4328.98
SL: 4266.91
TP1: 4367.48
TP2: 4396.22
TP3: 4439.32

Why this setup?
Why now? The 1h price sits at 4324.38 inside a tight daily range, and a 15m RSI of 21.56 signals extreme oversold exhaustion that rarely lasts. The 1h ATR of 18.42 means each candle holds enough volatility to push $XAU /USDT from the entry zone into the first target at 4367.48 with room to spare. If momentum catches, the second target at 4396.22 becomes the real battleground, while the
XAU-1.76%
Everyone is fading the daily bearish trend, but SYUI is quietly building a long.

$SUI /USDT - LONG

Trade Plan:
Entry: 0.736 – 0.742
SL: 0.699
TP1: 0.769
TP2: 0.789
TP3: 0.819

Why this setup?
Why now? The 1h price is holding at 0.739 while the 15m RSI plunges to 26.93, signaling a deep oversold bounce within a broader bearish 1D trend. The 1h ATR of 0.01285 defines the volatility envelope that makes the 0.736 to 0.742 entry zone a precise scalp. Hitting TP1 at 0.769 rewards the reversal, while TP2 at 0.789 captures the full mean return against the daily structure. The line in the sand is
SUI-5.43%
A few days ago, I was still calculating whether I had enough money for instant noodles this month; this morning, I was already wondering whether to add sausage.
A few days ago before bed, I glanced at $DELL . It actually held firm after the pullback, with clear signs of buyers stepping in below. I only left one comment at the time: if it doesn't break on the pullback, you can try a long. After opening long, it ran from 453.65 to 504.6. After exiting with +541.25%, I feel great, brothers.
Don't lose patience in the range, only to try to regain your dignity in a one-way move. Managing risk upfron
post-image
DELL-5.54%
BTC-1.74%
BNB-1.39%
This trend doesn’t even require me to think—the account is dancing on its own. A few nights ago, the last thing I saw before bed was $WLD holding firm after a pullback, with the key level intact and buying pressure strengthening, so I casually reminded everyone: don’t panic, the structure is still there. Then I woke up to find it had done the job all by itself.

It pushed from 0.3669 all the way to 0.4026, with +696.7% right before our eyes. It was really sluggish at first, but the result is truly satisfying. Those already on board should have woken up laughing.

Take 70% off first—don’t ge
post-image
WLD-3.75%
SOL-2.27%
DOGE-3.06%
This yield has me feeling apprehensive, worried the market will come to its senses tomorrow and blacklist me. It was still barely moving when I checked the chart after lunch, then it climbed back up on its own an hour later, putting me in a very passive position.
The key level held, and the pullback stabilized—that’s the only thing I’m watching. Opened a long around 0.4156, with a simple reminder: hold it, don’t mess around.
Then $PONS reached 0.5771, with unrealized gains of +767.12%. Time to treat myself to a good meal; this windfall was casually tossed out by the market.
Hold as long as the
post-image
PONS-11.31%
ETH-0.62%
SNDK-4.30%
Insiders are quietly pressing SHORT on PEPE as the 1h ATR collapses to zero.

$PEPE /USDT - SHORT

Trade Plan:
Entry: 0 – 0
SL: 0
TP1: 0
TP2: 0
TP3: 0

Why this setup?
Why now? The daily trend is range-bound, which often precedes a directional breakdown, and the 1h RSI has dropped to 25.41, signaling extreme bearish momentum. The 1h ATR reading of zero indicates that volatility has completely compressed, a classic setup before a sharp move. The entry zone is pinned at the 1h price level of zero, giving a precise reference for the short bias. The first target aligns with the same zero level,
PEPE-6.04%
$OPG ‌OPG (OpenGradient)
📉 Short
Entry: 0.1010 – 0.1030
TP1: 0.0980 / TP2: 0.0955 / TP3: 0.0935
SL: 0.1045
📈 Long
Entry: 0.0950 – 0.0960
TP1: 0.0980 / TP2: 0.1000 / TP3: 0.1020
SL: 0.0930
🔑 Key Levels
Resistance: 0.1012 / 0.1030
Support: 0.0953 / 0.0938
⚠️ Not financial advice. DYOR and manage your risk.
post-image
OPG+0.21%
Gate Makes It into the Mainstream CEX Top 4—Are 60 Million Users Just the Beginning?
Competition among crypto exchanges has long been about more than simply comparing trading volume. User base, product diversity, liquidity, security systems, and global reach are jointly determining the overall strength of a CEX.
Gate has now entered the mainstream CEX Top 4, and this position carries real weight. Especially after surpassing 60 million global users, the platform has built a considerable user base.
What is even more noteworthy is that Gate is not focusing solely on traditional spot and futures t
MEME-3.48%
  • 27
A few days ago, I was still calculating whether I had enough money for instant noodles this month; this morning, I was already wondering whether to add sausage. After lunch, when I checked the charts, $AIOT started moving from 0.04200. I saw the bottom consolidation had ended and buying pressure was taking over, so I opened a long directly.
While others were still waiting and watching, I had already made the direction clear: get in once the pullback holds. The logic was simple and straightforward.
Now it has reached 0.04318, with a +13.04% gain. It feels great. It was truly sluggish at first,
post-image
AIOT+3.08%
SOL-2.27%
SNDK-4.30%
Insiders are quietly pressing SHORT on SYMBOL while the 1h RSI screams overbought.

$CL /USDT - SHORT

Trade Plan:
Entry: 102.19 – 102.69
SL: 105.57
TP1: 100.10
TP2: 98.53
TP3: 96.19

Why this setup?
Why now? The daily trend is range, but the 1h ATR of 1.001904 shows volatility is compressing into a tight band around the 1h price of 102.42, setting up a sharp move. The 15m RSI sits at 82.06, confirming the short bias with momentum exhausted on the bounce. Entry aligns at 102.44 against a 1h price that has tested 102.69, giving TP1 at 100.10 and TP2 at 98.53. The invalidation level at 92.82
CL+5.61%
Nobody is talking about this hidden IOST setup hiding in plain sight.

$IOST /USDT - SHORT

Trade Plan:
Entry: 0.000963 – 0.001018
SL: 0.001255
TP1: 0.000793
TP2: 0.000661
TP3: 0.000463

Why this setup?
Why now? The 4h trend is range-bound, which often precedes explosive directional moves when price finally breaks. The 1h ATR of 0.00011 shows volatility is compressed, setting the stage for a sharp impulse. The 15m RSI at 31.72 confirms oversold momentum, supporting the short bias. Entry is anchored at 0.000991 with targets at 0.000793 and 0.000661, while the invalidation level at 0.001034 a
IOST-46.82%
Load More

Join 40 M users in our growing community

⚡️ Join 40 M users in the crypto craze discussion

💬 Engage with your favorite top creators

👍 See what interests you